

Abstract
Objective
We propose and study a new model aimed at describing the low-dose hyper-radiosensitivity phenomenon appearing in the survival curves of different cell lines.
Methods
The model uses the induced repair assumption, considering that the critical dose at which this mechanism begins to act varies from cell to cell in a given population. The model proposed is compared with the linear-quadratic model and the modified linear-quadratic model, which is commonly used in literature and in which the induced repair is taken into account in a heuristic way. The survival curve for the MCF-7 line of human breast cancer is measured at low absorbed doses and the uncertainties in these doses are estimated using thermoluminiscent dosemeters.
Results
It is shown that these multicellular spheroids present low-dose hyper-radiosensitivity. The new model permits an accurate description of the data of two human cell lines (previously published) and of the multicellular spheroids of the MCF-7 line here measured.
Conclusion
The model shows enough flexibility to account for data with very different characteristics and considers in a faithful way the hypothesis of the repair induction.
Low-dose hyper-radiosensitivity (LDHRS) is a phenomenon that enables explanation of the differences between the predictions of the linear-quadratic (LQ) model and the experimental values observed in the survival curves of many cell lines for doses below 1 Gy. Specifically, when the LQ model is fitted to survival curves, the α parameter obtained when doses smaller than 0.5 Gy are considered is much larger than the value found when doses equal to or larger than 1 Gy are taken into account [1].
LDHRS was first described by Marples and Joiner [2] when they studied the response to radiation of the cell line V79 of the Chinese hamster, though it had been observed some years before in various experiments with animals and plants [3,4]. Since then, it has emerged in many cell lines of both tumour and normal tissues [4], as well as in human metastatic tumours [5]. Its possible application to irradiate radioresistant tumours using ultrafractionated schemes has been investigated [5-7]. The LDHRS influence on the normal tissue response in fractionated regimes [8] and in low-dose fractionated radiotherapy concurrent with chemotherapy [9] has also been investigated. This is an important point because the use of intensity-modulated radiotherapy implies the irradiation of large volumes of normal tissue with small doses per fraction. Though the results are not conclusive, the investigation of the possible applications of LDHRS in clinical situations is promising [9-12].
The observation of LDHRS requires knowledge of how the cell survival varies with the absorbed dose for doses below 0.5 Gy, and this requires that both the dose and the survival must be accurately determined, the methods employed must be carefully analysed and the corresponding uncertainties must be calculated in detail. However, it is not usual to provide information concerning the uncertainties of the absorbed doses, the geometry of the irradiation, the radiation source configuration and that of the samples. LDHRS has been studied with sources of 240- to 250-kVp X-rays [2,13,14],60Co [15] and 137Cs [6], and it is reasonable to expect that the geometry of the experiments performed and the characteristics of the devices used as sources may be important. Some authors [2,16] have pointed out the necessity of an irradiation time long enough to avoid the instabilities in the X-ray equipment at the beginning of the irradiation or the influence of the dose rate on the sensitivity. Other works (e.g. reference 14) do not say anything in this respect. It seems reasonable to think that, even if the uncertainty of the absorbed dose is negligible and the works quoted become unaffected, a detailed study of this point is pertinent.
The manner in which the colonies formed from the surviving cells in clonogenic assays are determined is well developed, providing sufficient accuracy. This is the case of the dynamic microscopic image processing scanner (DMIPS) method [2] used by Joiner et al [4] in the most important series of works about low-dose hypersensitivity to date. Nevertheless, Chandna et al [15] have shown that LDHRS can be observed without using sophisticated methods like DMIPS, simply by means of the traditional clonogenic assay.
The most plausible hypothesis to explain LDHRS is the induction of DNA repair mechanisms that act (or are triggered off) only when a given threshold dose is reached [4,13], and some repair pathways related to this phenomenon have been shown [17]. Other alternative explanations, such as the existence of sensitive subpopulations or cell groups in different phases of the cycle, seem to have fallen from favour. It is important to note that LDHRS has not been observed for high-linear-energy-transfer radiations (such as neutrons) [2,16], and this indicates that reparation plays an important role. It has also been suggested that the repair induction is a consequence of the fact that the cell cycle is stopped in the G2 phase, because this permits the cell to repair the lesions produced before it divides, and this only occurs for a given threshold dose [18-20]. According to several authors [21-23], this links LDHRS with the so-called dose rate inverse effect [24,25].
Multicellular tumour spheroids (MCTSs) are an in vitro cell culture type consisting of cell aggregates that preserve their cohesion during the cell division and reproduce, better than monolayer culture, the characteristics of the real tumour growth [26]. MCTSs are assumed to describe micrometastases of some in vivo tumours and the initial steps in the tumour growth, when blood vessels have not been generated yet. In MCTSs, as in real tumours, the contacts between cells, which allow signal exchanges and a maintenance of the physical structure of DNA different from those in monolayer culture, can have an important influence in the cell response to radiation [27]. If, as Chandna et al [15] have shown using monolayer cultures, the cell contact and the environment in which cells grow is important for LDHRS to show up, MCTSs can provide very interesting results on this matter.
Our group has developed a method that permits us to determine the MCTS radiosensitivity with enough accuracy and with a minimum perturbation of the experimental samples [28]. As indicated above, these conditions are optimal to show LDHRS, if the phenomenon exists for the cell population under study.
In this work we have investigated LDHRS in MCTS built up with cells of the breast cancer MCF-7 line. We paid special attention to the conditions that permit us to determine the survival with a minimum perturbation of the system. We have also analysed in detail the dosimetric aspects of the irradiation, and we have considered specifically the uncertainties in the absorbed doses. A new model to analyse survival data, when LDHRS occurs, has been developed. In this model, the original idea—that above a given threshold dose, the cell ability for induced repair grows sharply—is included. Additionally, our approach considers the cell-to-cell variability in this threshold dose. None of these points are taken into account in the so-called induced repair model [3], in which, in a heuristic way, the induced repair capacity of the cells is assumed to increase smoothly.
Methods and materials
Cell culture
We used cells of the MCF-7 human breast cancer line, clone BB [29]. Cells were grown routinely in minimum essential medium supplemented with 10% foetal bovine serum. Monolayer cultures were maintained at 37 °C in a humidified atmosphere of 95% air and 5% CO2. Cells used to develop the spheroids were obtained by trypsinisation from exponentially growing monolayers and cultured in the medium described above.
Spheroid cultures were initiated by seeding 1000–1500 cells into each one of the 48-well plates of the 12 boxes used in our experiment, including the standard culture medium. Each of these wells was previously coated with a thin layer of 1% agar (Bacto agar; Difco, Detroit, MI) in order to avoid the cell adherence to the plastic substrate. The 12 boxes were agitated for 18–20 hours. In this way, a single spheroid of about 100-μm diameter was obtained in each well. Once MCTSs formed, the medium was changed every three days.
Irradiation and dosimetry
A radiotherapy 60Co (Theratron 780; Best Theratronics, Ottawa, Canada) was used as the irradiation source. It produces, at the isocentre, a dose rate of 0.021 Gy s–1, at maximum depth and for a field of 10×10 cm. The precision of the time selection system of the equipment is 0.6 s, which agrees with the offset of the unit: both values are taken into account to calculate the irradiation time. To deliver to MCTS doses as small as 0.1 Gy with an acceptable uncertainty, it is necessary to increase the irradiation time and to use a geometry that ensures a homogeneous irradiation of the samples. For this purpose, the culture boxes are situated inside a phantom built up with solid water RW3 (PTW, Freiburg, Germany) slabs at a depth of 20 cm, with an additional 6 cm of the same material on top of it (Figure 1). In this way, the irradiation time needed to deliver 0.1 Gy to the samples is 12 s. A source-to-surface distance of 80 cm was fixed.
Figure 1.

Situation of the samples for the irradiation in a Theratron 780 unit (Best Theratronics, Ottawa, Canada). (a) The culture boxes for spheroids are situated at a depth of 20 cm inside a phantom formed of RW3 slabs of 30×30×1 cm. (b) To reproduce the dosimetric conditions of the irradiation, and taking into account the symmetry of the beam used, we can consider the two possible positions (labelled 1 and 2 in the figure) of the samples in the phantom.
In order to check that this initial estimation of the absorbed doses was correct, a measurement was performed with thermoluminescent dosimeters (TLDs) in conditions similar to those of the irradiation of the spheroids. TLDs were situated in the culture wells in a position similar to that occupied by the spheroids in the boxes during irradiation, and surrounded by material equivalent to water to simulate the culture medium. We used MCP-100 TLDs (TLD Poland, Kraków, Poland), with a TL RA94 reader-analyser (LAB, Kraków, Poland) and a TLDO annealing oven (PTW), calibrated for the energy of 60Co. In this way, the geometry conditions of the irradiation and the effect of the interfaces created by the culture boxes were considered in the dosimetry.
Selection and follow-up of the irradiated spheroids
At the moment of irradiation the MCTSs presented diameters below 300 μm. This allowed us to ensure that their composition was homogeneous, that there were no necrotic nuclei inside them and that the access to oxygen and nutrients was similar for all the cells forming the aggregate [28,30]. In these conditions one can expect that all cells will present a more homogeneous response to irradiation, and also that the proportionality between the volume of the spheroid and the number of cells it includes applies. This enables the use of the model we have developed to obtain the survival fraction from the growth curves of the MCTS after irradiation.
In this work, only those MCTSs with a spherical form were considered: we checked this point by measuring two perpendicular diameters for each spheroid. All MCTSs with a marked asymmetry in their initial growth steps were discarded. Nor did we consider MCTS with growth problems, such as the fusion of two or more aggregates present in the same culture well, the presence of agar fibre in their interior or contamination of the wells. A small number of spheroids failed to grow after irradiation and were therefore excluded from the analysis.
Samples were followed up for 18 days. The number of surviving MCTSs (and the absorbed doses) were 13 (0.08 Gy), 5 (0.15 Gy), 20 (0.23 Gy), 14 (0.31 Gy), 13 (0.48 Gy), 18 (0.65 Gy), 15 (0.80 Gy), 9 (1.15 Gy), 21 (1.54 Gy), 20 (2.42 Gy) and 14 (3.23 Gy). These absorbed doses were determined with TLDs as discussed above. A total of 22 MCTSs were used for control.
Mathematical models
Spheroid growth analysis and cell survival
The measurement of the diameters of each individual MCTS was performed every 2–3 days using an inverted-phase contrast microscope with a measurement scale coupled to the ocular. The volume is calculated assuming that the MCTS is spherical (hence V=πD3/6, with V being the volume and D the diameter).
In the case of the control spheroids, which were not irradiated, the evolution of the MCTS volume with time was described using the Gompertz growth model:
| (1) |
where A′ and a are parameters of the model. To characterise the growth of each spheroid, Equation (1) is fitted to the volumes measured for each aggregate, obtaining the corresponding values V(t0=0)≡V0, A′ and a. To compare the growth curves of different spheroids, they must be normalised as described by Guirado et al [28]. This normalisation does not affect the parameter a, but A′ must be transformed for each spheroid, according to:
 |
(2) |
where VC is the common initial volume chosen for the normalisation. This gives:
 |
(3) |
To analyse the irradiated MCTSs, we used the model developed by Guirado et al [28]. The main assumption in this model is that the volume of the spheroid can be split as:
| (4) |
where Vsurv corresponds to the surviving cells and Vster to the (sterilised) death cells. A scheme of this situation is shown in Figure 2. The surviving cells (dashed curve) are assumed to grow following the Gompertz model described above. As we did not observe any appreciable loss of cell material after irradiation, we considered that death cells remain in the aggregate and contribute to the total volume of the MCTS (solid curve) with a constant (dotted line), time-independent term. We then had:
 |
(5) |
Figure 2.
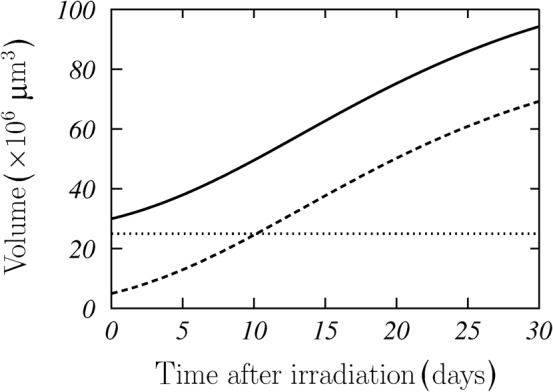
Scheme of regrowth of irradiated multicellular tumour spheroids (MCTSs). Dotted line represents the volume of sterilised cells, dashed line that of the survival ones and solid line the total MCTS volume. These results correspond to V0=30×106 μm3, V0surv=5×106 μm3, A=4.5 and a=0.08 days.
Here, the required normalisation for the A parameter has been included.
As indicated previously, the method to select the valid spheroids and their size at the irradiation moment allows the assumption that the number of cells in a MCTS is proportional to its volume, and therefore the survival can be calculated as:
 |
(6) |
This is done for each individual spheroid.
The ability of this model to describe adequately the growth of MCTS (irradiated or not) and determine the surviving fraction after irradiation has been established by Guirado et al [28]. The main advantage of the regrowth assay with respect to the clonogenic one (both using MCTS) is the minimal perturbation of the system, as the most delicate operation during the experiment is the change of the culture medium every 3 days.
Cell survival models
The analysis of the cell survival in the case of LDHRS is usually done with the LQ model:
| (7) |
where α and β are the model parameters, and d is the absorbed dose.
If the hypothesis of the induced repair (IR) is accepted to explain LDHRS effect, one can assume that α varies with the absorbed dose according to Joiner and Johns [3]:
 |
(8) |
As we can see, α reduces from αs to αr when the dose goes from zero dose to a dose d≫dc. Then, the LQ equation results
 |
(9) |
This modification of the LQ model has been named induced repair (IR) model. The dose dc is the so-called critical dose for the repair stimulation [3].
Equation (9) is the usual model to fit experimental LDHRS data or to perform calculations in which this effect is taken into account [2,6,8]. The condition αs/αr>1 is considered to be a proof of the presence of LDHRS in a given cell population [4]. However, this heuristic approach to describe LDHRS, in which α varies continuously with the absorbed dose, is not fully compatible with the original idea of the induced repair, which assumes the existence of a threshold dose above which the cell capacity for repair increases strongly. This has been taken into account in some alternative models [23].
Here we propose a new model in which, as in that of Leonard [23], a step function is included in our approach, but we do not take into account the dose rate effect. The fundamental component in our model is the variability of the parameters among the various cells in the sample. For a given cell we have:
| (10) |
where H(d) is the Heaviside function (which is zero for d<0 and 1 otherwise). In general one can choose different functional forms for s1(d) and s1q(d), but in this case we have considered:
| (11) |
and
| (12) |
In this way, ln s is a linear function of d below dc, a plausible hypothesis as the quadratic term of the LQ model is negligible for low doses. The critical dose dc here plays the role of a threshold dose. This can be seen in Figure 3a, where we have plotted, with a dashed curve, the survival fraction s, given by Equation (10), as a function of d for dc=0.58 Gy, αs=1.19 Gy–1, αr=0.15 Gy–1 and β=0.07 Gy–2. These values have been obtained from Singh et al [31] and correspond to the fit of the IR model to experimental data of the line L132 of lung epithelial human cells.
Figure 3.

Comparison between the models studied in this work. (a) The survival fraction given by Equation (10) is plotted with a dashed line, the full Monte Carlo calculation with squares and the restricted Monte Carlo calculation with a solid line. (b) The proposed variable induced repair model (dashed line) is compared with the induced repair (solid line) and the linear-quadratic (dotted line) model. In both panels, the dotted vertical line indicates the critical dose dc for the repair stimulation. See the text for the parameters used for the various models.
This function, with a sharp variation at d=dc, is not able to describe experimental data showing LDHRS. However, it is worth noting that this effect is observed for a cell population, not for a single cell. In the case of cell populations, one can expect differences in the responses of the various cells. LDHRS is a dynamic process that is due to DNA damage produced by the radiation and to the functionality of the repair mechanisms [1]. Taking into account that there are different proteins involved in the repair processes and the mechanism regulating the stop in G2, it is plausible to think that there may be a certain variation in the concentration of these proteins, from cell to cell, due to differences in cell stocks, culture conditions, access to the nutrients, cycle phase, oxygenation state and so on, or simply owing to statistical reasons. This variation gives rise to differences, from cell to cell, in the threshold dose dc, and the other model parameters as well.
To account for these variations, we consider that the parameters in Equation (10) follow appropriate probability distributions and that the model is applied to a cell population using standard Monte Carlo techniques. In Figure 3a we have plotted with open squares the average values found for a population of 104 cells, when we assume that the model parameters follow normal distributions N(μ, σ) centred at the values quoted above and with σ=0.2μ in all cases. We have fixed this value of σ to have a notable width in the distributions. In order to understand the role played by the variability of the parameters other than dc, we have performed a restricted Monte Carlo calculation, similar to the previous one, but considering only the distribution of the threshold dose and fixing the other parameters to the values quoted above. The average values obtained in this way have been plotted with a solid curve in the Figure 3a.
As we can see, the average values obtained in both calculations show only a small difference at large doses, where the solid curve overlaps with the dashed curve obtained for a single cell.
This preliminary calculation indicates that the variability of dc from cell to cell is fundamental to describing LDHRS within this model. Therefore, we consider henceforth that only dc follows a probability distribution, while for the other parameters we take the mean value of their respective distributions for all cells in the population under analysis.
According to Equation (10), the average survival of the cell population is obtained as
 |
(13) |
where P(x) is the probability distribution for the critical dose at which the repair induction starts.
The previous equation is the general form of the new model proposed here and one that we have named the variable IR (VIR) model. It is now necessary to fix the probability distribution P(x). In this respect, it is evident that a normal distribution for dc is not adequate because, in that case, negative values could occur when the distribution is sampled. We adopted instead a lognormal distribution for this parameter, which always provides positive values and can be obtained from biological arguments based on the different repair capacities of the particular cells [32,33]. Similar results can be found if a Weibull distribution is chosen. Thus we have used (following Johnson et al [34]):
 |
(14) |
Substituting Equation (14) into Equation (13) we have:
 |
(15) |
where Erf labels the error function:
 |
(16) |
The average dose for the repair stimulation is:
 |
(17) |
Figure 3b shows a comparison of the three models studied in this work. Dotted, solid and dashed lines show the survival fractions obtained for LQ, IR and VIR models, respectively, fitted to the restricted Monte Carlo results shown in Figure 3a. For doses above dc, when all cells in the population have activated the repair mechanisms, which are not present at lower doses, LQ and VIR models coincide. Around this critical dose, the differences between VIR and IR models could be important. This is mainly owing to the fact that the new model takes care of the cell-to-cell variability in the critical dose.
Statistical methods and uncertainties
Owing to the irradiation geometry of the cultures and to the beam symmetry, there are two possible positions for the culture boxes (Figure 1). For each one of these positions, and fixing the same irradiation conditions used for the spheroids, we irradiated 20 TLDs distributed in the 48 possible lodgings of a box. These dosemeters, together with the remaining elements of the dosimetry system (readout unit, delete oven etc.), had been individually characterised and calibrated using a 60Co beam. The uncertainty in the absorbed dose was estimated from the statistical variability of the measurements obtained with the TLDs for each of the two possible irradiation geometries. A relative uncertainty of 5.5% (with a coverage factor k=1) was found.
The procedure to obtain the survival fractions is the same as described in reference 28. First, Equation (1) is fitted to data corresponding to each one of the control spheroids, and this allows the parameters A and a to be obtained. Second, Equation (5) is fitted to the volume data corresponding to each one of the irradiated spheroids, maintaining the parameter a fixed to the value found for the control spheroids; this gives us the volumes V0 and Vsurv. Finally, Equation (6) is used to calculate s for each particular spheroid. The uncertainty in the survival fraction is calculated as the standard deviation of the values of s for all the spheroids that have absorbed a given dose.
The various fits performed in this work to the data from other authors [31,35] and to those obtained for the MCF-7 spheroids here analysed were done using the Levenberg–Marquardt method [36], in which χ2 is minimised. To compare the different models we used the values of χ2 per degree of freedom obtained in the fitting procedure for each case [36]. If we try to describe a set of experimental points {(xi,yi), i=1, 2, …, n}, with uncertainties σi, using a model function f(x; α1, …, αm) with m free parameters, we have
 |
(18) |
The model with the minimum value of χ2 per degree of freedom is the more likely.
Results and discussion
In order to analyse its ability to describe the survival data when LDHRS occurs, we have fitted Equation (15) to two sets of published experimental results, which correspond to monolayer cultures, and to the survival fractions we have obtained in the multicellular spheroid experiment described above.
Figure 4 shows the results of the fit to the experimental data published for the cell line T98G of human glioblastoma [35]. Figure 5 corresponds to the line L132 of human lung epithelial cells [31]. The fits found for the VIR and LQ models have been plotted with dashed and dotted curves, respectively. The fits to these experimental data that we have obtained using the IR model of Equation (9) are given with solid curves. Figures 4a and 5a show a detail of the region where induced repair occurs. In Table 1, the parameters obtained in the fits of the different models to these two data sets are given. In the last row, the average value  calculated from the fitting parameters is shown.
Figure 4.
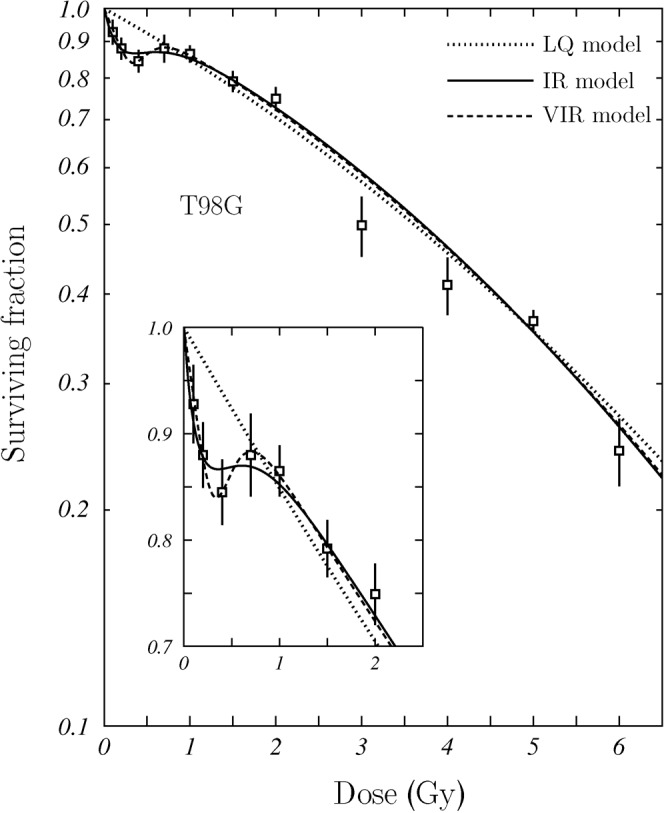
Fit of the survival model proposed in this work to experimental data published for the cell line T98G of human glioblastoma [35]. The fits obtained using the linear-quadratic (LQ) and induced repair (IR) models are plotted as well. A detail of the region in which the induced repair occurs is shown in the inset. VIR, variable induced repair.
Figure 5.

Fit of the survival model proposed in this work to experimental data published for the cell line L132 of human lung epithelial cells [31]. The fits obtained using the linear-quadratic (LQ) and induced repair (IR) models are plotted as well. A detail of the region in which the induced repair occurs is shown in the inset. VIR, variable induced repair.
Table 1. Values of the model parameters obtained after fitting LQ, IR and VIR models to the survival data of the three cell lines analysed in this work.
| Model | Parameters | L132 (Singh et al [31]) | T98G (Short et al [35]) | MCF-7 (this work) |
| LQ | α (Gy–1) | 0.504 (0.370, 0.638) | 0.153 (0.091, 0.215) | 0.677 (0.315, 1.038) |
| β (Gy–1) | −0.030 (−0.078, 0.018) | 0.011 (−0.003, 0.024) | −0.028 (−0.156, 0.100) | |
| χ2 per d.f. | 1.86 | 3.21 | 2.19 | |
| IR | αs (Gy–1) | 1.412 (0.909, 1.914) | 1.343 (0.154, 2.532) | 1.930 (−1.387, 5.248) |
| αr (Gy–1) | 0.200 (0.009, 0.390) | 0.127 (0.079, 0.173) | 0.334 (−0.562, 1.230) | |
| β (Gy–1) | 0.059 (0.001, 0.117) | 0.016 (0.006, 0.026) | 0.085 (−0.209, 0.380) | |
| dc (Gy) | 0.440 (0.202, 0.677) | 0.237 (0.057, 0.417) | 0.411 (−0.649, 1.471) | |
| χ2 per d.f. | 0.44 | 1.26 | 1.75 | |
| VIR | αs (Gy–1) | 1.084 (0.454, 1.715) | 0.666 (0.251, 1.081) | 1.310 (0.460, 2.160) |
| αr (Gy–1) | 0.181 (−0.124, 0.488) | 0.132 (0.088, 0.176) | 0.479 (0.088, 0.870) | |
| β (Gy–1) | 0.063 (−0.021, 0.147) | 0.015 (0.006, 0.025) | 0.038 (−0.101, 0.178) | |
| μ | −0.629 (−1.280, 0.023) | −0.860 (−1.348, −0.372) | −0.723 (−1.206, −0.241) | |
| σ | 0.826 (−0.372, 2.024) | 0.356 (−0.210, 0.923) | 0.147 (−0.463, 1.757) | |
 (Gy) (Gy) |
0.750 (−0.148, 1.648) | 0.451 (0.213, 0.689) | 0.491 (0.275, 0.707) | |
| χ2 per d.f. | 0.51 | 1.29 | 1.61 |
d.f., degree of freedom; IR, induced repair; LQ, linear-quadratic; VIR, variable induced repair.
The ranges between parentheses give the corresponding 95% confidence limits. The corresponding values of the χ2 per degree of freedom for the various fits are also given.
As we can see, the VIR model describes nicely both data sets and fits adequately the trend of the survival curve in the region where LDHRS occurs. This is particularly noticeable in the case of the T98G cellular line (Figure 4). In view of these results, we can say that it is possible to establish a new model (the VIR one) based on the most common biological explanation of the LDHRS phenomenon, which provides a good description of the experimental data available.
The results obtained for the multicellular spheroids of the cell line MCF-7 are shown in Figure 6. Therein, the fits obtained with the LQ, IR and VIR models were plotted with dotted, solid and dashed curves, respectively. The values of the model parameters are also given in Table 1. As for the L132 and T98G cellular lines, the LQ model is unable to describe the survival data in the dose region under analysis. The ratio αs/αr found was 5.78 for IR and 2.78 for VIR. Both values indicate that the MCF-7 cell line shows LDHRS. The model we propose in this work seems to give a better description of the data than the IR model, particularly in the region where LDHRS appears.
Figure 6.

Fit of the survival model proposed in this work [Equation (13)] to the survival data found for the MCF7 clone BB cell line of breast cancer. The fits obtained using the linear-quadratic (LQ) and induced repair (IR) models are plotted as well. Uncertainties correspond to a coverage factor k=1. VIR, variable repair model.
Figure 7 shows the distributions found for the critical dose dc within the VIR model, for the three cellular lines. It is interesting to note that, though the three cell lines show LDHRS in the same dose range, the three distributions are very different, with a long tail for the L132, while that of the MCF-7 is rather close to a normal distribution.
Figure 7.

Lognormal distribution of dc [Equation (14)] for each of the cell lines considered in this work.
As mentioned above, other distributions for dc can be chosen rather than the lognormal one considered here. However, the distribution we have chosen provides an adequate description of the experimental LDHRS data and can be founded biologically. In addition, it has been shown [32,33] that if the distribution of the initial damage is lognormal, after a large number of small, independent, random steps, the resulting parameter has a lognormal distribution. If we consider the repair induction a consequence of the initial damage to DNA, which, after several steps, produces the activation of a new mechanism of cell repair, we can consider that the final distribution of the signal, and that of the dose at which a signal sufficient to activate the mechanism is produced, is a lognormal distribution. The final form of this distribution is strongly dependent on the culture medium in which cells stay, which will condition the oxygen and nutrients distribution in the cell population, and also on the phase of the cellular cycle in which the different cells are (that is, on the proliferative conditions of the population). This means that one can expect differences between different cell populations, or even similar cell populations submitted to different culture conditions.
It is possible to design experiments in which the variability between the different cells can be strongly reduced. For example, taking advantage of the fact that MCF-7 multicellular spheroids are oestrogen-dependent, it would be possible to synchronise the cells in different cycle phases using anti-oestrogens [37]. In this way the effects on the hypersensitivity due to the cellular cycle phase can be studied, and one would be able to evaluate whether the expression of the proteins produced by the various genes involved in cell repair, such as p53, ATM or PARP, is different from those with MCF-7 cells growing in monolayers [38,39].
Cell–cell contacts, which are particularly relevant in real tumours, can influence the response of the cell populations to radiation and the way LDHRS appears. Therefore, it is interesting to study this phenomenon in a tumour model such as MCTS in which those cell–cell contacts are present.
The results obtained point out the flexibility of the VIR model to describe an involved behaviour such as LDHRS in two different situations (such as monolayer cultures and multicellular spheroids). It is worth pointing out that, though they are not directly comparable, the average values dc obtained for the VIR model (Table 1) are larger than the dc ones obtained for the IR model. In any case, the 95% confidence limits of both quantities overlap. This is because of the long tail shown by the distributions, which produces average values larger than the corresponding most probable values.
Though the results discussed above suggest that the new model developed is adequate to describe LDHRS for different cell lines, we have compared it with the other, more classic models (LQ and IR), using the value of χ2 per degree of freedom. We also show in Table 1 the values found for each case. As can be seen, both IR and VIR models provide very similar fits. In fact, the values of χ2 per degree of freedom obtained for these two models are very close and much smaller than the values found for LQ. These results indicate that LQ is not adequate to describe the data of the three cell lines considered in this work. On the other hand, IR and VIR produce fits of a similar quality. The model proposed in this work has the advantage of incorporating the original biological idea considered to explain LDHRS in a simple way.
Conclusions
In this work, we have presented a new model aiming to describe the cell survival when low-dose hyper-radiosensitivity occurs. The new model incorporates, in a simple and straightforward way, the biological description commonly accepted to explain this phenomenon: the mechanism inducing repair is switched on at a given dose, and it is not a gradual transition. This is new, in comparison with the heuristic description of LDHRS in models like IR. In addition, the new approach introduces the variability in the cell response as a fundamental characteristic. The model provides a description of experimental data for various cell lines as good as the one obtained with the modified LQ model, which includes a critical dose for the induced repair. In addition, the new model permits calculation of the distribution of this critical dose for the cell populations studied, in the culture conditions of the experiment.
The radiosensitivity of the multicellular spheroids of the MCF-7 line of human breast cancer has been studied using an analysis methodology that produces a minimal perturbation of the biological material. We have shown how they can be used in an experiment to determine the existence of LDHRS. Our results allow us to establish that LDHRS seems to occur in this cell line, and that the induced repair has a critical dose around 0.5 Gy. However, additional experiments are needed in order to reduce the uncertainties of the experimental data we have obtained. In particular, it is necessary to investigate carefully the reasons why the survival at very low doses is so high. We do not know if this behaviour is simply due to the experimental uncertainty or due to other, unknown reasons.
Acknowledgment
We acknowledge the Hospital Universitario San Cecilio for permitting us to carry out the irradiation of the spheroids.
Footnotes
This work has been supported in part by the Junta de Andalucía (FQM0220).
References
- 1.Marples B, Collis SJ. Low-dose hyper-radiosensitivity: past, present, and future. Int J Radiat Oncol Biol Phys 2008;70:1310–8 [DOI] [PubMed] [Google Scholar]
- 2.Marples B, Joiner MC. The response of Chinese hamster V79 cells to low radiation doses: evidence of enhanced sensitivity of the whole cell population. Radiat Res 1993;133:41–51 [PubMed] [Google Scholar]
- 3.Joiner MC, Johns H. Renal damage in the mouse: the response to very small doses per fraction. Radiat Res 1988;114:385–98 [PubMed] [Google Scholar]
- 4.Joiner MC, Marples B, Lambin P, Short SC, Turesson I. Low-dose hypersensitivity: current status and possible mechanisms. Int J Radiat Oncol Biol Phys 2001;49:379–89 [DOI] [PubMed] [Google Scholar]
- 5.Harney J, Short S, Shah N, Joiner MC, Saunders MI. Low dose hyperradiosensitivity in metastatic tumors. Int J Radiat Oncol Biol Phys 2004;59:1190–5 [DOI] [PubMed] [Google Scholar]
- 6.Smith LG, Miller RC, Richards M, Brenner DJ, Hall EJ. Investigation of hypersensitivity to fractionated low-dose radiation exposure. Int J Radiat Oncol Biol Phys 1999;45:187–91 [DOI] [PubMed] [Google Scholar]
- 7.Short SC, Kelly J, Mayes CR, Woodcock M, Joiner MC. Low-dose hypersensitivity after fractionated low-dose irradiation in vitro. Int J Radiat Biol 2001;77:655–64 [DOI] [PubMed] [Google Scholar]
- 8.Honoré HB, Bentzen SM. A modelling study of the potential influence of low dose hypersensitivity on radiation treatment planning. Radiother Oncol 2006;79:115–21 [DOI] [PubMed] [Google Scholar]
- 9.Valentini V, Massaccesi M, Balducci M, Mantini G, Miccich F, Mattiucci GC, et al. Low-dose hyperradiosensitivity: is there a place for further investigation in clinical setting? Int J Radiat Oncol Biol Phys 2010;76:535–9 [DOI] [PubMed] [Google Scholar]
- 10.Hamilton CS, Denham JW, O'Brien M, Ostwald P, Kron T, Wrigh S, et al. Underprediction of human skin erythema at low doses per fraction by the linear quadratic model. Radiother Oncol 1996;40:23–30 [DOI] [PubMed] [Google Scholar]
- 11.Dubben HH, Röper B, Brackrock S. Is there sufficient evidence of hypersensitivity to low doses in radiotherapy? Radiother Oncol 1997;43:324–5 [DOI] [PubMed] [Google Scholar]
- 12.Harney J, Shah N, Short S, Daley F, Groom N, Wilson GD, et al. The evaluation of low dose hyperradiosensitivity in normal human skin. Radiother Oncol 2004;70:319–29 [DOI] [PubMed] [Google Scholar]
- 13.Wouters BG, Sy AM, Skarsgard LD. Low-dose hypersensitivity and increase radioresistance in a panel of human tumor cell lines with different radiosensitivity. Radial Res 1996;146:399–413 [PubMed] [Google Scholar]
- 14.Skarsgard LD, Skwarchuk MW, Wouters BG, Durand RE. Substructure in the radiation survival response at low dose in cells of human tumor cell lines. Radiat Res 1996;146:388–98 [PubMed] [Google Scholar]
- 15.Chandna S, Dwarakanath BS, Khaitan D, Mathew TL, Jain V. Low-dose radiation hypersensitivity in human tumor cell lines: effects of cell-cell contact and nutritional deprivation. Radiat Res 2002;157:516–25 [DOI] [PubMed] [Google Scholar]
- 16.Lambin P, Marples B, Fertil B, Malaise EP, Joiner MC. Hypersensitivity of a human tumour cell line to very low radiation doses. Int J Radiat Biol 1993;63:639–50 [DOI] [PubMed] [Google Scholar]
- 17.Martin L, Marples B, Coffey M, Lawler M, Hollywood D, Marignol L. Recognition of O6MeG lesions by MGMT and mismatch repair proficiency may be a prerequisite for low-dose radiation hypersensitivity. Radiat Res 2009;172:405–13 [DOI] [PubMed] [Google Scholar]
- 18.Marples B, Wouters BG, Collis SJ, Chalmers AJ, Joiner MC. Low-dose hyper-radiosensitivity: a consequence of ineffective cell cycle arrest of radiation damage G2-phase cells. Radiat Res 2004;161:247–55 [DOI] [PubMed] [Google Scholar]
- 19.Krueger SA, Collis SJ, Joiner MC, Wilson GD, Marples B. Transition in survival from low-dose hyper-radiosensitivity to increased radioresistance is independent of activation of ATM Ser1981 activity. Int J Radiat Oncol Biol Phys 2007;69:1262–71 [DOI] [PMC free article] [PubMed] [Google Scholar]
- 20.Krueger SA, Wilson GD, Piasentin E, Joiner MC, Marples B. The effects of G2-phase enrichment and checkpoint abrogation on low-dose hyperradiosensitivity. Int J Radiat Oncol Biol Phys 2010;77:1509–17 [DOI] [PMC free article] [PubMed] [Google Scholar]
- 21.Bedford JS, Mitchell JB. Dose-rate effects in synchronous mammalian cells in culture. Radiat Res 1973;54:316–27 [PubMed] [Google Scholar]
- 22.Steel GG. The dose rate effect: brachytherapy and targeted radiotherapy. In: Steel GG, ed. Basic clinical radiobiology. 3rd edn. London, UK: Arnold; 2002. pp. 197–204 [Google Scholar]
- 23.Leonard BE. Thresholds and transitions for activation of cellular radioprotective mechanisms-correlations between HRS/IRR and the inverse dose-rate effect. Int J Radiat Biol 2007;83:479–89 [DOI] [PubMed] [Google Scholar]
- 24.Mitchell CR, Folkard M, Joiner MC. Effects of exposure to low-dose-rate 60Co gamma rays on human tumor cells in vitro. Radiat Res 2002;158:311–18 [DOI] [PubMed] [Google Scholar]
- 25.Mitchell CR, Joiner MC. Effect of subsequent acute-dose irradiation on cell survival in vitro following low dose-rate exposures. Int J Radiat Biol 2002;78:981–90 [DOI] [PubMed] [Google Scholar]
- 26.Sutherland RM. Cell and environment interactions in tumor microregions: the multicell spheroid model. Science 1988;240:177–84 [DOI] [PubMed] [Google Scholar]
- 27.Durand R, Olive PL. Resistance of tumour cells to chemo and radiotherapy modulated by the three-dimensional architecture of solid tumours and spheroids. Method Cell Biol 2001;64:211–29 [DOI] [PubMed] [Google Scholar]
- 28.Guirado D, Aranda M, Vilches M, Villalobos M, Lallena AM. Dose dependence of the growth rate of multicellular tumour spheroids after irradiation. Br J Radiol 2003;76:109–16 [DOI] [PubMed] [Google Scholar]
- 29.Villalobos M, Olea N, Brotons JA, Olea-Serrano MF, Ruiz deAlmodóvar JM, Pedraza V. The E-screen assay: a comparison of different MCF7 cell stocks. Environ Health Perspect 1995;103:844–50 [DOI] [PMC free article] [PubMed] [Google Scholar]
- 30.Olea N, Villalobos M, Ruiz deAlmodóvar JM, Pedraza V. MCF-7 breast cancer cells grown as multicellular spheroids in vitro: effect of 17β estradiol. Int J Cancer 1992;50:112–17 [DOI] [PubMed] [Google Scholar]
- 31.Singh B, Arrand JE, Joiner MC. Hypersensitive response of normal human lung epithelial cells at low radiation doses. Int J Radial Biol 1994;65:457–64 [DOI] [PubMed] [Google Scholar]
- 32.Koch AL. The logarithm in biology 1. Mechanisms generating the lognormal distribution exactly. J Theoret Biol 1966;12:276–90 [DOI] [PubMed] [Google Scholar]
- 33.Guirado D, Ruiz deAlmodóvar JM. Prediction of normal tissue response and individualization of doses in radiotherapy. Phys Med Biol 2003;48:3213–23 [DOI] [PubMed] [Google Scholar]
- 34.Johnson NL, Kotz S, Balakrishnan N. Continuous univariate distributions, vol 1. 2nd edn. New York, NY: Wiley; 1994. p. 337 [Google Scholar]
- 35.Short S, Mayes C, Woodcock M, Johns H, Joiner MC. Low dose hypersensitivity in the T98G human glioblastoma cell line. Int J Radiat Biol 1999;75:847–55 [DOI] [PubMed] [Google Scholar]
- 36.Press WH, Teukolsky SA, Vetterling WT, Flannery BP. Numerical recipes in FORTRAN: The art of scientific computing. 2nd edn. New York, NY: Cambridge University Press; 1995 [Google Scholar]
- 37.Villalobos M, Aranda M, Núñez MI, Becerra D, Olea N, Ruiz deAlmodóvar M, et al. Interaction between ionizing radiation, estrogens and antiestrogens in the modification of tumor microenvironment in estrogen dependent multicellular spheroids. Acta Oncol 1995;34:413–17 [DOI] [PubMed] [Google Scholar]
- 38.Siles E, Villalobos M, Valenzuela MT, Núñez MI, Gordon A, McMillan TJ, et al. Relationship between p53 status and radiosensitivity in human tumour cell lines. Br J Cancer 1996;73:581–8 [DOI] [PMC free article] [PubMed] [Google Scholar]
- 39.Aguilar-Quesada R, Muñoz-Gámez JA, Martín-Oliva D, Peralta A, Valenzuela MT, Martínez-Romero R, et al. Interaction between ATM and PARP-1 in response to DNA damage and sensitization of ATM deficient cells through PARP inhibition. BMC Mol Biol 2007;8:29. [DOI] [PMC free article] [PubMed] [Google Scholar]