

Abstract
Objective
CT is considered the gold standard imaging modality for measurement of visceral adipose tissue area. However, as CT imaging exposes subjects to ionising radiation, a comparable imaging technique without this exposure is desirable, such as MRI. Therefore, we compared the agreement of measures of visceral adipose tissue and subcutaneous adipose tissue area from single-slice images obtained at the umbilicus using a 3 T MRI scanner with single-slice images obtained via CT scan.
Methods
64 images were obtained from 27 subjects who underwent MRI and CT scanning on the same day, after 10–12 hours of fasting. Visceral and subcutaneous adipose tissue depots were manually separated and quantified using a multimodality image-processing software program.
Results
We found good agreement between CT and MRI for the measurement of both visceral adipose tissue and subcutaneous adipose tissue. Bland–Altman difference analysis demonstrated a mean bias of −2.9% (as a portion of total abdominal area) for visceral adipose tissue and +0.4% for subcutaneous adipose tissue, as measured by MRI compared with CT.
Conclusion
MRI is a safe, accurate and precise imaging modality for measuring both visceral and subcutaneous adipose tissue, making it a favourable alternative to CT for quantification of these adipose depots.
The prevalence of overweight and obese individuals is growing globally, accompanied by deterioration in the health of affected patients [1]. An increasing number of investigations have focused on the quantification of visceral fat, with a mounting body of evidence suggesting a deleterious effect of increased visceral fat compared with subcutaneous or peripheral fat. Visceral adiposity has been linked to Type 2 diabetes, and cardiovascular disease risk factors such as insulin resistance and dyslipidaemia [2,3]. It has been suggested that direct exposure of hepatocytes to high concentrations of free fatty acids and/or other metabolites derived from visceral adipose tissue may account for the high frequency of metabolic complications associated with central obesity [4-6]. Measurement of visceral fat has even been suggested as a method of classifying obesity as morbid vs non-morbid, and some organisations have already delineated criteria dictating what is considered a significant quantity of visceral fat as measured by imaging studies [7]. While CT scanning has historically been used for this purpose because of its fast acquisition rate, which avoids potentially confounding effects of bowel movement on region of interest measures, it results in exposure to ionising radiation. MRI, on the other hand, does not involve radiation exposure and has advantages of allowing frequent imaging and use in at-risk populations such as pregnant females.
Previous studies have investigated the accuracy and reliability of MRI as a technique for measurement of visceral adipose tissue [4,8-17]. However, most studies have used 0.3–1.5 T MRI, and there is large variation in terms what the measured adipose tissue area/volume or calculated fat mass has been compared with. Some have made direct comparison with dissected cadaveric adipose tissue [8], while others have compared the utility of MRI to CT in both rats [17] and humans [9-12,14,16]. However, because of variation in scanning parameters in investigations comparing MRI to CT, such as the specific location of single-slice images, the use of multiple slices vs single slices for analysis and employing standard MR image acquisition vs water-suppressed T1 weighted images, there is not a consensus as to whether MRI is an appropriate alternative to CT for the purpose of measuring visceral adipose tissue area/volume. Thus, in this study we investigate the utility of MRI for this purpose, by comparing data obtained from a 3 T MRI scanner using an imaging protocol optimised to obtain images within a breath-hold, vs that obtained from a 16-slice CT scanner.
Methods and materials
Subjects
Images were obtained from 27 subjects enrolled in a longitudinal study of females with polycystic ovarian syndrome. The mean age of the subjects was 28 years (range 18–43 years) and the mean body mass index was 37.3 kg m−2 (range 24.0–49.6 kg m−2). This study was approved by the Oregon Health and Science University institutional review board and signed informed consent was obtained from all volunteers.
Participants were asked to fast for 10–12 h prior to each morning of imaging studies; CT and MRI were performed within the same morning unless scheduling conflicts made this unfeasible. A total of 64 pairs of images were analysed. Each volunteer underwent one to three CT/MRI paired studies; in those participants who underwent multiple visits, each CT/MRI scan pair was performed at separate time points, which were pre-determined by the structure of the longitudinal study. For subjects who exceeded the field of view (FOV) on one side, a hemiscan analysis was performed on the side with the complete image, and the measurements doubled. In the case of all subjects who exceeded the FOV, only the subcutaneous adipose tissue (SAT) lay outside the FOV; complete visceral adipose tissue (VAT) area was analysed and only the SAT was obtained by duplicating the complete half of the image.
CT
All CT images were obtained using a Philips Brilliance® 16P (Philips Healthcare, Best, Netherlands). We acquired a single 9-mm slice at the level of the umbilicus. The conditions were 120 kVp, 250 mAs, scan duration=750 ms, FOV=500×500. Identical radiation doses were used for all subjects as per standard protocol.
MRI
All MRI images were obtained at the Advanced Imaging Research Center at Oregon Health and Science University. MRI images were acquired using a Siemens MAGNETOM Tim Trio® (Siemens Medical Solutions, Malvern Pennsylvania and Erlangen, Germany) 3 T whole-body system. Subjects were positioned supine inside the bore of the magnet. We acquired 23 axial slices, 5 mm thick, with a 1-mm gap centred over the umbilicus during breath-hold using a Dixon technique. The imaging parameters were repetition time (TR)=193 ms; echo time (TE)=1.55 ms; flip angle=90°; FOV=385×440; matrix=179×256; scan duration=20 s. A single slice at the level on the umbilicus was used for analysis and calculation of the visceral fat and subcutaneous fat areas.
Image processing
Analyze v. 7.0 (AnalyzeDirect, Inc., Overland Park, KS), was used for processing, segmentation and measurement of compartments for both CT and MR images. A blinded analyst manually traced the abdominal wall muscle layer, thus delineating SAT from VAT. This program also allowed us to exclude intracolonic contents from the image, in order to prevent non-adipose tissue components from being counted as adipose tissue. Hounsfield unit cut-off values of −190 to −30 were assigned for adipose tissue in the CT images. Post-processing required approximately 20 min per image.
Statistical methods
Adipose tissue areas for each compartment were normalised to total measured abdominal area and expressed as percentage of total abdominal area. Linear correlations were calculated from linear regression analysis by least square fitting and reported as correlation coefficients. A p-value <0.05 was considered statistically significant. Mean differences between MRI and CT were determined by Bland–Altman [18], and the limits of agreement calculated using the mean and standard deviation (SD) of the differences between the two methods for the same adipose tissue compartment.
Results
Representative MR and CT images used for quantification of abdominal fat depots are shown in Figure 1. Comparison of MRI and CT data (Figure 2) showed strong correlation between the two imaging modalities for measurement of visceral adipose tissue (VAT; r=0.89, p<0.0001), subcutaneous adipose tissue (SAT; r=0.92, p<0.0001) and total abdominal adipose tissue (TAT; r=0.95, p<0.0001). The average difference between the two methods is also an estimate of agreement, and was found to be very small (Figure 3), with a difference of −2.9±1.9% for VAT (95% confidence interval −3.4% to 2.4%; limits of agreement −6.5% to 0.7%), 0.4±2.6% for SAT (95% confidence interval −0.2% to 1.1%; limits of agreement −4.6% to 5.5%) and −2.5±2.5% for TAT (95% confidence interval −3.1% to −1.8%; limits of agreement −7.4% to 2.5%). MRI yielded slightly lower measurements than CT for visceral adipose tissue, and thus slightly lower measurement of total adipose tissue. More than 92% of individual comparisons fell within the limits of agreement.
Figure 1.
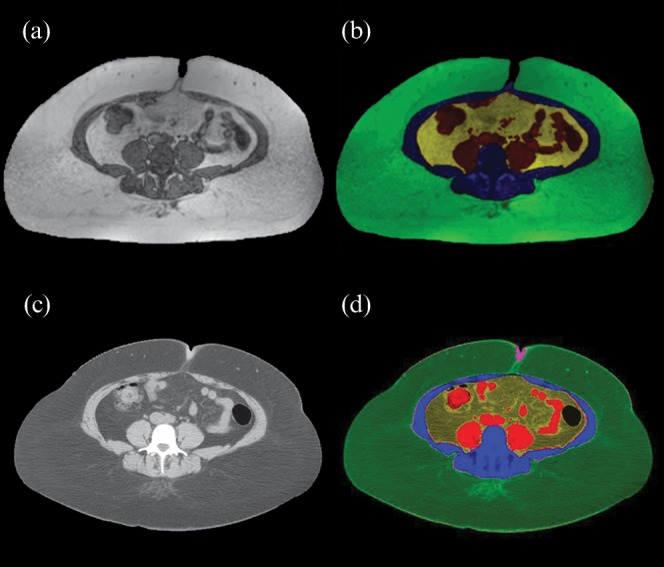
Representative (a, b) MR and (c, d) CT abdominal images used for quantification of abdominal fat depots. Colours for depots are: green, subcutaneous fat; yellow, visceral abdominal fat; black/red, intestine; blue, abdominal musculature and bone.
Figure 2.
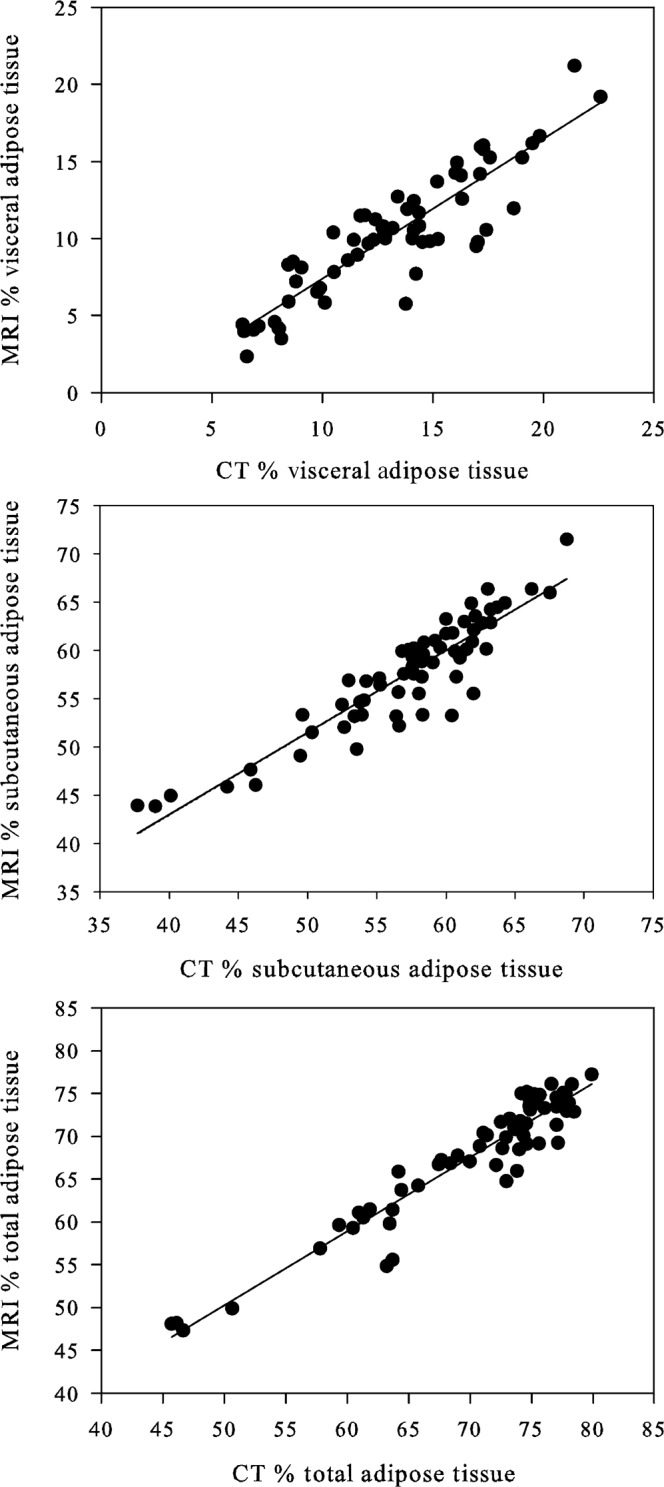
Adipose tissue areas obtained with MRI compared with those obtained with CT, expressed as percentage of total abdominal area for (a) visceral adipose tissue (y=0.9104x−1.7235; r=0.89, p<0.0001), (b) subcutaneous adipose tissue (y=0.8501x+9.0012; r=0.92, p<0.0001) and (c) total abdominal adipose tissue (y=0.8651x+7.0115; r=0.95, p<0.0001).
Figure 3.
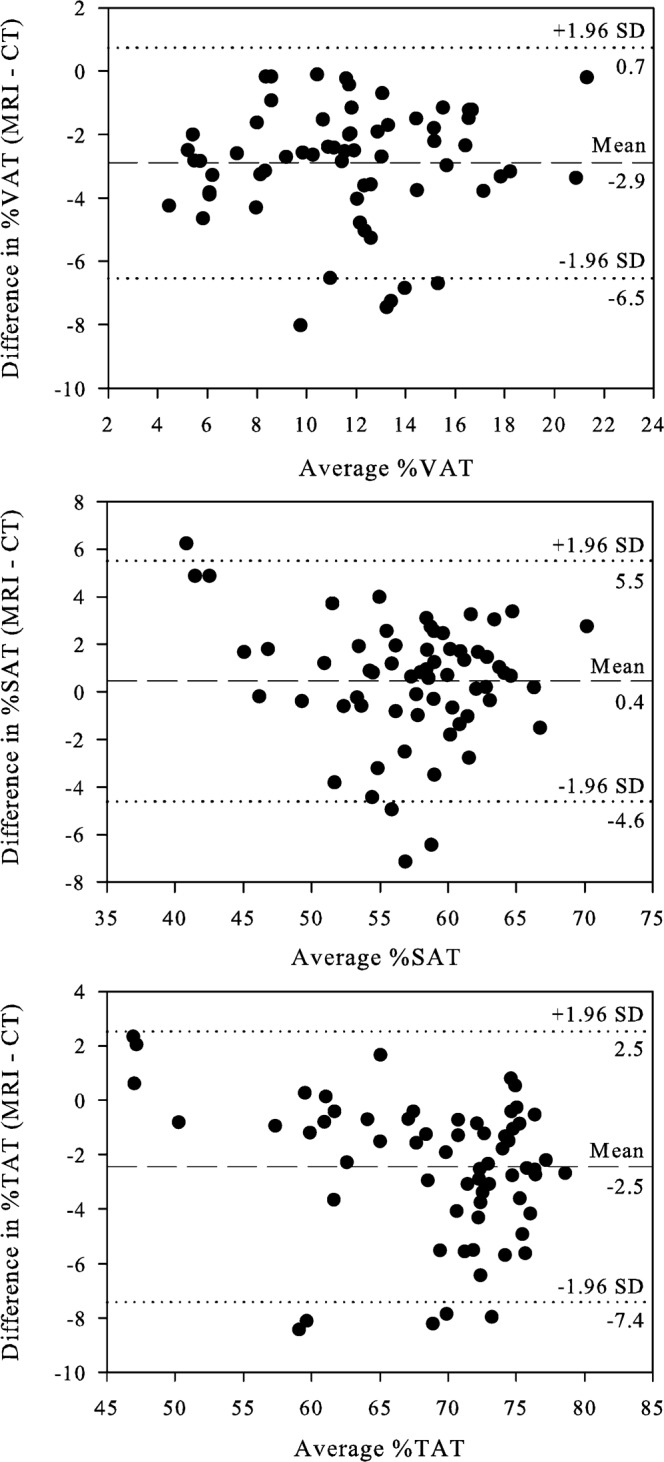
Bland–Altman plots: difference in MRI and CT measured adipose tissue at the level of the umbilicus for (a) visceral adipose tissue (VAT), (b) subcutaneous adipose tissue (SAT) and (c) total abdominal adipose tissue (TAT), expressed as percentage of total abdominal area. The outer dotted lines delineate the limits of agreement between the two methods.
Discussion
A number of previous studies have assessed the accuracy and reliability of low-field-strength MRI (0.3–1.5 T) to quantify visceral adipose tissue. Gomi et al [9] compared 0.3 T open MRI with single-slice CT to measure the ratio of visceral fat area to subcutaneous fat area at the level of the umbilicus in 11 healthy volunteers, and found no significant differences between CT and MRI measurements of VAT and SAT fat areas, as well as a positive correlation between MRI and CT for these measurements. Ross et al [17] found no significant differences in visceral adipose tissue volume per slice when comparing 1.5 T MRI and CT in rats, but did not report results in humans. Kullberg et al [10] found that despite slight underestimation of measurement of visceral adipose tissue by MRI compared with CT, overall correlations between CT, MRI and dual-energy X-ray absorptiometry were good for whole-body adipose tissue measurement. On the other hand, several studies have questioned the reliability of adipose tissue depot quantification by MRI vs CT. Tanaka et al [12] reported that measurements obtained using a 1.5 T magnet underestimated the area and volume of visceral adipose tissue measured by CT, though this was only on one subject. Seidell et al [11] found that while images obtained from 1.5 T MRI yielded comparable measurements of total, visceral and subcutaneous adipose tissue, making the ranking of individuals on the basis of fat areas similar by both MRI and CT, in this study the two imaging modalities yielded different absolute values of fat areas, particularly visceral fat, which MRI tended to underestimate with considerable variability between subjects. The investigators suggest that the underestimation of VAT by MRI in their study may be explained by the greater number of pixels in VAT than in SAT, which is affected by partial-volume effects (i.e. due to VAT bordering both muscle tissue and irregular intestinal tissue). This study, again, was limited by small sample size (only seven subjects).
Many imaging centres are now using more powerful magnets, such as 3 T, in both clinical practice and research settings. Moving from lower to higher field strength imaging, however, may actually degrade image quality because of inhomogeneity effects and susceptibility artefacts [19]. Also, while the reproducibility of measuring abdominal fat depots with a 3 T magnet was estimated by Li et al [15], who found an average coefficient of variation of the ratio of visceral to total adipose tissue of 5.2%, the study included only four healthy volunteers and did not compare MRI with CT scan results.
To address the limitations in the existing literature, we used 3.0 T MRI to measure visceral, subcutaneous and total adipose tissue areas, and compared the measurements with those obtained via CT. We found that visceral and subcutaneous fat measurements using the higher-strength magnet were highly comparable to CT, but did note a slight negative bias in percentage of VAT as measured by MRI. This may be due to partial-volume effects with MRI, particularly at the interfaces between fat and muscle or intestinal wall, as suggested by Seidell et al [11]. In addition, it has been suggested that intracolonic contents may be inappropriately measured and counted as fat [12,20]. Potretzke et al [20] used an imaging software program similar to that employed in this study, and reported the importance of utilising this tool to exclude the intracolonic contents, which erroneously get included when using simple Hounsfield unit cut-off values to threshold for adipose tissue in CT scans. These investigators found that without the “erase” function available with the imaging software program, CT images would lead to an overestimation of the visceral adipose tissue by an average of 19%. As we used this function in both our CT and MR images, this potential analysis error does not account for the slight underestimation of VAT by MRI. Nonetheless, the absolute difference in comparison with CT was very small and we conclude that measurements of visceral, subcutaneous and total abdominal fat areas using 3 T MRI are therefore accurate. In addition, Borkan et al [21] have shown that a single-slice technique through the umbilicus is highly comparable to volume measurements of abdominal adipose tissue. Therefore, the technique described here is easily translatable to what would be obtained upon measurement of volume, and it is advantageous, as it limits acquisition time.
There are several potential limitations to our study. First, we did not perform an analysis of the reproducibility for either the CT or MRI for measurements of visceral adipose tissue. Second, we used a set range of Hounsfield units to define adipose tissue in our CT images. Potretzke et al [20] suggested that it may be necessary to adjust ranges of HU for every individual, or use a semi-calibrated technique for identifying appropriate HU cut-offs. However, we sought to define a standardised image analysis protocol for a large number of scans involved in our studies, and individually thresholding the CT scan images would have been time-prohibitive for our technicians.
Conclusion
In summary, using an MRI acquisition protocol that markedly reduced the acquisition time for each image to allow image capture within a breath-hold, we found that MRI is a safe, accurate and precise imaging modality for measuring both visceral and subcutaneous adipose tissue. Compared with CT scanning, MRI is a favourable, non-radiation-exposing alternative for measuring abdominal fat content in clinical research.
Footnotes
This work was supported by NIH grants K23 RR021368 (BJK), R01 DK068146 (JQP), R03 DK61996 (JQP), ULI RR024140 [Oregon Clinical and Translational Research Institute (OCTRI)], and an OHSU General Clinical Research Center grant (M01 RR00334).
References
- 1.National Task Force on the Prevention and Treatment of Obesity Overweight, obesity, and health risk. Arch Intern Med 2000;160:898–904 [DOI] [PubMed] [Google Scholar]
- 2.Fujimoto WY, Bergstrom RW, Boyko EJ, Chen KW, Leonetti DL, Newell-Morris L, et al. Visceral adiposity and incident coronary heart disease in Japanese-American men. The 10-year follow-up results of the Seattle Japanese–American Community Diabetes Study. Diabetes Care 1999;22:1808–12 [DOI] [PubMed] [Google Scholar]
- 3.Carr DB, Utzschneider KM, Hull RL, Kodama K, Retzlaff BM, Brunzell JD, et al. Intra-abdominal fat is a major determinant of the National Cholesterol Education Program Adult Treatment Panel III criteria for the metabolic syndrome. Diabetes 2004;53:2087–94 [DOI] [PubMed] [Google Scholar]
- 4.Warren M, Schreiner PJ, Terry JG. The relation between visceral fat measurement and torso level–is one level better than another? The Atherosclerosis Risk in Communities Study, 1990–1992. Am J Epidemiol 2006;163:352–8 [DOI] [PubMed] [Google Scholar]
- 5.Eckel RH, Grundy SM, Zimmet PZ. The metabolic syndrome. Lancet 2005;365:1415–28 [DOI] [PubMed] [Google Scholar]
- 6.Pischon T, Boeing H, Hoffmann K, Bergmann M, Schulze MB, Overvad K, et al. General and abdominal adiposity and risk of death in Europe. N Engl J Med 2008;359:2105–20 [DOI] [PubMed] [Google Scholar]
- 7.Examination Committee of Criteria for “Obesity Disease” in Japan, Japan Society for the Study of Obesity New criteria for “obesity disease” in Japan. Circ J 2002;66:987–92 [DOI] [PubMed] [Google Scholar]
- 8.Abate N, Burns D, Peshock RM, Garg A, Grundy SM. Estimation of adipose tissue mass by magnetic resonance imaging: validation against dissection in human cadavers. J Lipid Res 1994;35:1490–6 [PubMed] [Google Scholar]
- 9.Gomi T, Kawawa Y, Nagamoto M, Terada H, Kohda E. Measurement of visceral fat/subcutaneous fat ratio by 0.3 Tesla MRI. Radiat Med 2005;23:584–7 [PubMed] [Google Scholar]
- 10.Kullberg J, Brandberg J, Angelhed JE, Frimmel H, Bergelin E, Strid L, et al. Whole-body adipose tissue analysis: comparison of MRI, CT and dual energy X-ray absorptiometry. Br J Radiol 2009;82:123–30 [DOI] [PubMed] [Google Scholar]
- 11.Seidell JC, Bakker CJ, van derKooy K. Imaging techniques for measuring adipose-tissue distribution—a comparison between computed tomography and 1.5-T magnetic resonance. Am J Clin Nutr 1990;51:953–7 [DOI] [PubMed] [Google Scholar]
- 12.Tanaka S, Yoshiyama M, Imanishi Y, Nakahira K, Hanaki T, Naito Y, et al. MR measurement of visceral fat: assessment of metabolic syndrome. Magn Reson Med Sci 2006;5:207–10 [DOI] [PubMed] [Google Scholar]
- 13.Thomas EL, Bell JD. Influence of undersampling on magnetic resonance imaging measurements of intra-abdominal adipose tissue. Int J Obes Relat Metab Disord 2003;27:211–18 [DOI] [PubMed] [Google Scholar]
- 14.Ohsuzu F, Kosuda S, Takayama E, Yanagida S, Nomi M, Kasamatsu H, et al. Imaging techniques for measuring adipose-tissue distribution in the abdomen: a comparison between computed tomography and 1.5-tesla magnetic resonance spin-echo imaging. Radiat Med 1998;16:99–107 [PubMed] [Google Scholar]
- 15.Li X, Youngren JF, Hyun B, Sakkas GK, Mulligan K, Majumdar S, et al. Technical evaluation of in vivo abdominal fat and IMCL quantification using MRI and MRSI at 3 T. Magn Reson Imaging 2008;26:188–97 [DOI] [PMC free article] [PubMed] [Google Scholar]
- 16.Yoon DY, Moon JH, Kim HK, Choi CS, Chang SK, Yun EJ, et al. Comparison of low-dose CT and MR for measurement of intra-abdominal adipose tissue: a phantom and human study. Acad Radiol 2008;15:62–70 [DOI] [PubMed] [Google Scholar]
- 17.Ross R, Leger L, Guardo R, De Guise J, Pike BG. Adipose tissue volume measured by magnetic resonance imaging and computerized tomography in rats. J Appl Physiol 1991;70:2164–72 [DOI] [PubMed] [Google Scholar]
- 18.Bland JM, Altman DG. Statistical methods for assessing agreement between two methods of clinical measurement. Lancet 1986;1:307–10 [PubMed] [Google Scholar]
- 19.Akisik FM, Sandrasegaran K, Aisen AM, Lin C, Lall C. Abdominal MR imaging at 3.0 T. Radiographics 2007;27:1433–44; discussion 62–4 [DOI] [PubMed] [Google Scholar]
- 20.Potretzke AM, Schmitz KH, Jensen MD. Preventing overestimation of pixels in computed tomography assessment of visceral fat. Obes Res 2004;12:1698–701 [DOI] [PubMed] [Google Scholar]
- 21.Borkan GA, Gerzof SG, Robbins AH, Hults DE, Silbert CK, Silbert JE. Assessment of abdominal fat content by computed tomography. Am J Clin Nutr 1982;36:172–7 [DOI] [PubMed] [Google Scholar]