

Abstract
Objective
Cardiac CT allows the detection and quantification of coronary artery calcification (CAC). Electron-beam CT (EBCT) has been widely replaced by high-end CT generations in the assessment of CAC. The aim of this study was to compare the CAC scores derived from an EBCT with those from a dual-source CT (DSCT).
Methods
We retrospectively selected 92 patients (61 males; mean age, 60.7±12 years) from our database, who underwent both EBCT and DSCT. CAC was assessed using the Agatston score by two independent readers (replicates: 1, 2; 3=mean of reading 1 and 2).
Results
EBCT scores were on average slightly higher than DSCT scores (281±569 vs 241±502; p<0.05). In regression analysis R2-values vary from 0.956 (1) to 0.966 (3). We calculated a correction factor as EBCT=(DSCT+1)1.026–1. When stratifying into CAC categories (0, 1–99, 100–399, 400–999 and ≥1000), 79 (86%) were correctly classified. From those with positive CAC scores, 7 out of 61 cases (11%, κ=0.81) were classified in different categories. Using the corrected DSCT CAC score, linear regression analysis for the comparison to the EBCT results were r=0.971 (p<0.001), with a mean difference of 6.4±147.8. Five subjects (5.4%) were still classified in different categories (κ=0.84).
Conclusion
CAC obtained from DSCT is highly correlated with the EBCT measures. Using the calculated correction factor, agreement only marginally improved the clinical interpretation of results. Overall, for clinical purposes, face value use of DSCT-derived values appears as useful as EBCT for CAC scoring.
Cardiac CT allows the detection and quantification of coronary artery calcification (CAC) and may thus add important in vivo information on the path from risk factor exposure to formation of clinical events [1-4]. Because of its advantages of being a fast technique with limited radiation exposure to the patients, various published clinical outcome data from CAC are based on electron-beam CT (EBCT), and therefore cut-points have been established for EBCT scans. However, since the appearance of newer generations of CT scanners such as dual-source CT (DSCT), scanners of this type are also widely used for CAC scoring as an alternative to EBCT. The spatial resolution of DSCT scanners is much higher, enabling the detection of smaller lesions, and DSCT is more applicable to other radiological procedures such as CT angiography [5]. CAC scoring is performed on these newer scanner generations using the Agatston score algorithm as the standard measure of CAC quantification. There is direct comparison of CAC scores between newer scanners and EBCT [6-9]. However, comparison between EBCT and DSCT is rare [10]. This is of interest for first-time CAC scoring in asymptomatic subjects, and especially for evaluation of disease progression in subjects with prior EBCT testing. Therefore, the aim of this study was to evaluate the diagnostic accuracy of DSCT in the detection of CAC scores to EBCT. In addition, we compared techniques with each other, verifying the ability of CAC score classification.
Methods and materials
Participants
Between September 2006 and February 2008 we selected participants from our database who had undergone DSCT coronary angiography for clinical evaluation of suspected coronary heart disease and who had recent EBCT scans for cardiovascular risk stratification. As part of the DSCT protocol, a prospectively gated non-contrast scan was performed. All patients were selected retrospectively. We did not collect any data prospectively. According to the clinical presentation, patients indicating a low pre-test likelihood of having a significant coronary artery stenosis were referred for coronary CT angiography instead of invasive coronary angiogram, just as those with a high pre-test likelihood of having significant coronary artery stenosis but refused to have an invasive coronary angiogram. The attending cardiologists made these decisions, and the authors of this manuscript were not involved in these procedures. All patients included had at least one of the American Heart Association risk factors, which included having a positive family history of heart disease, arterial hypertension, history of smoking, having diabetes mellitus or elevated lipid levels [11]. We excluded any patients with prior coronary artery stenting and coronary artery bypass grafting.
Study protocol
After a preview scan the studies started 1 cm below the carina and progressing caudally to include the proximal, mid- and distal coronary arteries in a single breath-hold. The EBCT study was performed on an Imatron C-150-XP CT scanner (General Electric, Imatron, San Francisco, CA), using a standard imaging protocol. Images were acquired during a single inspiratory breath-hold (120 kV, 630 mA) in a single-slice mode with a 100 ms scanning time. The images were prospectively gated at 80% of the R–R interval, with 3 mm contiguous section thickness. With DSCT, scanning was performed using a Siemens Somatom Definiton dual-source CT scanner (Siemens AG, Forchheim, Germany). Overall, the scanning protocol was similar to that for the EBCT scanner. A scan was obtained with 100–120 kV (adjusted to the patients habitus), 320 mA and 320 ms scanning time, using a medium-sharp convolution kernel (B35f). The images were prospectively gated at 80% of the R-R interval, with 1.5 mm contiguous section thickness.
Coronary artery calcium score quantification
Calcium scoring was quantitatively performed on a dedicated workstation (Aquarius 3D Workstation; TerraRecon, San Matteo, CA) using the Agatston method [12]. Calcification was defined as a structure with a density of greater than 130 HU that could be visualised at the location of the coronary arteries and at least four contiguous pixels in size. The lesion score was calculated by multiplying the lesion area by a density factor derived from the maximal HU within this area, as originally described by Agatston for EBCT scanning [12]. If the lesion attenuation was 130–199 HU, the area score was multiplied by one; if it was 200–299, it was multiplied by two; if it was 300–399, it was multiplied by three; and if it was >400, it was multiplied by four [7]. A total calcium score was determined by summing individual lesion scores from each of four anatomic sites (left main, left anterior descending, circumflex and right coronary arteries).
We stratified the collective into five groups on the basis of their CT Agatston score: group 1, no coronary calcification (Agatston score of zero); group 2, mild coronary calcification (Agatston score 1–99); group 3, moderate coronary calcification (Agatston score 100–399); group 4, severe coronary calcification (Agatston score 400–999); and group 5, extensive coronary calcification (Agatston score ≥1000) [13].
Data and statistical analysis
Quantitative data were expressed as mean±SD and categorical variables as frequencies or percentages. Owing to strongly skewed distribution of Agatston scores, method comparison analyses are performed after logarithmic transformation of the data. Data were analysed using the paired t-test for comparing continuous variables. For CAC values, a logarithmic transformation was applied to overcome the skewness of the distribution. Interobserver variability was assessed using the intraclass correlation coefficient after transformation. For assessment of agreement in risk categories, Cohen's κ was used. For each method, there were two readings of the Agatston score (Readers 1 and 2) by independent readers blinded to the clinical presentation of the patients. The mean of these two replicates constitutes the pooled data set, referred to as (3). A Bland–Altman plot (difference in log-transformed calcium scores between scanners vs mean of log-transformed calcium scores) was used to visually assess the degree of agreement between the calcium scores obtained from the two scanners [14]. We also performed an ordinary linear regression equation of log-transformed EBCT CAC scores vs log-transformed DSCT CAC scores. Further, Passing–Bablok regression (PBR) in data sets (1; 2; 3) was performed [15]. As a result, regression equations were of the form log(DSCT+1)=b×log(EBCT+1). A correction equation was assessed following retransformation and solving for EBCT: EBCT=(DSCT+1)(1/b)−1. All statistical analyses were performed using the SPSS Analysis software (v. 17.0.0; SPSS, Chicago, IL) and SAS software (v. 9.2; SAS Institute Inc., Cary, NC). A p-value <0.05 indicated statistical significance.
Results
Both EBCT and DSCT were performed in 61 males and 31 females with a mean age of 60.7±12 years. All patients underwent both EBCT and DSCT within 12.3±21.8 days of each other, with no significant clinical event in the interval (myocardial infarction, stroke or revascularisation).
Demographics of all patients included are given in Table 1. Heart rate was not significantly different for EBCT and DSCT (67.8±13.6 vs 67.2±12.3 beats per minute, p=0.14).
Table 1. Baseline characteristics of study population. Data presented as mean±standard deviation for continuous traits or n (percentage) for dichotomous traits.
| Characteristics | n=92 |
| Height (cm) | 172.8±9.1 |
| Weight (kg) | 80.3±16.3 |
| Body mass index (kg m–2) | 26.7±4.4 |
| Family history of coronary artery disease | 30 (32.6%) |
| Diabetes mellitus | 14 (15.2%) |
| Hypertension | 82 (89.1%) |
| Current tobacco use | 8 (8.7%) |
| Ex tobacco use | 26 (28.3%) |
| Hypercholesteraemia >200 mg dl−1 | 84 (91.3%) |
| Adipositas | 52 (56.5%) |
Calcium scores
A total of 25 (27%) of 92 patients (11 males) had no calcium on scans obtained with either of the two scanner types. There were 6 (6%) of 92 patients with coronary calcification either on EBCT or DSCT but not both. 4 (4%) of 92 patients had positive DSCT and negative EBCT. These patients had a mean score (SD) of 3.8±4.2 (range 1–11). 2 (2%) of 92 patients had positive EBCT (Agatston score of 1 and 2) and negative DSCT. The remaining 61 (66%) of 92 patients (45 males) had calcium on both scans. The EBCT-derived Agatston score ranged from 0 to 3176; the dual source CT score ranged from 0 to 2986. In 77% (n=47) of these patients the Agatston scores were higher in the EBCT than in the DSCT study. Overall, higher mean (SD) calcium scores were measured using EBCT (281±569) vs DSCT (241±502), the mean difference was calculated as 40.3±143.4 (p=0.008). After logarithmic transformation the interobserver variability (intraclass correlation coefficient, ICC) for assessment of calcium scores was very low for both imaging techniques (ICC=0.960, p<0.001 and ICC=0.933, p<0.001 for EBCT and DSCT, respectively).
When stratifying into CAC categories (0, 1–99, 100–399, 400–999 and ≥1000), 79 (86%) out of the total of 92 cases were classified into the same group using EBCT and DSCT (Table 2). From those with positive calcium score on both EBCT and DSCT, 7 (11%) out of 61 cases (κ=0.81) were classified in different categories by DSCT when compared with EBCT. Figure 1 depicts the calcium scores comparing EBCT and DSCT results with respect to CAC categories (0, −99, 100–399, 400–999 and ≥1000).
Table 2. Comparison of classification of subjects into coronary artery calcification (CAC) categories (CAC scores: no CAC, 0; mild, 1–99; moderate, 100–399; severe, 400–999; and extensive, ≥1000) using electron-beam CT (EBCT) and dual-source CT (DSCT) and the corrected DSCT.
| EBCT | DSCT |
Corrected DSCT |
||||||||
| No CAC | Mild | Moderate | Severe | Extensive | No CAC | Mild | Moderate | Severe | Extensive | |
| No CAC | 25 | 4 | 0 | 0 | 0 | 25 | 4 | 0 | 0 | 0 |
| Mild | 2 | 25 | 0 | 0 | 0 | 2 | 25 | 0 | 0 | 0 |
| Moderate | 0 | 4 | 14 | 0 | 0 | 0 | 3 | 14 | 1 | 0 |
| Severe | 0 | 0 | 2 | 8 | 0 | 0 | 0 | 1 | 9 | 0 |
| Extensive | 0 | 0 | 0 | 1 | 7 | 0 | 0 | 0 | 0 | 8 |
Figure 1.

Graphs comparing the coronary artery calcification using the Agatston scores of both electron-beam CT (EBCT) and dual-source CT (DSCT) with respect to mild (≥1–99), moderate (≥100–399), severe (≥400–999) and extensive (≥1000) coronary artery calcification (CAC) categories.
Method comparison electron-beam CT vs dual-source CT
Owing to strongly skewed distribution of Agatston scores, method comparison analyses were performed after logarithmic transformation of the data. The difference log(DSCT+1)–log(EBCT+1) was significantly negative by paired t-test for each replicate (1, 2), and for the mean of replicates (3): −0.141 (−0.259; −0.024; p=0.019), −0.129 (−0.237; −0.021; p=0.020) and −0.135 (−0.239; −0.030; p=0.012), respectively.
The Bland–Altman plot of the Agatston scores after logarithmic transformation is shown in Figure 2. The 95% limits of agreement are represented by the dashed lines. The graph indicates that paired values strongly agree, as evidenced by the small standard deviation (0.14±0.56), and that nearly all scores were in the range of the 95% limits of agreement (−0.97 to 1.25). A tendency towards larger variability with smaller Agatston score values is probably a consequence of image noise.
Figure 2.

Bland–Altman plot comparing mean values of electron-beam CT (EBCT) and dual-source CT (DSCT) scans with the difference between both scans. The 95% limits of agreement are represented by the dashed lines. The standard deviation (SD) is 0.14±0.56 (95% CI −0.97 to 1.25).
We additionally performed ordinary linear regression (OLR) of log(DSCT+1) on log(EBCT+1) for each reader and the pooled data (1, 2, 3). While the intercept was always compatible with zero, the slope was 0.938 (0.900; 0.979), 0.949 (0.910; 0.988) and 0.943 (0.906; 0.980) for 1, 2, and 3, respectively. R2-values vary from 0.956 (1) to 0.966 (3) (Pearson correlations are smaller than 0.99), such that conclusions from OLR should be verified by other regression techniques. Notably, when regressing log(EBCT+1) on log(DSCT+1), intercepts were again compatible with 0, but now the slopes were compatible with 1. This would support the assessment that EBCT and DSCT measurement cannot be distinguished in our data.
PBR, in contrast to OLR, yields the same conclusion independent of the order of the axes, and accounts for variability in both x and y direction. For each reader and the pooled data (1, 2, 3) the intercepts are compatible with zero, while the slopes are 0.975 (0.949; 0.998), 0.983 (0.955; 1.000) and 0.975 (0.951; 0.997) for 1, 2 and 3, respectively (Figure 3). The result for reader (2) with 95% confidence interval (CI) including (1) shows that a small perturbation of data in our sample leads to different conclusions about deviation from the identity line on the log-scale. Such a deviation, if any, is small. At clinically relevant cutpoints (EBCT=100 or 400), DSCT from this relation is 89 (80; 99) or 344 (298; 393), respectively, where the numbers in brackets account for the 95% CI of PBR slope.
Figure 3.
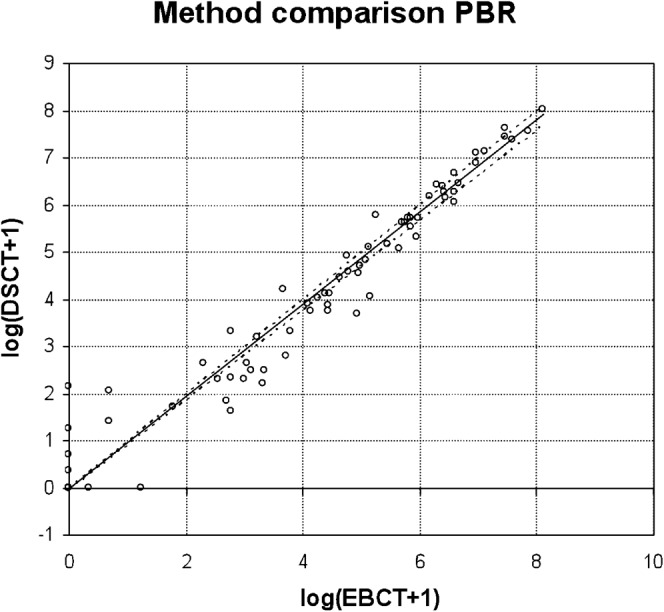
Passing–Bablok regression (PBR) for the mean of two replicates. Identity line and upper 95% confidence interval to the regression line coincide within the line width of the plot. EBCT, electron-beam CT; DSCT, dual-source CT.
Correction factor for dual-source CT
On the Agatston score scale, a correction factor from DSCT to EBCT based on the mean of replicates (3) from PBR would read: log(DSCT+1)=log(EBCT+1)×0.975: EBCT=(DSCT+1)1.026–1. Consecutively, we applied the correction factor to the DSCT scores. Using the corrected DSCT score, linear regression analysis for the comparison to the EBCT results were r=0.971 (p<0.001), with a mean difference of 6.4±147.8. From those with positive calcium score on both EBCT and DSCT, 5 subjects (5.4%) out of 61 cases (κ=0.84) were still classified in different categories (Table 2). One patient changed the category, but was still classified in the wrong category.
Discussion
Our study demonstrated a close relationship for CAC scores between the EBCT and the DSCT in a wide range of values. However, we found that DSCT yielded lower scores than EBCT. Therefore, we defined a correction factor, which improved the agreement in CAC scoring between both modalities. Given the close correlation of both modalities per se, application of the correction factor only marginally improved the clinical interpretation and categorisation of CAC scores in our selected patient population.
Multiple studies have demonstrated the prognostic implication of CAC scoring [16-21]. Most data have been acquired using EBCT, as the original technique for CAC scoring (and in particular normative values, age- and gender-stratified percentiles, and risk categories) have been established according to EBCT-derived CAC scores (0, 1–99, 100–399, 400–999 and >1000) [22]. However, EBCT is not clinical routine any longer and is largely being replaced by newer generations of CT scanners. Moreover, with increasing multidetector CT (MDCT) technology, more indications for cardiac CT imaging have occurred. Recently, many studies have been published comparing EBCT and MDCT for CAC score measurement [8,9,23-25]. They found EBCT and MDCT to be highly correlated (correlation coefficient between 0.95–0.99). However, newer scanner generations implicate a systematic difference in scoring due to differences in temporal and spatial resolution, image noise and lack of calibration [7,26], resulting in a variation from 17% to 32% in CAC scores compared with EBCT [8,9,23-25]. Our results also showed a high correlation of r=0.971 and a standard variation of 14% in CAC scores. These data are comparable with the data previously published, showing that DSCT seems not to convey a crucial improved correlation. However, to our knowledge this is the first study in a clinical scenario comparing EBCT and DSCT. We therefore were not able to consider any further aspects that might affect the comparability of EBCT and DSCT. The CAC scoring is known to be influenced by heart rate, slice thickness and the modality used. Therefore, DSCT is approximately 50% less susceptible to cardiac motion than MDCT, and DSCT might offer a better approximation of CAC on EBCT than MDCT [10].
Technical differences between electron-beam CT and dual-source CT
While temporal resolution has been a limitation of prior MDCT scanners, which led to a significantly higher rate of motion artefacts compared with EBCT, this shortcoming is reduced with DSCT and its temporal resolution of 83 ms [27]. This may reduce the need of beta-blocker administration prior to MDCT scans as a further chance of systematic error [28]. In our study, subjects were not routinely given beta-blockers, and therefore heart rates were not different in both scans. For that reason, our study is the first of its kind to assess comparison of spiral CT with EBCT without systematic bias by temporal resolution.
A further possible drawback of EBCT compared with DSCT might be a reduced spatial resolution. Among other issues, the reduced spatial resolution may cause a blooming effect of CAC that might lead to a significant overestimation of the area of CAC plaque. However, advances in CT technology with an improvement in spatial resolution may reduce the extent of overestimation. Hence, the further improved spatial resolution of clinical CT systems may overcome the current limitations of the older CT generations and may improve the accuracy of plaque detection, especially decreasing the number of false-positive assessments (increasing specificity) [29].
Additionally, CAC scoring might be influenced by slice thickness. Recently, Groen et al [10] found the best approximation of EBCT on CT is found for DSCT with a slice thickness of 0.6 mm. This difference in scoring might be because the detection efficiency of small lesions decreases with increasing slice thickness due to the partial volume effect. A second factor is the increasing noise levels for smaller slice thicknesses. Noise can be mistaken for a real lesion, increasing the CAC score. Increasing Agatston score with decreasing slice thickness has been reported previously [30,31]. In our study, a slice thickness of 3.0 mm was used for EBCT, compared with 1.5 mm sections with DSCT, demonstrating high correlation between EBCT and DSCT. However, when applying DSCT, especially when the progression of CAC is measured with prior EBCT testing, a reduced slice thickness should be used.
Remaining factors that may diminish comparison of measurements are differences in image noise and the lack of calibration [7,22]. The variability of both EBCT and DSCT has not been optimised yet, and there is still debate as to how to minimise this variance. Stanford et al [32] recently suggested the use of a 90 HU threshold rather than the traditional 130 HU threshold for DSCT, for having less image noise compared with EBCT. However, until now there has been no established threshold for CAC detection on DSCT scans. In our study, we used 130 HU for both EBCT and DSCT, and found close correlation throughout the risk categories. Even after application of the correction factor, which may reduce the systematic difference, classifications remained unchanged in most subjects. Thus, 130 HU may also be a practicable threshold in DSCT calcium scoring.
Furthermore, there is ongoing debate as to whether CAC quantification techniques other than the Agatston score (e.g. CAC volume or mass) should be used. [8,28] However, since percentiles in population and risk implications have been established using the Agatston score, we decided to use the Agatston score for our evaluation.
Clinical implications
CAC scoring is a predictor of cardiovascular events and may add incremental prognostic value to conventional cardiovascular risk factors [33,34]. The relative risk of coronary events increased with increasing CAC burden, and clinically useful thresholds (i.e. 0, 1–99, 100–399, 400–999 and >1000) have been introduced and have widely been used [5]. These thresholds have been defined using EBCT scanners, but with advances in technology, EBCT scanners have been replaced in most institutions. Therefore CAC scores are mostly assessed today using MDCT. Others have suggested that the thresholds derived from EBCT technology may not be readily transferred to newer CT scanners [9,23,24,26,32]. Our results show that systematic differences in CAC scores due to different scanner types cause only a few misclassifications of CAC-derived risk group categories, and adjustment according to the systematic bias did not lead to a significant improvement in risk group classification.
Limitations
The major limitation of this study is the relatively small number of patients and the retrospective study design. The study is performed in a select patient population and results may not generalise to other settings. Moreover, all subjects underwent CAC for evaluation of suspected coronary heart disease rather than pure risk assessment. However, this should not affect the comparative nature of our study. The EBCT data acquisition of this study was performed with a standard hospital protocol using a tube voltage of 120 kV, whereas DSCT scanning was performed with a tube voltage of 100 to 120 kV. Although higher energies tend to show less density, Nelson et al [35] reported small differences between EBCT and CT. Therefore we expect that the influence of the difference in tube voltage can be neglected.
The correlation equation was calculated to increase the comparability between the two modalities. The application of the correction equation should support the clinician in his decision-making. However, we do not consider the correlation equation to be universally applicable, but rather to be a helpful guide to the clinician. Application of the correction equation may still result in a misclassification of CAC score. Since the correction equation was derived within this data set, its performance should be verified on an independent data set before it is considered for use in practice.
Additionally, the results obtained in this study from a special population cannot reliably be applied to the general population. Lastly, as this was a retrospective review, additional assessment of interscan reproducibility for either DSCT or EBCT could not be performed. However, a prospective evaluation of both interscan and intermodality variability would have led to an additional radiation exposure, especially when taking into account the fact that interscan variability has been addressed in prior studies [36].
Conclusions
Calcium scores obtained from DSCT are highly correlated with the EBCT measures. However, DSCT yields slightly lower scores compared with EBCT. Applying our correction factor improved the agreement in CAC scoring between both modalities. However, given the close correlation of both modalities per se, application of the correction factor only marginally improved the clinical interpretation of our results. Overall, DSCT appears to be comparable with EBCT for coronary calcification screening, but measurement imprecision should be accounted for when rating EBCT- or DSCT-based Agatston scores.
References
- 1.Möhlenkamp S, Lehmann N, Schmermund A, Pump H, Moebus S, Baumgart D, et al. Prognostic value of extensive coronary calcium quantities in symptomatic males—a 5-year follow-up study. Eur Heart J 2003;24:845–54 [DOI] [PubMed] [Google Scholar]
- 2.Schmermund A, Möhlenkamp S, Erbel R. Coronary artery calcium and its relationship to coronary artery disease. Cardiol Clin 2003;21:521–34 [DOI] [PubMed] [Google Scholar]
- 3.Sechtem U. Electron beam computed tomography: on its way into mainstream cardiology? Eur Heart J 2000;21:87–91 [DOI] [PubMed] [Google Scholar]
- 4.Wexler L, Brundage B, Crouse J, Detrano R, Fuster V, Maddahi J, et al. Coronary artery calcification: pathophysiology, epidemiology, imaging methods, and clinical implications. A statement for health professionals from the American Heart Association. Circulation 1996;94:1175–92 [DOI] [PubMed] [Google Scholar]
- 5.Oudkerk M, Stillman AE, Halliburton SS, Kalender WA, Möhlenkamp S, McCollough CH, et al. Coronary artery calcium screening: current status and recommendations from the European Society of Cardiac Radiology and North American Society for Cardiovascular Imaging. Eur Radiol 2008;18:2785–807 [DOI] [PubMed] [Google Scholar]
- 6.Becker CR, Knez A, Jakobs TF, Aydemir S, Becker A, Schoepf UJ, et al. Detection and quantification of coronary artery calcification with electron-beam and conventional CT. Eur Radiol 1999;9:620–4 [DOI] [PubMed] [Google Scholar]
- 7.Becker CR, Jakobs TF, Aydemir S, Becker A, Knez A, Schoepf UJ, et al. Helical and single-slice conventional CT versus electron beam CT for the quantification of coronary artery calcification. AJR Am J Roentgenol 2000;174:543–47 [DOI] [PubMed] [Google Scholar]
- 8.Becker CR, Kleffel T, Crispin A, Knez A, Young J, Schoepf UJ, et al. Coronary artery calcium measurement: agreement of multirow detector and electron beam CT. AJR Am J Roentgenol 2001;176:1295–8 [DOI] [PubMed] [Google Scholar]
- 9.Knez A, Becker C, Becker A, Leber A, White C, Reiser M, et al. Determination of coronary calcium with multi-slice spiral computed tomography: a comparative study with electron-beam CT. Int J Cardiovasc Imaging 2002;18:295–303 [DOI] [PubMed] [Google Scholar]
- 10.Groen JM, Greuter MJ, Vliegenthart R, Suess C, Schmidt B, Zijlstra F, et al. Calcium scoring using 64-slice MDCT, dual source CT and EBT: a comparative phantom study. Int J Cardiovasc Imaging 2008;24:547–56 [DOI] [PMC free article] [PubMed] [Google Scholar]
- 11.Pearson TA, Blair SN, Daniels SR, Eckel RH, Fair JM, Fortmann SP, et al. AHA guidelines for primary prevention of cardiovascular disease and stroke: 2002 update: consensus panel guide to comprehensive risk reduction for adult patients without coronary or other atherosclerotic vascular diseases. American Heart Association Science Advisory and Coordinating Committee. Circulation 2002;106:388–91 [DOI] [PubMed] [Google Scholar]
- 12.Agatston AS, Janowitz WR, Hildner FJ, Zusmer NR, Viamonte MJ, Detrano R. Quantification of coronary artery calcium using ultrafast computed tomography. J Am Coll Cardiol 1990;15:827–32 [DOI] [PubMed] [Google Scholar]
- 13.Budoff MJ, Achenbach S, Blumenthal RS, Carr JJ, Goldin JG, Greenland P, et al. Assessment of coronary artery disease by cardiac computed tomography: a scientific statement from the American Heart Association Committee on Cardiovascular Imaging and Intervention, Council on Cardiovascular Radiology and Intervention, and Committee on Cardiac Imaging, Council on Clinical Cardiology. Circulation 2006;114:1761–91 [DOI] [PubMed] [Google Scholar]
- 14.Bland JM, Altman DG. Statistical methods for assessing agreement between two methods of clinical measurement. Lancet 1986;1:307–10 [PubMed] [Google Scholar]
- 15.Passing H, Bablok W. A new biometrical procedure for testing the equality of measurements from two different analytical methods. Application of linear regression procedures for method comparison studies in clinical chemistry, Part I. J Clin Chem Clin Biochem 1983;21:709–20 [DOI] [PubMed] [Google Scholar]
- 16.Broderick LS, Shemesh J, Wilensky RL, Eckert GJ, Zhou X, Torres WE, et al. Measurement of coronary artery calcium with dual-slice helical CT compared with coronary angiography: evaluation of CT scoring methods, interobserver variations, and reproducibility. AJR Am J Roentgenol 1996;167:439–44 [DOI] [PubMed] [Google Scholar]
- 17.Flohr TG, Ohnesorge BM. Imaging of the heart with computed tomography. Basic Res Cardiol 2008;103:161–73 [DOI] [PubMed] [Google Scholar]
- 18.Kennedy J, Shavelle R, Wang S, Budoff M, Detrano RC. Coronary calcium and standard risk factors in symptomatic patients referred for coronary angiography. Am Heart J 1998;135:696–702 [DOI] [PubMed] [Google Scholar]
- 19.Möhlenkamp S, Moebus S, Schmermund A, Lehmann N, Hoffmann B, Neumann T, et al. Assessment of the natural history of coronary artery calcification and identification of its determinants. Rationale of the 2nd part of the Heinz Nixdorf Recall Study. [In German.] Herz 2007;32:108–20 [DOI] [PubMed] [Google Scholar]
- 20.Schlosser T, Mohrs OK, Magedanz A, Nowak B, Voigtlander T, Barkhausen J, et al. Noninvasive coronary angiography using 64-detector-row computed tomography in patients with a low to moderate pretest probability of significant coronary artery disease. Acta Radiol 2007;48:300–7 [DOI] [PubMed] [Google Scholar]
- 21.Shemesh J, Apter S, Rozenman J, Lusky A, Rath S, Itzchak Y, et al. Calcification of coronary arteries: detection and quantification with double-helix CT. Radiology 1995;197:779–83 [DOI] [PubMed] [Google Scholar]
- 22.Erbel R, Möhlenkamp S, Kerkhoff G, Budde T, Schmermund A. Non-invasive screening for coronary artery disease: calcium scoring. Heart 2007;93:1620–9 [DOI] [PMC free article] [PubMed] [Google Scholar]
- 23.Carr JJ, Crouse JR, 3rd, Goff DC, Jr, D'Agostino RB, Jr, Peterson NP, Burke GL. Evaluation of subsecond gated helical CT for quantification of coronary artery calcium and comparison with electron beam CT. AJR Am J Roentgenol 2000;174:915–21 [DOI] [PubMed] [Google Scholar]
- 24.Daniell AL, Wong ND, Friedman JD, Ben-Yosef N, Miranda-Peats R, Hayes SW, et al. Concordance of coronary artery calcium estimates between MDCT and electron beam tomography. AJR Am J Roentgenol 2005;185:1542–5 [DOI] [PubMed] [Google Scholar]
- 25.Horiguchi J, Yamamoto H, Akiyama Y, Marukawa K, Hirai N, Ito K. Coronary artery calcium scoring using 16-MDCT and a retrospective ECG-gating reconstruction algorithm. AJR Am J Roentgenol 2004;183:103–8 [DOI] [PubMed] [Google Scholar]
- 26.Budoff MJ, Mao S, Zalace CP, Bakhsheshi H, Oudiz RJ. Comparison of spiral and electron beam tomography in the evaluation of coronary calcification in asymptomatic persons. Int J Cardiol 2001;77:181–8 [DOI] [PubMed] [Google Scholar]
- 27.Mao SS, Pal RS, McKay CR, Gao YG, Gopal A, Ahmadi N, et al. Comparison of coronary artery calcium scores between electron beam computed tomography and 64-multidetector computed tomographic scanner. J Comput Assist Tomogr 2009;33:175–8 [DOI] [PubMed] [Google Scholar]
- 28.Achenbach S, Ropers U, Kuettner A, Anders K, Pflederer T, Komatsu S, et al. Randomized comparison of 64-slice single- and dual-source computed tomography coronary angiography for the detection of coronary artery disease. JACC Cardiovasc Imaging 2008;1:177–86 [DOI] [PubMed] [Google Scholar]
- 29.Sarwar A, Rieber J, Mooyaart EA, Seneviratne SK, Houser SL, Bamberg F, et al. Calcified plaque: measurement of area at thin-section flat-panel CT and 64-section multidetector CT and comparison with histopathologic findings. Radiology 2008;249:301–6 [DOI] [PubMed] [Google Scholar]
- 30.Muhlenbruch G, Thomas C, Wildberger JE, Koos R, Das M, Hohl C, et al. Effect of varying slice thickness on coronary calcium scoring with multislice computed tomography in vitro and in vivo. Invest Radiol 2005;40:695–9 [DOI] [PubMed] [Google Scholar]
- 31.Ulzheimer S, Kalender WA. Assessment of calcium scoring performance in cardiac computed tomography. Eur Radiol 2003;13:484–97 [DOI] [PubMed] [Google Scholar]
- 32.Stanford W, Thompson BH, Burns TL, Heery SD, Burr MC. Coronary artery calcium quantification at multi-detector row helical CT versus electron-beam CT. Radiology 2004;230:397–402 [DOI] [PubMed] [Google Scholar]
- 33.Detrano R, Guerci AD, Carr JJ, Bild DE, Burke G, Folsom AR, et al. Coronary calcium as a predictor of coronary events in four racial or ethnic groups. N Engl J Med 2008;358:1336–45 [DOI] [PubMed] [Google Scholar]
- 34.Erbel R, Möhlenkamp S, Moebus S, Schmermund A, Lehmann N, Stang A, et al. Coronary risk stratification, discrimination, and reclassification improvement based on quantification of subclinical coronary atherosclerosis: the Heinz Nixdorf Recall study. J Am Coll Cardiol 2010;56:1397–1406 [DOI] [PubMed] [Google Scholar]
- 35.Nelson JC, Kronmal RA, Carr JJ, McNitt-Gray MF, Wong ND, Loria CM, et al. Measuring coronary calcium on CT images adjusted for attenuation differences. Radiology 2005;235:403–14 [DOI] [PubMed] [Google Scholar]
- 36.Detrano RC, Anderson M, Nelson J, Wong ND, Carr JJ, McNitt-Gray M, et al. Coronary calcium measurements: effect of CT scanner type and calcium measure on rescan reproducibility—MESA study. Radiology 2005;236:477–84 [DOI] [PubMed] [Google Scholar]