

Abstract
Objectives
This study reports quantitative comparisons of signal-to-noise ratio (SNR) at 1.5 and 3 T from images of carotid atheroma obtained using a multicontrast, cardiac-gated, blood-suppressed fast spin echo protocol.
Methods
18 subjects, with carotid atherosclerosis (>30% stenosis) confirmed on ultrasound, were imaged on both 1.5 and 3 T systems using phased-array coils with matched hardware specifications. T1 weighted (T1W), T2 weighted (T2W) and proton density-weighted (PDW) images were acquired with identical scan times. Multiple slices were prescribed to encompass both the carotid bifurcation and the plaque. Image quality was quantified using the SNR and contrast-to-noise ratio (CNR). A phantom experiment was also performed to validate the SNR method and confirm the size of the improvement in SNR. Comparisons of the SNR values from the vessel wall with muscle and plaque/lumen CNR measurements were performed at a patient level. To account for the multiple comparisons a Bonferroni correction was applied.
Results
One subject was excluded from the protocol owing to image quality and protocol failure. The mean improvement in SNR in plaque was 1.9, 2.1 and 2.1 in T1W, T2W and PDW images, respectively. All plaque SNR improvements were statistically significant at the p<0.05 level. The phantom experiment reported an improvement in SNR of 2.4 for PDW images.
Conclusions
Significant gains in SNR can be obtained for carotid atheroma imaging at 3 T compared with 1.5 T. There was also a trend towards increased CNR. However, this was not significant after the application of the Bonferroni correction.
Carotid MRI has been in use since the mid-1990s for detecting atherosclerosis [1], with advances being driven by a greater understanding of the pathophysiology of plaque development and progression [2]. This has in turn led to a desire to be able to distinguish characteristics of carotid atheroma (such as a large lipid-rich necrotic core or a thin fibrous cap) that put an individual at a significantly greater risk of a future stroke [3]. MRI has been repeatedly validated against the gold standard of histology for the characterisation of carotid atheroma and measurement of plaque components [1,2,4,5]. The capacity for MRI to demonstrate plaque characteristics has been applied to assess the long-term pathogenesis of atherosclerosis and to monitor the effects of therapeutic interventions [6-9].
The current limiting factors for multicontrast MRI in atheroma are image resolution and scan time, but the advent of higher field strengths has provided the opportunity to advance the quality of carotid imaging. The requirement for high-resolution imaging at small fields of view places high demands on the hardware being used, and current protocols typically use signal averaging to improve signal-to-noise ratio (SNR). In theory, SNR should increase linearly with field strength; thus, a 1.5 vs 3 T comparison experiment should produce an approximate doubling of the SNR [10]. This expected increase in SNR could be used either to improve spatial resolution or to reduce the number of averages, and hence reduce the scan time in future protocols.
Initial studies have indicated the benefit of 3 T MRI of the carotid artery wall. One of the early studies, in 2005, used a double inversion recovery (DIR) prepared turbo spin echo (TSE) sequence to image a phantom and healthy volunteers [11]. The phantom experiments demonstrated an SNR increase of a factor of 2.5 for 3 T over 1.5 T, compared with 2.1 in vivo. A separate image with a larger field of view (FOV; 24×12 cm as opposed to 12×12 cm) but the same bandwidth/pixel size was used to define the background regions of interest (ROI) for the SNR calculation. The superlinear increase in the phantom was ascribed to the differential noise contribution of the small coil elements at the different field strengths. In addition to this, the lower SNR gain in vivo was attributed to the differences in T1 and T2 at the higher field strength, as well as the need to use a lower refocusing flip angle at 3 T (160°) in two of the subjects owing to specific absorption rate (SAR) limitations.
A study published in 2006 performed multicontrast fast spin echo (FSE) imaging with DIR preparation and fat suppression without cardiac gating [12]. A cohort of five healthy volunteers and two atheroma-affected subjects were imaged at both field strengths, and SNR and contrast-to-noise ratio (CNR) values increased by 1.5–1.8 times at 3 T. Noise levels were determined from four ROIs drawn in an artefact-free background area in a rectangular FOV (16×12 cm), and the wall/luminal signal intensities were corrected for the mean noise contribution.
A 2007 study using a small cohort (five healthy volunteers, five with atherosclerosis) produced comparable results [13], albeit with different coils (eight-element at 3 T and four-element at 1.5 T) and slightly different pixel sizes used at the two field strengths. A two-fold increase in SNR for the vessel wall (in sections unaffected by plaque) was reported after adjustment for the larger voxel size used at 1.5 T. However, differences in SNR enhancement between the different contrast weightings were not described.
A single case report considering multicontrast imaging in a patient with moderate carotid stenosis using 1.5 and 3 T systems from different manufacturers found a significant improvement in SNR across T1 weighted (T1W), T2 weighted (T2W) and proton density weighted (PDW) images at 3 T, varying from a 64% to 83% increase [14].
While the majority of these studies confirm the expected increase in SNR with field strength, they are based upon small sample sizes (mainly normal volunteers) and varying numbers of sequences, and they utilise a range of SNR measurement methodologies, as well as differences in coil design/manufacture and MRI system manufacturers at the two field strengths.
In comparison with the previous studies, the current work provides a substantially more detailed and standardised comparative analysis of SNR at 1.5 and 3.0 T for the widely used multicontrast imaging using, as far as possible, identical pulse sequences, coil designs and MRI systems. Unlike the previous studies, rather than using normal volunteers, a larger cohort of patients with confirmed carotid atheroma of varying degrees of severity was used, as would be seen in clinical practice.
Methods and materials
MRI was performed using whole-body MR systems from the same manufacturer at 1.5 and 3 T (Signa HDx; GE Healthcare, Waukesha, WI). A commercially available bilateral four-element phased-array carotid coil was used at 1.5 T (Machnet BV, Eelde, the Netherlands), and a coil of identical design was constructed for 3 T (Flick Engineering Solutions, Winterswijk, the Netherlands). The SNR in vivo was determined using a National Electrical Manufacturers' Association (NEMA)-recommended method [15], which involved the acquisition of a separate “noise-only image”, acquired using a gradient echo sequence with the excitation pulse disabled, and the subject in situ. This method was validated in a phantom with respect to a gold-standard multiple image acquisition method [16].
Phantom study
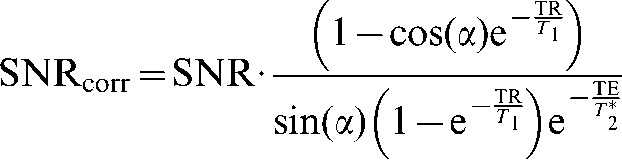
SNR measurements were carried out using a manufacturer-provided cylindrical phantom containing dimethyl silicone fluid and gadolinium at both 1.5 T (T1/T2/T2* = 116/43/38 ms) and 3 T (T1/T2/T2* = 238/32/25 ms). The multiple-image measurement method [16] involved the acquisition of a series of 32 fast spoiled gradient-echo images at the two field strengths (echo time [echo time (TE)/repetition time (TR)/flip = 6 ms/14 ms/20°; bandwidth = ±31.25 kHz; FOV = 250×250 mm; slice thickness = 3 mm; matrix = 512×512]. These were used to calculate a pixel-wise SNR map, correcting for T1 and T2*, using the following equation:
 |
(1) |
The mean values within a given region of interest were used as the gold-standard measure of SNR.
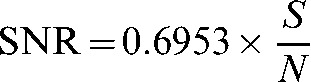
This was then compared with the noise-only method, in which the mean pixel value in an ROI on the first image in the multiple-image acquisition defined the signal, S, and the standard deviation of the pixels in the same ROI on the noise-only image defined the noise, N. Again, data were corrected for T1 and T2* using Equation (1). SNR was calculated according to:
 |
(2) |
where the numerical factor corrects for the χ-distribution of the magnitude-reconstructed noise for a four-channel array [17,18]. Circular ROIs with a diameter 20% of the diameter of the phantom were located as shown in Figure 1.
Figure 1.
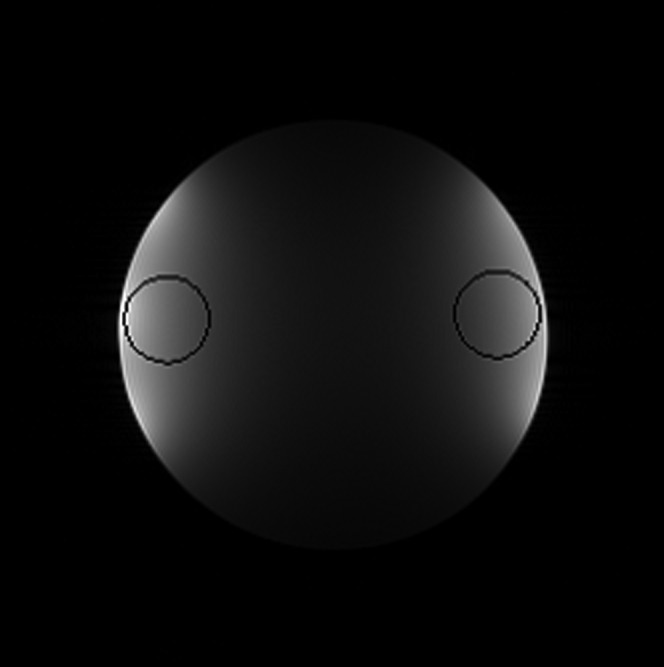
Illustrating the circular regions of interest (ROIs) used for signal-to-noise ratio calculations on a representative proton density weighted image of the cylindrical phantom. These were automatically located on the radial line between the centre of the phantom and the centre of mass of the signal on that side (shown by the two lines and stars), with the outer edge of the ROI 2% from the average edge of the phantom.
SNR measurements were obtained using the systems' body coils, and the carotid arrays, to investigate the effect of the array element size.
Patient study
18 patients (mean age 68 years, range 54–79 years) with carotid stenosis greater than 30% on Doppler ultrasound were recruited prospectively. This comprised 14 males (78%) and 4 females. There was a range of degree of carotid stenosis from 30–49% (47%), approximately 50% (18%), 50–69% (23%) and 70–99% (12%). The majority of patients were symptomatic within the last 6 months (77%) and had at least one cardiovascular risk factor: ex-smoker (59%) or hypertension (53%). The study was approved by the local regional ethics committee. Informed consent was obtained from all subjects before imaging.
MRI
The subjects were positioned in each system with the carotid coils placed superficially to cover the carotid artery bilaterally. The centres of the coils were marked with oil capsules and matched to the location of the carotid pulse (identified by manual palpation of the neck) in order to ensure that the central coil position was the same in both MRI systems. A vacuum pillow system (Vac Lok Cushion; Oncology Systems Ltd, Shrewsbury, UK) was placed around the head and neck to minimise movement. Imaging was performed sequentially on the two systems on the same day for all subjects, with the interval between the two imaging sessions not exceeding 1 h. The sequential order of imaging on each system was randomised.
A two-dimensional time-of-flight sequence was performed to identify the position of the bifurcation and the plaque location. High-resolution axial images were obtained through the disease-affected section of artery. FSE sequences, using blood suppression, were acquired on both systems using as similar protocols as possible to produce T1W, T2W and PDW images. Fat suppression and cardiac gating were used for all sequences. The following imaging parameters were used for the FSE sequences: FOV 10×10 cm; matrix 256×256; number of excitations, 2; slice thickness 3 mm; TR 1 R-R (T1W) 2R-R (T2/PDW); TE 7.7 ms (T1/PDW) 99.7 (T2W); ETL 12 (T1W) 16 (T2/PDW).
The appropriate inversion time for optimal blood suppression following double inversion preparation depends on the T1 of blood; accepted values from literature are 1200 ms at 1.5 T and 1550 ms at 3 T [19,20]. The product pulse sequences at both field strengths used a value of 1200 ms; the value in the 3 T sequence was changed to 1550 ms to improve blood suppression. The refocusing flip angle at 3 T was also adjusted from the manufacturer default of 107° to 155°, to match the 1.5 T sequence. This did not exceed the SAR limits for gated imaging at 3 T.
The chosen slice locations were prescribed to incorporate the plaque location and the carotid bifurcation, and were matched between the imaging sessions. Initial experiments demonstrated that the standard method used to measure noise of using a background ROI positioned outside of the tissue cannot be applied when a small (10×10 cm) FOV is used as the entire image is occupied by tissue. Other groups have addressed this problem by using larger FOVs, which enable a ROI to be drawn in an artefact-free part of the background image. However, this larger FOV is not used in our current imaging protocol and would lead to a change in SNR due to the change in voxel size. Furthermore, we have previously observed that the gradient non-linearity correction used in the manufacturer's standard reconstruction leads to a spatially dependent increase in the background noise in the image periphery. Thus, to make it a representative comparison, a 10×10 cm FOV was used and a matched noise-only image was acquired, following one of the methodologies recommended by NEMA [15]. The noise image was a gradient echo sequence acquired with the following parameters: FOV 10×10 cm; matrix 256×256; number of excitations, 2; slice thickness 3 mm; TR 17 ms; TE 5.7 ms. The total average imaging time was approximately 45 min per system, depending on the number of slice locations acquired and the patient's heart rate.
Image analysis
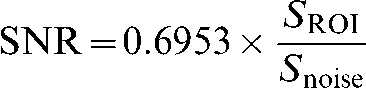
ROIs were manually drawn by a physician and reviewed by a second observer (each with 3 years′ experience) to define the lumen, vessel wall and the sternocleidomastoid muscle (Figure 2); the ROIs were defined bilaterally. Summary statistics of the ROI data were extracted using CMRTools2007 v. 84.79.07 (Cardiovascular Imaging Solutions Ltd, London, UK). The mean signal intensity was recorded for each ROI in muscle (SSCM), carotid plaque (Splaque) and lumen (Slumen). These measurements were obtained from all three sequences (T1W, T2W and PDW) and on all the matching slices containing atheroma. ROIs were placed on the noise image at the same spatial locations as for the plaque, lumen and sternocleidomastoid muscle demarcations. The standard deviation of the signal intensity distribution within the noise ROI was defined as Snoise. SNR was calculated using the following equation, where SROI is either SSCM, Splaque or Slumen:
Figure 2.

Example of demarcation of regions of interest on images. 1.5 T T1 weighted images (a) without and (b) with regions of interest drawn for lumen, outer vessel wall and within the sternocleidomastoid muscle. 3 T T1 weighted images (c) without and (d) with the same regions of interest drawn.
 |
(3) |
To take into account any potential asymmetry in the coils, the right and left muscle/plaque SNR values for the coils were calculated independently. CNR was calculated from SNR measurements of the plaque and the vessel lumen, defined as
| (4) |
Statistical analysis
Statistical analysis was performed using the statistical programming language R v. 2.5.1 (R Foundation for Statistical Computing, Vienna, Austria). The data were averaged down to one measurement for each SNR/CNR calculation per patient per side. The data failed the normality and equivalent variances assumptions, and hence a non-parametric paired Wilcoxon test was used to determine statistical inferences. A Bonferroni correction was applied to account for the multiple comparison issue. The p-values are quoted post Bonferroni correction (p = poriginal×18). Statistical significance was defined as p<0.05.
Results
Phantom study
The SNR improvement factor for relaxation time-corrected images acquired on the body coil was 1.99 using the multiple-image method and 1.96 using the noise-only image method, as would be expected in the high-field SNR limit [10]. The improvement factor was somewhat higher for the four-channel carotid array, at 2.47 for the multiple-image method and 2.39 for the noise-only method. This has been seen by other groups [11] and is related to the small coil area, which leads to a higher proportion of the noise arising from the coil element itself, rather than from the imaging volume. It is higher than seen in vivo in part because of the correction for the relaxation time of the phantom, which was not applied in vivo, but also because of the lower conductivity of the phantom as compared with tissue.
The maximum difference in the measured SNRs between the multiple-image method and noise image method for the four-channel array coils was only 10%. This difference may be attributed to small amounts of coupling between the coil elements. This indicates that the lack of spatial information in the noise image does not lead to inaccuracies in determining the SNR, as would be expected given that these images were not acquired using parallel imaging techniques.
Patient study
Images from 17 of the 18 patients recruited were used for the analysis (1 was rejected because of poor image quality due to gross patient motion).
From these 17 patients, 67 matching slice locations per contrast weighting sequences (T1W, T2W and PDW) were analysed. A median of 4 (range 2–8) matched slice locations per subject were included in the analysis. Of the 17 patients, 41% were imaged first on the 1.5 T system. For all 17 patients, on all images, bilateral muscle SNR measurements were analysed. Of the 17 patients, 7 had plaque affecting the right carotid artery, 3 had plaque in the left carotid artery and the remaining 7 had bilateral disease. Both the bilateral and unilateral disease was used for SNR measurements. There was a significant improvement (p<0.05) in SNR for 3 T compared with 1.5 T for the images produced in all three sequences both for muscle and for plaque measurements (Figure 3). However, the difference between CNR at 1.5 and 3 T was not consistently significant for any of the three sequences after applying the Bonferroni correction. The median/interquartile range of SNR measurements for each of the ROIs used is given in Table 1. Figure 4 provides an example of the images acquired at both field strengths.
Figure 3.
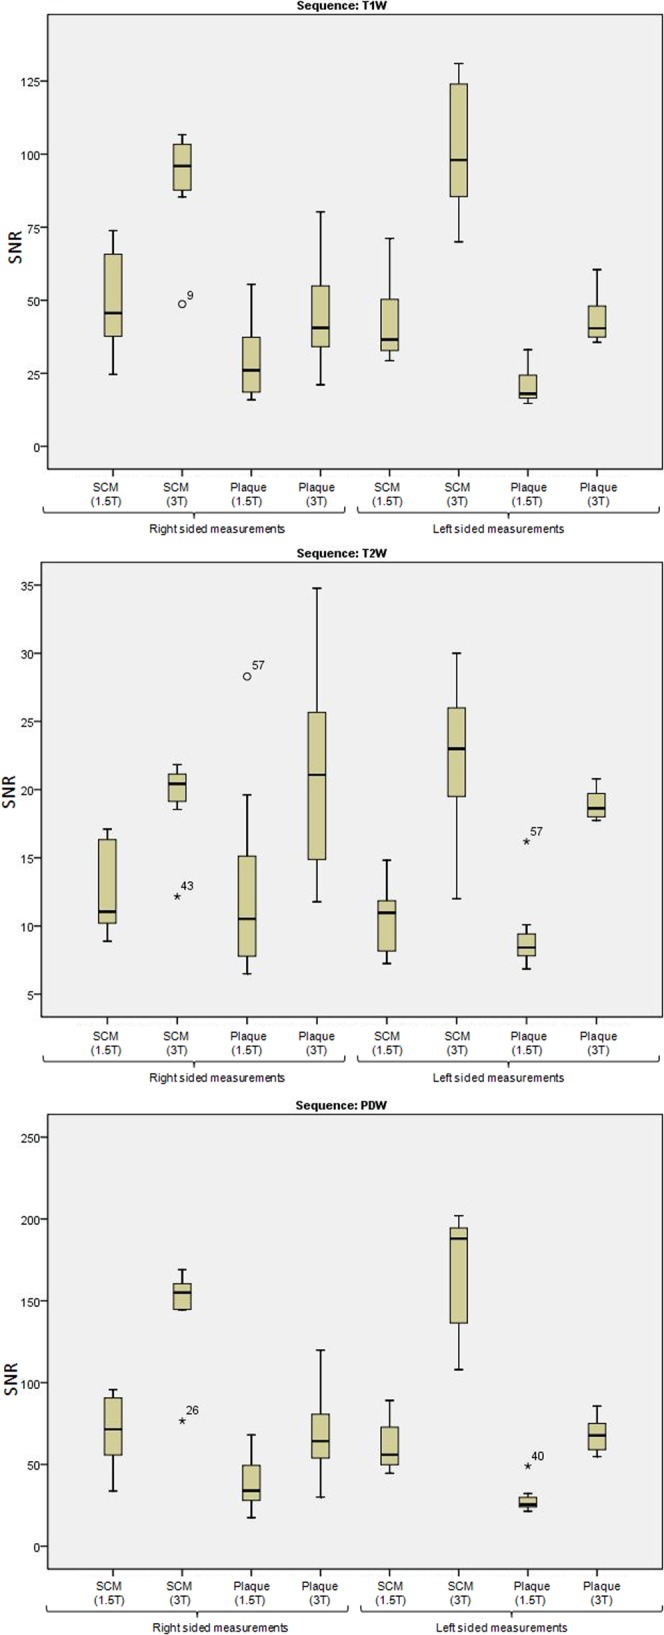
Box plot illustrating the signal-to-noise ratio (SNR) difference between 1.5 and 3 T for the three image types (T1 weighted, T2 weighted and proton density weighted). Plots show the median and interquartile range as well as the range for each parameter. SNR measurements for plaque and sternocleidomastoid muscle are given (right- and left-sided measurements illustrated separately).
Table 1. Signal-to-noise ratio (SNR) measurements.
|
T1 weighted |
T2 weighted |
Proton density weighted |
||||||||
| 1.5 T | 3 T | p-value | 1.5 T | 3 T | p-value | 1.5 T | 3 T | p-value | ||
| SNR SCM | Right | 54.1 (35.2–66.5) | 89.9 (66.0–102.9) | <0.001 | 12.7 (10.6–17.1) | 18.6 (16.1–20.7) | 0.004 | 71.5 (52.4–94.5) | 141.7 (93.6–157.3) | 0.001 |
| Left | 45.5 (36.5–52.3) | 97.8 (84.4–118.9) | <0.001 | 11.1 (8.7–12.3) | 20.9 (18.7–25.7) | <0.001 | 61.9 (51.7–79.9) | 139.2 (133.4–189.0) | <0.001 | |
| SNR plaque | Right | 24.5 (17.8–30.1) | 39.6 (33.8–48.5) | 0.002 | 10.6 (7.8–13.2) | 18.4 (15.2–24.6) | 0.011 | 34.3 (25.1–42.1) | 62.5 (53.4–80.3) | 0.002 |
| Left | 17.9 (15.5–25.9) | 39.2 (35.9–43.3) | 0.035 | 8.1 (7.8–9.8) | 18.4 (17.8–19.9) | 0.035 | 24.8 (23.5–31.1) | 65.1 (56.4–71.3) | 0.035 | |
| CNR | Right | 11.7 (8.7–21.9) | 24.6 (16.6–28.9) | 0.044 | 3.9 (1.3–6.3) | 7.9 (5.0–11.1) | 0.026 | 18.0 (14.0–27.7) | 28.8 (13.5–36.9) | 0.61 |
| Left | 7.0 (5.8–13.7) | 20.1 (18.4–24.1) | 0.087 | 1.6 (1.1–3.4) | 5.2 (4.5–8.0) | 0.967 | 11.8 (7.4–12.8) | 29.5 (20.6–33.3) | 1.00 | |
CNR, contrast-to-noise ratio; SCM, sternocleidomastoid.
All the distributions are described using the median, first and third interquartile values. Statistical inferences are determined using the non-parametric Wilcoxon paired test. All p-values are quoted post Bonferroni correction.
Figure 4.

Example of 1.5 and 3 T black-blood carotid images of both carotid arteries for T1 weighted, T2 weighted and proton density-weighted images. There is bilateral atheromatous plaque present, which is demonstrated on the multicontrast 1.5 T images; however, this is more clearly seen at 3 T, and the plaque morphology is easier to distinguish.
The median improvement factor of SNR at 3 T compared with 1.5 T for muscle measurements ranged from 1.3 to 1.9 across the different sequences, and ranged from 2.0 to 2.3 for plaque. CNR improvement showed a much broader range, from 1.7 to 2.8 times better at 3 T. A comparison of the SNR differences between the right and left side of the images at both 1.5 and 3 T was performed to identify any asymmetry between the right and left coil elements, at either field strength. The mean ratio for muscle SNR at 1.5 T between the right and left side was 1.2 (range 0.5–2.2). The mean ratio at 3 T was 0.9 (range 0.4–1.5). It was noted that there was a slight bias to the SNR being better on the right-sided coil at 1.5 T, whereas at 3 T there was a slight bias to improved SNR on the left-sided coil.
Discussion
This study has focused on assessing the direct SNR improvement from matched imaging, demonstrating that a significant increase in the SNR across black-blood sequences for carotid imaging can be obtained by imaging at 3 T instead of 1.5 T. Coils of identical design were used to assess 18 patients with known carotid atheroma on the same model of scanner at the 2 field strengths. This is in contrast to previous studies, which have either had mismatched hardware [13] or few patients in the comparison [11,12,14].
All other imaging parameters in this study were also matched across the two machines to ensure the validity of the comparison. To achieve this, the refocusing flip angle on the 3 T machine was increased from its default value to match the flip angle prescribed in the 1.5 T protocol. One previous study had to reduce the flip angle at 3 T relative to 1.5 T to reduce the SAR, but these angles were larger than those used in the present work, at 160° and 180°, respectively [11]. The only imaging parameter that was changed between the 1.5 T and 3 T machines was the blood T1 value. Literature-based values were used at each field strength [19,20].
An unavoidable difference between the 1.5 and 3 T images was the coil. While the two phased arrays were of identical design, subtle differences in construction and tuning may have affected the results. In order to investigate this, bilateral muscle ROIs and, where relevant, bilateral plaque ROIs were drawn and the two sides calculated independently. It was noted that there was a slight asymmetry with the coils at both field strengths: at 1.5 T the right coil gave superior SNR measurements whereas at 3 T the left coil gave better SNR measurements. This helps to explain the difference that was consistently seen between the right- and left-sided measurements for all parameters across all the sequences, with the left side giving a bigger increase in SNR at 3 T compared with 1.5 T (Table 1). However, the overall improvement in SNR is large and statistically significant bilaterally in both muscle and arterial plaque, showing that the increases are not simply due to differences in coil construction. This is underlined by relaxation time-corrected SNR measurements using a phantom, which showed the SNR increasing by a factor of 2.4 at the greater field strength, with similar left–right asymmetries as seen in vivo. In general, relaxation times at higher field strength will tend to lead to smaller increases in SNR. This is illustrated here by the fact that the PDW (and, to an extent, T2W) SNR improvement factor is higher than for T1W, a finding that matches previous studies [12,14].
A wide range of luminal SNR values were obtained. These were generally lower (i.e. better flow suppression) at 3 T, but there was a wide spread of values representing variability in the effectiveness of blood suppression, and this in turn reflected the calculated CNR values. There is more likely to be flow artefact in areas of the bifurcation and stenosis, the areas of particular interest in this study, which will have reduced the effectiveness of the flow suppression in some cases. This wide range of luminal SNR values is reflected in the resulting plaque/lumen CNR values, which lessened the power of this study to detect improvements in CNR. However, the overall improvements in SNR, and of plaque in particular, indicate a significant benefit of imaging atheroma at 3 T. The greater than two-fold increase in SNR is likely to be related to the geometry of carotid coils, which at low field strength are partially loaded and thus SNR increases superlinearly from 1.5 to 3 T [12].
Conclusion
This study has demonstrated that imaging at 3 T confers a statistically significant SNR advantage compared with imaging at 1.5 T for high-resolution carotid MRI. In particular, we have shown that plaque SNR more than doubles at the higher field strength, demonstrating that increasing from 1.5 to 3 T is especially beneficial for image quality in carotid atheroma studies. This will aid delineation of vessel wall and plaque components, particularly by automated systems. However, study durations can be long when imaging using multiple sequences and slice locations, so in some instances it may prove useful to exploit this large improvement in SNR to reduce the imaging time, which will increase tolerance of MRI of carotid atheroma clinically.
Acknowledgments
We would like to thank Dr Owen Thomas, Miss Ilse Joubert and Mr Tim Baynes for their assistance in this study.
Footnotes
This study was supported by a National Institute of Health Research Biomedical Research Centre grant.
References
- 1.Toussaint JF, LaMuraglia GM, Southern JF, Fuster V, Kantor HL. Magnetic resonance images lipid, fibrous, calcified, hemorrhagic, and thrombotic components of human atherosclerosis in vivo. Circulation 1996;94:932–8 [DOI] [PubMed] [Google Scholar]
- 2.Cai JM, Hatsukami TS, Ferguson MS, Small R, Polissar NL, Yuan C. Classification of human carotid atherosclerotic lesions with in vivo multicontrast magnetic resonance imaging. Circulation 2002;106:1368–73 [DOI] [PubMed] [Google Scholar]
- 3.Gao T, Zhang Z, Yu W, Wang Y. Atherosclerotic carotid vulnerable plaque and subsequent stroke: a high-resolution MRI study. Cerebrovasc Dis 2009;27:345–52 [DOI] [PMC free article] [PubMed] [Google Scholar]
- 4.Hatsukami TS, Ross R, Polissar NL, Yuan C. Visualization of fibrous cap thickness and rupture in human atherosclerotic carotid plaque in vivo with high-resolution magnetic resonance imaging. Circulation 2000;102:959–64 [DOI] [PubMed] [Google Scholar]
- 5.Mitsumori LM, Hatsukami TS, Ferguson MS, Kerwin WS, Cai J, Yuan C. In vivo accuracy of multisequence MR imaging for identifying unstable fibrous caps in advanced human carotid plaques. J Magn Reson Imaging 2003;17:410–20 [DOI] [PubMed] [Google Scholar]
- 6.Adams GJ, Greene J, Vick GW, 3rd, Harrist R, Kimball KT, Karmonik C, et al. Tracking regression and progression of atherosclerosis in human carotid arteries using high-resolution magnetic resonance imaging. Magn Reson Imaging 2004;22:1249–58 [DOI] [PubMed] [Google Scholar]
- 7.Takaya N, Yuan C, Chu B, Saam T, Polissar NL, Jarvik GP, et al. Presence of intraplaque hemorrhage stimulates progression of carotid atherosclerotic plaques: a high-resolution magnetic resonance imaging study. Circulation 2005;111:2768–75 [DOI] [PubMed] [Google Scholar]
- 8.Saam T, Yuan C, Chu B, Takaya N, Underhill H, Cai J, et al. Predictors of carotid atherosclerotic plaque progression as measured by noninvasive magnetic resonance imaging. Atherosclerosis 2007;194:e34–42 [DOI] [PMC free article] [PubMed] [Google Scholar]
- 9.Tang TY, Howarth SP, Miller SR, Graves MJ, Patterson AJ, U-King-Im JM, et al. The ATHEROMA (atorvastatin therapy: effects on reduction of macrophage activity) study: evaluation using ultrasmall superparamagnetic iron oxide-enhanced magnetic resonance imaging in carotid disease. J Am Coll Cardiol 2009;53:2039–50 [DOI] [PubMed] [Google Scholar]
- 10.Hoult DI, Lauterbur PC. Sensitivity of zeugmatographic experiment involving human samples. J Magn Reson Imaging 1979;34:425–33 [Google Scholar]
- 11.Anumula S, Song HK, Wright AC, Wehrli FW. High-resolution black-blood MRI of the carotid vessel wall using phased-array coils at 1.5 and 3 tesla. Acad Radiol 2005;12:1521–6 [DOI] [PMC free article] [PubMed] [Google Scholar]
- 12.Yarnykh VL, Terashima M, Hayes CE, Shimakawa A, Takaya N, Nguyen PK, et al. Multicontrast black-blood MRI of carotid arteries: comparison between 1.5 and 3 tesla magnetic field strengths. J Magn Reson Imaging 2006;23:691–8 [DOI] [PubMed] [Google Scholar]
- 13.Hinton-Yates DP, Cury RC, Wald LL, Wiggins GC, Keil B, Seethmaraju R, et al. 3.0 T plaque imaging. Top Magn Reson Imaging 2007;18:389–400 [DOI] [PubMed] [Google Scholar]
- 14.Cury RC, Houser SL, Furie KL, Stone JR, Ogilvy CS, Sherwood JB, et al. Vulnerable plaque detection by 3.0 tesla magnetic resonance imaging. Invest Radiol 2006;41:112–15 [DOI] [PubMed] [Google Scholar]
- 15.National Electrical Manufacturers' Association (NEMA) Determination of signal to noise ratio (SNR) indiagnostic magnetic resonance imaging. NEMA Standards Publication. Rosslyn, VA: NEMA; 2008 [Google Scholar]
- 16.Dietrich O, Raya JG, Reeder SB, Reiser MF, Schoenberg SO. Measurement of signal-to-noise ratios in MR images: influence of multichannel coils, parallel imaging, and reconstruction filters. J Magn Reson Imaging 2007;26:375–85 [DOI] [PubMed] [Google Scholar]
- 17.Gilbert G. Measurement of signal-to-noise ratios in sum-of-squares MR images. J Magn Reson Imaging 2007;26:1678 (author reply: 1679). [DOI] [PubMed] [Google Scholar]
- 18.Koay CG, Basser PJ. Analytically exact correction scheme for signal extraction from noisy magnitude MR signals. J Magn Reson 2006;179:317–22 [DOI] [PubMed] [Google Scholar]
- 19.Simonetti OP, Finn JP, White RD, Laub G, Henry DA. “Black blood” T2-weighted inversion-recovery MR imaging of the heart. Radiology 1996;199:49–57 [DOI] [PubMed] [Google Scholar]
- 20.Noeske R, Seifert F, Rhein KH, Rinneberg H. Human cardiac imaging at 3 T using phased array coils. Magn Reson Med 2000;44:978–82 [DOI] [PubMed] [Google Scholar]