Abstract
Objective
The purpose of this study was to prospectively investigate the correlation between CT angiographic clot load (CTACL) score, pulmonary perfusion defect (PPD) score and the global right ventricular function in the assessment of pulmonary embolism (PE) severity.
Methods
49 patients with acute PE, who underwent dual-source CT scan, were included in the study. CT angiography and perfusion imaging were performed. Data from electrocardiogram-gated coronary angiography scanning protocol were used for right ventricular function analysis. Two readers evaluated the CTACL and PPD scores using the Qanadli and Chae methods, respectively.
Results
The PPD score had a strong positive correlation with the CTACL score (r = 0.72, p<0.001) and both scores in turn had a strong positive correlation with the right ventricular/left ventricular (RV/LV) diameter ratio (r = 0.60, r = 0.62, p<0.001). However, the PPD score had a strong negative correlation with ejection fraction (EF) (r = −0.63, p<0.001) while the CTACL score had a low negative correlation with EF (r = −0.33, p = 0.02). Between the RV/LV<1 group (n = 35) and the RV/LV >1 group (n = 14), the PPD score, CTACL score, pulmonary artery trunk diameter, EF and reflux of inferior vena cava were significantly different, all with p<0.001. The end-systolic volume (p = 0.01) was significantly different but the end-diastolic volume (p = 0.11) and stroke volume (p = 0.08) showed no statistically significant difference between the two groups.
Conclusion
Therefore, considering PPD scores, CTACL scores and cardiovascular manifestations together may be helpful in the evaluation of PE severity.
Pulmonary CT angiography (CTA) has been established as the first-line imaging technique for the diagnosis of pulmonary embolism (PE) in daily clinical practice [1,2]. Routine CT pulmonary angiography not only provides pulmonary arterial clot load information, but may even help to diagnose alternative causes for the patient's symptoms, such as pneumothorax, pneumonia, pulmonary oedema or pleural effusion. However, it only provides anatomical and morphological images and no information regarding perfusion function. In acute PE patients, anatomical obstruction is the most important cause of compromised physiology, and the release of vasoactive and bronchoactive agents from platelets may lead to deleterious ventilation–perfusion mismatch [3]. Therefore, assessment of both anatomical obstruction and functional perfusion is important. The emergence of dual-source CT means that simultaneous evaluation of lung parenchyma perfusion and vascular blockage is now feasible. It has been shown to be a reliable method, with only one CT scan, in animal experiments [4] and clinical practice [5-7]. Besides lung parenchyma perfusion and arterial obstruction, right ventricular function is also an important tool for assessment of severity and is a predictor of mortality [8,9] in acute PE patients. Several studies [10-13] have shown that the global right ventricular function can be accurately assessed with electrocardiogram (ECG)-gated multislice CT. Recently, Chae et al [14] evaluated the pulmonary perfusion defect (PPD) score in acute PE and compared it with the CT angiographic obstruction score and right ventricular/left ventricular (RV/LV) diameter ratio obtained from dual-source CT. They evaluated the RV function from the ratio of RV/LV diameter only, without mentioning the global RV function parameters, such as end-diastolic volume (EDV), end-systolic volume (ESV), stroke volume (SV) and ejection fraction (EF).
The aim of this study is to investigate the correlation between CT angiographic clot load (CTACL), PPD score and the global RV function with dual-source CT in acute PE. These parameters can be used for the assessment of the severity of PE. We analysed the correlation between the PPD score and CTACL score withthe global RV function parameters, SV and EF. At the same time, we also assessed the correlation between the global right ventricular function and the cardiovascular parameters, which include the diameter of the pulmonary artery trunk (PAT), the short axis diameter ratio of RV/LV at four-chamber view and the reflux of contrast medium into the inferior vena cava (IVC).
Methods and materials
Patients
This study was approved by our institutional review board. After explaining the study details, including the possibility of increased radiation dose exposure, informed consent was obtained from all patients. They were also informed of the added advantage of additional diagnostic information about their disease being available during this study. 107 patients, who had suspected cases of PE, underwent dual-energy CTA and ECG-gated cardiac examination with a dual-source CT scanner (Somatom Definition; Siemens Healthcare, Forchheim, Germany) between September 2009 and April 2010. Among them, 49 patents were diagnosed with acute PE. Complete data were obtained from the 49 patients [26 males, 23 females; mean age ± standard deviation (SD), 49±16 years; range, 23−85 years]. Five patients had a follow-up scan. The images of CTA and perfusion blood volume (PBV) were compared before and after treatment. The data after treatment were not included in the statistical analysis.
CT acquisition protocol
A dual-energy protocol was used for the thoracic angiography and ECG-gated coronary angiography scan for RV function analysis. The dual-energy protocol for CTA was as follows: 512×512 matrix, 64×0.6 mm collimation with a slice thickness of 1.5 mm, 0.33 s rotation time with a pitch value of 0.7. For the two tubes, 140 kV and 80 kV were chosen with a tube current ratio of 1:5 in favour of the high-voltage tube (51 mAs for 140 kV and 255 mAs for 80 kV). The region of interest for the triggering position was located at the superior vena cava or PAT and the threshold was 80 HU using the bolus-tracking technique. Images were acquired in a single breath-hold or eupnoea in the craniocaudal direction from the lung apex to the costophrenic angles. CTA was followed by ECG-gated coronary angiography using a standard scanning protocol of 100 kV and 64×0.6 mm collimation with 2 mm slice thickness in the caudocranial direction of the whole heart. To reduce the radiation exposure during ECG-gated coronary angiography scanning protocol, the Caredose4D (Somatom Definition) was activated during the scan and the scan pitch was automatically adapted according to the heart rate. ECG pulsing was set from 70% to 70%. A total of 40–50 ml of highly concentrated iodine-based contrast material (Iomeprol 400 mgI ml–1; Bracco Sine Pharma, Shanghai, China) was administered at a flow rate of 4.0–5.0 ml s–1 followed by 40 ml of mixed liquor (70% contrast medium and 30% saline) chaser at the rate of 2.5 ml s–1. The mixed liquor can reduce the artefacts on the right ventricle during the evaluation of the global right function.
Image post-processing
CTA images were reconstructed with a kernel of D20f smooth at 1.5 mm slice thickness with a 1.0 mm increment. Three series of axial images (140 kV, 80 kV and combination data from the low- and high- kilovoltage data with a mixing ratio of 7:3, high vs low potential) were generated. All images were processed by the Siemens MMWP workstation (Syngo multimodality workplaces, VE30A& Siemens Healthcare); The pulmonary CTACL score was assessed on the mixed image with a 7:3 combination weighting. Three series of images were loaded into the lung PBV (Siemens software packages, Syngo MMWP, VE32B; Siemens Healthcare) of dual-energy software to generate lung PBV images. An iodine distribution map (PBV image) was generated as a colour-coded image, and the perfusion defect score was analysed. The window view settings of the PBV image were at 40−60 HU with a width of 90−110 HU. From the cardiac CT raw data, 20 cardiac phases were calculated at every 5% of the cardiac cycle (0–95%). The slice thickness was 2 mm without an interslice gap. The field of view was 200–240 mm.
Image analysis
All the scores of PPD and CTACL and the measurement of the RV function parameters were evaluated by two thoracic radiologists, who had 20 and 8 years of clinical experience, respectively. Their findings were in consensus.
Pulmonary perfusion defect score
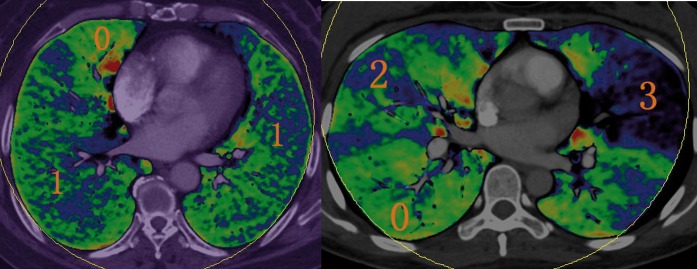
The PBV images were blindly reviewed without the findings from CTA imaging. The scoring method for perfusion defect originated from Chae et al's study [14]. A 4-point scale (Figure 1) was used: 0, normal perfusion; 1, mild perfusion defect with diffused stippled distribution; 2, moderately reduced perfusion with a patchy configuration; 3, profoundly reduced or absent perfusion with defect in segmental or subsegmental configuration. There were 20 segments per patient (3 segments for each upper lobe, 2 for the right middle lobe, 2 for the left lingular division and 5 segments for each lower lobe). The perfusion defect score was the result of perfusion defect value multiplied by the number of corresponding segments.
Figure 1.
The classification of pulmonary perfusion defect score. Green to red colour indicates normal perfusion (0). Blue to green colour with diffused stippled distribution is mild perfusion defect (1). Moderately reduced perfusion (2) is blue with a patchy configuration, and profoundly reduced or absent perfusion (3) is black to blue in colour.
CT angiographic clot load score
The CTA images were read by the same two readers in a randomised order and the obstruction score was calculated according to the Qanadli method [15]. The site and degree of obstruction in the arteries were assessed by this method. The score of the proximal thrombus obtained in the pulmonary arterial tree was obtained as the number of segmental branches arising distally. The degree of vascular obstruction was scored as follows: no obstruction, 0; partial obstruction, 1; and complete obstruction, 2. The CTACL maximum score for any patient was 40.
The global right ventricular function
The reconstruction cardiac data were loaded into the circulation software (Siemens software packages, Syngo MMWP, VE32B). After the two readers marked the end-diastolic phase and end-systolic phase, the software automatically drew the RV inner and outer contours. If the computer automatically outlined the RV contours and they were not acceptable, the contours were modified manually. The software then automatically calculated the RV function parameters, including EDV, ESV, SV and EF. At the same time, the PAT diameter was manually measured at the level where the right pulmonary artery was in continuity with the main pulmonary artery. On the four-chamber view, end-diastolic ventricular diameters were identified as the maximum distance between the interventricular septum and ventricular endocardium, perpendicular to the interventricular septum. Then the RV/LV end-diastolic diameter ratios were manually measured and calculated. IVC reflux was defined by a reflux of the contrast medium to the hepatic veins. Presence or absence of reflux of contrast medium into the IVC was recorded.
Statistical analysis
All statistical analysis was performed using SPSS v. 13.0 software (SPSS Inc., Chicago, IL). Continuous data were expressed as the mean ± SD. The correlation between the degree of perfusion defect and the degree of vascular obstruction was determined using Pearson's test. The Pearson's correlation coefficient was calculated for PPD score, RV/LV diameter ratio and EF. The same was done for CTACL score, RV/LV diameter ratio and EF. The PPD score, CTACL score, PAT diameter, EDV, ESV, SV and EF of RV/LV <1 group and RV/LV >1 group were evaluated with two independent sample t-tests. The presence or absence of reflux of contrast medium into IVC was assessed with the χ2 test. A p-value <0.05 was considered statistically significant.
Results
All dual-energy thoracic angiography and ECG-gated RV function examinations were of diagnostic quality and were carried out without complication. The scanning time of the lung and heart was 6.8±1.2 s and 8.7±2.1 s, respectively; their radiation doses were 1.3±0.1 mSv and 2.3 ±1.4 mSv, respectively. The following results in the 49 patients were achieved: PPD score, 25.1±7.8; CTACL score, 16.0±7.2; RV diameter, 4.5±0.8 cm; LV diameter, 4.5±0.6 cm; PAT diameter, 2.8±0.5 cm; EDV, 194.4±61.5 ml; ESV, 107.0±50.8 ml; SV, 89.4±39.3 ml; and EF, 46.5±17.1%.
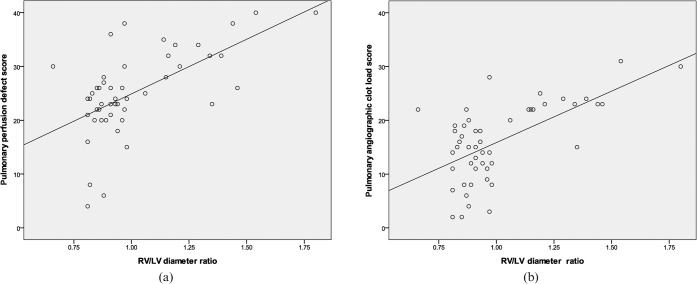
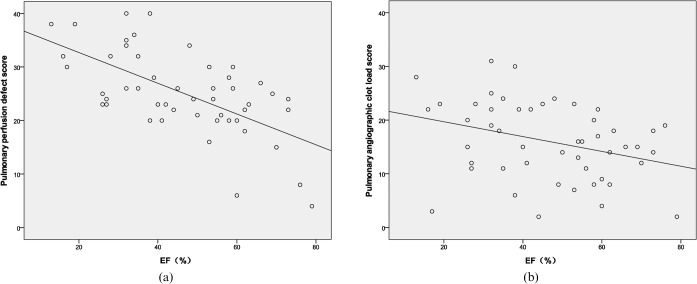
The PPD score had a strong positive correlation with the CTACL score (r = 0.72, p<0.001) (Figure 2). The PPD score and the CTACL score both had a strong positive correlation with RV/LV diameter ratio (PPD score, r = 0.60, p<0.001; CTACL score, r = 0.62, p<0.001) (Figure 3). However, the PPD score had a strong negative correlation with EF (r = −0.63, p<0.001) while the CTACL score had a low negative correlation with EF (r = −0.33, p = 0.02) (Figure 4).
Figure 2.
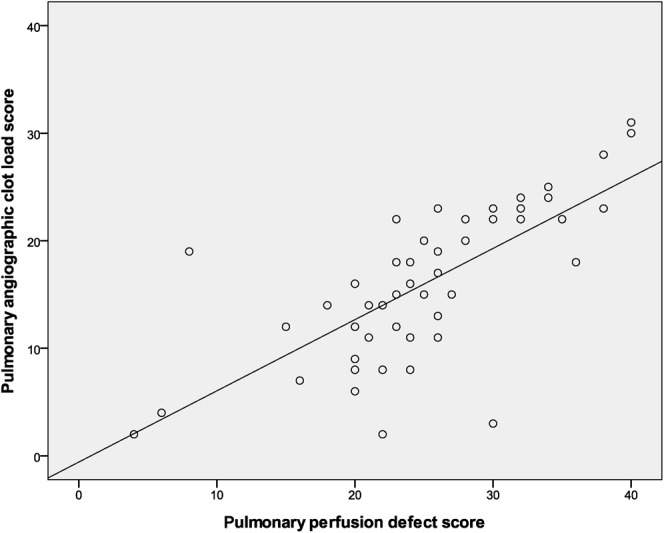
Correlation between pulmonary perfusion defect (PPD) score and CT angiographic clot load (CTACL) score in patient-based analysis. Graph shows that the PPD score has a strong positive correlation with the CTACL score (r = 0.72, p<0.001).
Figure 3.
Correlation between pulmonary perfusion defect score, CT angiographic clot load score and right ventricular/left ventricular (RV/LV) diameter ratio. (a) Shows the correlation between angiographic clot load score and RV/LV diameter ratio (r = 0.62, p<0.001). (b) Shows the correlation between perfusion defect score and RV/LV diameter ratio (r = 0.60, p<0.001).
Figure 4.
Correlation between pulmonary perfusion defect (PPD) score, CT angiographic clot load (CTACL) score and ejection fraction (EF). (a) Shows the correlation between PPD score and EF (r = −0.63, p<0.001). (b) Shows the correlation between CTACL score and EF (r = −0.33, p = 0.02).
Between the RV/LV <1 group (n = 35) and the RV/LV >1 group (n = 14), the parameters were significantly different except for EDV and SV (Table 1).
Table 1. Comparison with cardiopulmonary parameters between right ventricular/left ventricular (RV/LV) <1 and RV/LV >1 groups.
| Parameters | RV/LV <1 | RV/LV >1 | p-value |
| PPD score | 22.3±6.9 | 32.1±5.3 | <0.001 |
| CTACL score | 13.1±6.1 | 23.4±3.9 | <0.001 |
| PAT diameter (cm) | 2.6±0.4 | 3.2±0.6 | <0.001 |
| IVC reflux (%) | 8.6 (3/35) | 92.9 (13/14) | <0.001 |
| EDV (ml) | 185.6±86.1 | 216.5±56.7 | 0.11 |
| ESV (ml) | 92.7±48.8 | 142.9±37.1 | 0.01 |
| SV (ml) | 95.7±39.1 | 73.6±36.3 | 0.08 |
| EF (%) | 51.7±16.5 | 33.5±10.5 | <0.001 |
CTACL, CT angiographic clot load; EDV, end-diastolic volume; EF, ejection fraction; ESV, end-systolic volume; IVC, inferior vena cava; PAT, pulmonary artery trunk; PPD, pulmonary perfusion defect; SV, stroke volume.
Discussion
The results of our study indicate that dual-energy CT pulmonary parenchymal perfusion is closely related to the angiographic obstruction information in acute PE patients. The PPD score showed reliable correlation with both the RV/LV diameter ratio and the EF. The RV/LV diameter ratio >1 indicated right ventricle dysfunction. The CTACL score, PPD score, PAT diameter and EF were significantly different between normal and abnormal RV function.
Pulmonary CTA has been established as the first-line imaging technique for the diagnosis of PE, but it provides only morphological information about vascular occlusion and no functional information concerning lung perfusion. The most common imaging methods for evaluation of lung perfusion are perfusion scintigraphy and MRI. Perfusion scintigraphy has higher sensitivity but lower specificity for the diagnosis of PE [16]. It cannot distinguish between the causes of reduced perfusion and cannot show the extent of vascular obstruction. It therefore has limited use in clinical practice compared with CTA. A combination of pulmonary MR angiography and perfusion MRI has more than 90% sensitivity and specificity for the assessment of acute PE [17]. Owing to the difficulties in bringing some monitoring equipment into the examination room and the lower spatial resolution and long exposure time needed during MRI, it is not the modality of choice for the assessment of PE.
Moreover, the drawbacks of single-source CT perfusion imaging that make it clinically impractical include significant radiation exposure to the patient during the procedure, the inability to cover the whole lung and the complicated manipulations involved in performing imaging [18-20]. With the emergence of dual-source CT, simultaneous evaluation of lung perfusion and vascular embolisation is possible by dual-energy imaging protocol in acute PE patients.
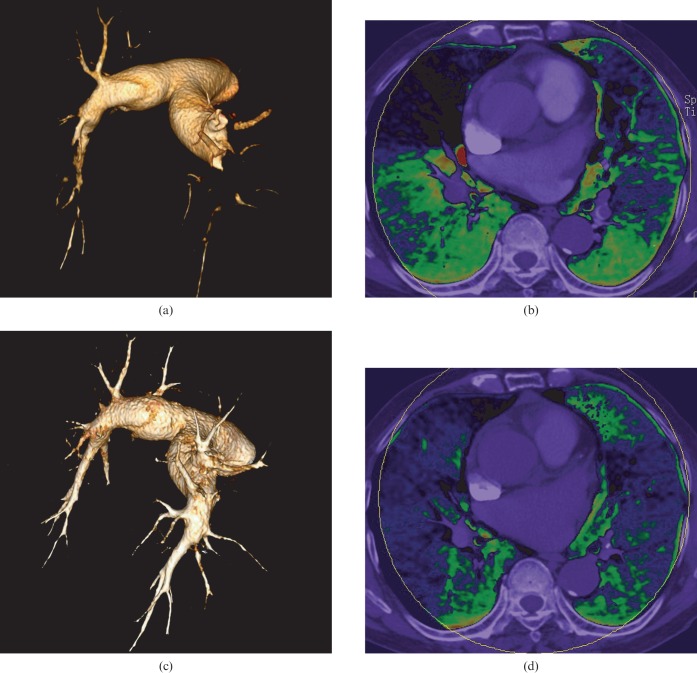
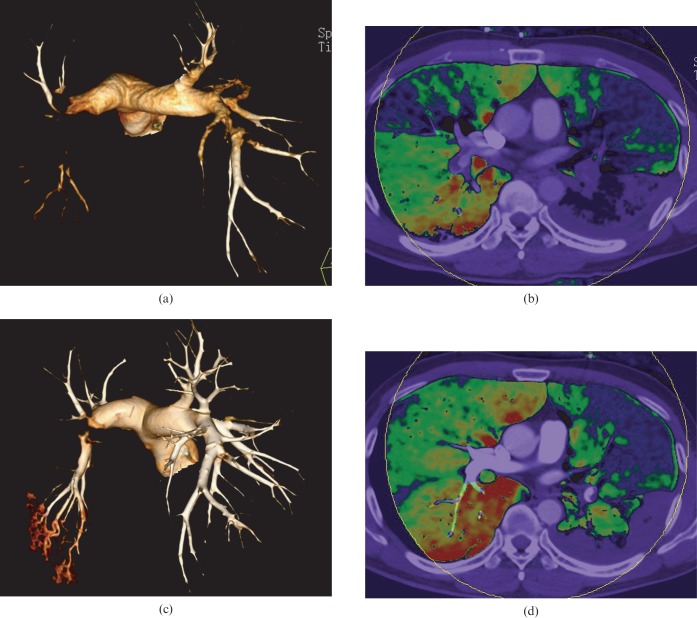
Our results show a good correlation between the PPD score and the score of pulmonary angiographic obstruction on a per-patient basis, which is consistent with Chae et al's study [14]. On a per-patient and per-segment basis, there is a discrepancy in the sensitivity and specificity of the dual-energy CT in the assessment of PE, as reported by Fink et al [21] and Thieme et al [5]. The dual-energy CT PBV image has higher sensitivity but lower specificity for detecting PE. Additionally, besides PE, alternative causes, such as cor pulmonale, chronic obstructive pulmonary disorder and pulmonary artery stenosis, can also lead to abnormal pulmonary perfusion and, as a result, false-positive results. In some segmental arteries with non-occlusive tiny mural thrombus, the PBV image may be normal and this is the reason for false-negative results. In an experimental PE model in rabbits, Zhang et al [4] reported that the diagnostic sensitivity of PBV imaging alone in the detection of PE was 87% and had a good correlation with pathological analysis. In contrast to PBV imaging, CTA had a lower sensitivity of 67%. The specificities of PBV and CTA were 92% and 100%, respectively. Small emboli in peripheral pulmonary arteries may have been overlooked because they have relatively low attenuation in CTA. However, these emboli can lead to conspicuous perfusion defect in PBV because of occlusion of small arteries. This may explain why the PPD score had a strong negative correlation with EF, whereas CTACL score had a low negative correlation in our study. The emboli almost disappeared in CTA images after thrombolytic treatment in several follow-up patients. The PBV images showed an aggravation of the perfusion defects (Figure 5), which may be due to the occlusion of peripheral small arteries. The results of CTA were consistent with PBV in some thrombolytic patients (Figure 6); the emboli disappeared in CTA images and the corresponding perfusion defects returned to normal in PBV images.
Figure 5.
Comparison between CT angiography and perfusion blood volume (PBV) images before and after thrombolytic therapy in an 82-year-old pulmonary embolism patient. (a, c) Volume rendering technique images show that the emboli have almost disappeared after thrombolytic therapy, whereas PBV (b, d) images show that although there is improved perfusion in the right middle and left lingual lobe, the perfusion of other lobes are aggravated.
Figure 6.
Comparison between CT angiography and perfusion blood volume (PBV) images before and after thrombolytic therapy in a 39-year-old pulmonary embolism patient. (a, c) Volume reducing technique images show the disappearance of the right pulmonary artery emboli and significant reduction in the size of the left pulmonary artery emboli. (b, d) PBV images show improvement on the perfusion of the corresponding areas.
RV function is an important predictor of mortality and quality of life in acute PE patients [8,9]. The principal quantitative criterion for the diagnosis of RV dysfunction is the presence of RV dilatation, which is diagnosed when RV exceeds LV end-diastolic diameter (RV:LV >1) [22,23]. In our study, the pulmonary CT signs such as PAT diameter and IVC reflux were significantly different between the normal and the abnormal RV function groups. The mean PAT diameter was 3.2 cm in our study when RV:LV was >1. Ghaye et al [24] reported a PAT diameter of greater than 3.0 cm indicates a PA pressure >20 mmHg.
Our study had the following limitations. First, all measurements and evaluations were made by two reviewers in consensus; therefore, there are no data on interobserver agreement. Second, we did not correlate the perfusion score with the results of perfusion scintigraphy and right function evaluation with the results of MR as external validators. We also did not correlate the perfusion score with patient outcome. Third, when we assessed the PBV images, there were three types of artefacts. As a result of the limited diameter (26 cm) of the 80 kV tube, coverage of the whole lung volume within the field of view was not feasible in many cases and small peripheral regions might have been missed. Streak artefacts on PBV images were often seen next to the heart and superior vena cava and sometimes were not easy to discern from true defects. Gravity-dependent lung perfusion defects may appear in a ventral direction. Fourth, our study exposed the patients to increased amounts of radiation and to iodinated contrast material. Furthermore, the use of CT for RV function analysis posed limitations owing to its inherent lacunae. Finally, the PBV images displayed iodine distribution at only a particular time point rather than yielding dynamic perfusion information as well.
Conclusion
PBV images of dual-energy CT can depict the blood distribution status. Both the PPD score and CTACL score have a good correlation with the right and left ventricle, which represents the severity of RV dysfunction. The PPD score has a strong correlation with EF, the parameter of global RV function, while the CTACL score has a low correlation with it. Cardiovascular manifestations can reflect the severity of RV function. Considering the PPD score, CTACL score and cardiovascular manifestations together can be helpful in assessing the severity of PE.
References
- 1.Schoepf UJ, Goldhaber SZ, Costello P. Spiral computed tomography for acute pulmonary embolism. Circulation 2004;109:2160–7 [DOI] [PubMed] [Google Scholar]
- 2.Remy-Jardin M, Pistolesi M, Goodman RL, Gelft WB, Gottschalk A, Mayo JR, et al. Management of suspected acute pulmonary embolism in the era of CT angiography: a statement from the Fleischner Society. Radiology 2007;245:315–29 [DOI] [PubMed] [Google Scholar]
- 3.Tapson VF. Acute pulmonary embolism. N Engl J Med 2008;358:1037–52 [DOI] [PubMed] [Google Scholar]
- 4.Zhang LJ, Zhao YE, Wu SY, Yeh BM, Zhou CS, Hu XB, et al. Pulmonary embolism detection with dual-energy CT: experimental study of dual-source CT in rabbits. Radiology 2009;252:61–70 [DOI] [PubMed] [Google Scholar]
- 5.Thieme SF, Becker CR, Hacker M, Nikolaou K, Reiser MF, Johnson TR. Dual energy CT for the assessment of lung perfusion: correlation to scintigraphy. Eur J Radiol 2008;68:369–74 [DOI] [PubMed] [Google Scholar]
- 6.Thieme SF, Johnson TR, Lee C, McWilliams J, Becker CR, Reiser MF, et al. Dual-energy CT for the assessment of contrast material distribution in the pulmonary parenchyma. AJR Am J Roentgenol 2009;193:144–9 [DOI] [PubMed] [Google Scholar]
- 7.Pontana F, Faivre JB, Remy-Jardin M, Flohr T, Schmidt B, Tacelli N, et al. Lung perfusion with dual-energy multidetector-row CT (MDCT): feasibility for the evaluation of acute pulmonary embolism in 117 consecutive patients. Acad Radiol 2008;15:1494–504 [DOI] [PubMed] [Google Scholar]
- 8.Coghlan JG, Davar J. How should we assess right ventricular function in 2008? Eur Heart J 2007;9:H22–8 [Google Scholar]
- 9.Van derMeer RW, Pattynama PM, van Strijen MJ, van denBerg-Huijsmans AA, Hartmann IJ, Putter H, et al. Right ventricular dysfunction and pulmonary obstruction index at helical CT: prediction of clinical outcome during 3-month follow-up in patients with acute pulmonary embolism. Radiology 2005;235:798–803 [DOI] [PubMed] [Google Scholar]
- 10.Plumhans C, Mühlenbruch G, Rapaee A, Sim KH, Seyfarth T, Günther RW, et al. Assessment of global right ventricular function on 64-MDCT compared with MRI. AJR Am J Roentgenol 2008;190:1358–61 [DOI] [PubMed] [Google Scholar]
- 11.Doğan H, Kroft LJ, Bax JJ, Schuijf JD, van derGeest RJ, Doornbos J, et al. MDCT assessment of right ventricular systolic function. AJR Am J Roentgenol 2006;186:S366–70 [DOI] [PubMed] [Google Scholar]
- 12.Remy-Jardin M, Delhaye D, Teisseire A, Hossein-Foucher C, Duhamel A, Remy J. MDCT of right ventricular function: impact of methodologic approach in estimation of right ventricular ejection fraction, part 2. AJR Am J Roentgenol 2006;187:1605–9 [DOI] [PubMed] [Google Scholar]
- 13.Delhaye D, Remy-Jardin M, Teisseire A, Hossein-Foucher C, Leroy S, Duhame A, et al. MSCT of right ventricular function: comparison of right ventricular ejection fraction estimation and equilibrium radionuclide ventriculography, part 1. AJR Am J Roentgenol 2006;187:1597–604 [DOI] [PubMed] [Google Scholar]
- 14.Chae EJ, Seo JB, Jang YM, Krauss B, Lee CW, Lee HJ, et al. Dual-energy CT for assessment of the severity of acute pulmonary embolism: pulmonary perfusion defect score compared with CT angiographic obstruction score and right ventricular/left ventricular diameter ratio. AJR Am J Roentgenol 2010;194:604–10 [DOI] [PubMed] [Google Scholar]
- 15.Qanadli SD, El Hajjam M, Vieillard-Baron A, Joseph T, Mesurolle B, Oliva VL, et al. New CT index to quantify arterial obstruction in pulmonary embolism: comparison with angiographic index and echocardiography. AJR Am J Roentgenol 2001;176:1415–20 [DOI] [PubMed] [Google Scholar]
- 16.Reinartz P, Wildberger JE, Schaefer W, Nowak B, Mahnken AH, Buell U. Tomographic imaging in the diagnosis of pulmonary embolism: a comparison between V/Q lung scintigraphy in SPECT technique and multislice spiral CT. J Nucl Med 2004;45:1501–8 [PubMed] [Google Scholar]
- 17.Fink C, Thieme S, Ley S, Clevert D, Reiser MF, Kauczor HU, et al. MRI of pulmonary embolism. [In German.] Radiologe 2007;47:708–15 [DOI] [PubMed] [Google Scholar]
- 18.Wildberger JE, Schoepf UJ, Mahnken AH, Herzog P, Ditt H, Niethammer MU, et al. Approaches to CT perfusion imaging in pulmonary embolism. Semin Roentgenol 2005;40:64–73 [DOI] [PubMed] [Google Scholar]
- 19.Schoepf UJ, Bruening R, Konschitzky H, Becker CR, Knez A, Weber J, et al. Pulmonary embolism: comprehensive diagnosis by using electron-beam CT for detection of emboli and assessment of pulmonary blood blow. Radiology 2000;217:693–700 [DOI] [PubMed] [Google Scholar]
- 20.Wildberger JE, Niethammer MU, Klotz E, Schaller S, Wein BB, Günther RW. Multi-slice CT for visualization of pulmonary embolism using perfusion weighted color maps. Rofo 2001;173:289–94 [DOI] [PubMed] [Google Scholar]
- 21.Fink C, Johnson TR, Michaely HJ, Morhard D, Becker C, Reiser M, et al. Dual energy CT angiography of the lung in patients with suspected pulmonary embolism: initial results. Rofo 2008;180:879–83 [DOI] [PubMed] [Google Scholar]
- 22.Kreit JW. The impact of right ventricular dysfunction on the prognosis and therapy of normotensive patients with pulmonary embolism. Chest 2004;125:1539–45 [DOI] [PubMed] [Google Scholar]
- 23.Quiroz R, Kucher N, Schoepf UJ, Kipfmueller F, Solomon SD, Costello P, et al. Right ventricular enlargement on chest computed tomography prognostic role in acute pulmonary embolism. Circulation 2004;109:2401–4 [DOI] [PubMed] [Google Scholar]
- 24.Ghaye B, Ghuysen A, Bruyere PJ, D'Orio V, Dondelinger RF. Can CT pulmonary angiography allow assessment of severity and prognosis in patients presenting with pulmonary embolism? What the radiologist needs to know. Radiographics 2006;26:23–40 [DOI] [PubMed] [Google Scholar]


