

Abstract
Objective
Global cardiac function assessment using multidetector CT (MDCT) is time-consuming. Therefore we sought to compare an automatic software tool with an established semi-automatic method.
Methods
A total of 36 patients underwent CT with 64×0.5 mm detector collimation, and global left ventricular function was subsequently assessed by two independent blinded readers using both an automatic region-growing-based software tool (with and without manual adjustment) and an established semi-automatic software tool. We also analysed automatic motion mapping to identify end-systole.
Results
The time needed for assessment using the semi-automatic approach (12:12±6:19 min) was reduced by 75–85% with the automatic software tool (unadjusted, 01:34±0:29 min, adjusted, 02:53±1:19 min; both p<0.001). There was good correlation (r=0.89; p<0.001) for the ejection fraction (EF) between the adjusted automatic (58.6±14.9%) and the semi-automatic (58.0±15.3%) approaches. Also the manually adjusted automatic approach led to significantly smaller limits of agreement than the unadjusted automatic approach for end-diastolic volume (±36.4 ml vs ±58.5 ml, p>0.05). Using motion mapping to automatically identify end-systole reduced analysis time by 95% compared with the semi-automatic approach, but showed inferior precision for EF and end-systolic volume.
Conclusion
Automatic function assessment using MDCT with manual adjustment shows good agreement with an established semi-automatic approach, while reducing the analysis by 75% to less than 3 min. This suggests that automatic CT function assessment with manual correction may be used for fast, comfortable and reliable evaluation of global left ventricular function.
Multidetector CT (MDCT) has been shown in various reports to offer a high degree of accuracy in identifying coronary artery disease in patients [1-4]. But clinical studies have also shown that, rather than the degree of the coronary stenosis, end-systolic volume (ESV) and ejection fraction (EF) of the left ventricle are the most important predictors for long-term survival and therapy success [5,6].
As MDCT allows the acquisition of a complete and continuous volumetric data set, as well as the related electrocardiogram, it is possible to accurately analyse left ventricular (LV) function [4,7-13]. For this, reconstructing short-axis slices, identifying cardiac borders and using Simpson'S rule to calculate the resulting volume is the method of choice. Although this process is (at least in part) semi-automatic and may be sped up using thicker slices [14], the main drawback of this method is the time needed. Times needed ranged from 63±3 min for a full manual approach (reported by Boehm et al [15]) to 15.9±2.8 min (reported by Dewey et al [16], who used a semi-automatic approach, thus being hardly acceptable for daily practice).
The recent introduction of systems offering automatic analysis of cardiac function based on a region-growing threshold algorithm shows great promise to overcome this drawback [17-19].
The aim of this study was therefore to evaluate an automatic four-dimensional (4D) analysis of a region-growing segmentation algorithm and motion mapping to automatically identify end-systole [20] for the assessment of LV function, taking into account the time needed and the degree of interobserver variability, as well as accuracy when compared with an established semi-automatic short-axis approach.
Methods and materials
Patient population
36 patients (25 males, 11 females, mean age 62.1±11.0 years) with known or suspected coronary artery disease, all of whom underwent clinically indicated cardiac MDCT with retrospective electrocardiogram (ECG) gating for assessment of their coronary arteries, were retrospectively chosen for evaluation of LV function by using a semi-automatic short-axis approach and a 4D region-growing approach. This retrospective study was approved by the institutional review board, which provided a waiver for informed consent. Written informed consent for CT was obtained from all patients.
MDCT protocol and image reconstruction
Image acquisition was performed during a single breath-hold on a 64-row CT scanner (Aquilion 64™, Toshiba, Otawara, Japan) using 64×0.5 mm collimination. The examination was carried out using a tube voltage of 120 kV, a tube current of 240–400 mA (according to patient bodyweight and sex), a pitch of 0.2–0.225 and a gantry rotation time of 400 ms. Parallel to the scan an ECG was digitally recorded to allow retrospective gating.
In case of patients' heart rates exceeding 70 beats per minute, a beta-blocker (esmolol) was intravenously administered. In addition, all patients received 1.2 mg nitroglycerin sublingual immediately before the scan.
76–100 ml (depending on the patient's bodyweight) of a non-ionic contrast agent (Solutrast 370™; Bracco, Milan, Italy) was injected via a cubital vein at a flow of 3.5–5 ml s–1, followed by a saline chaser bolus of 40 ml at a flow of 3 ml s–1. The automatic bolus-tracking feature of the scanner was used to start image acquisition when a threshold of 180 HU in the descending aorta was reached. The effective dose was estimated using CT-Expo software [21].
From the raw data of each scan, axial image series with 0.5 mm slice thickness and an increment of 0.5 mm were multisegmentally reconstructed [22] using data from up to 5 heartbeats at 10 time points in 10% intervals (centred around 0–90%) of the cardiac cycles, resulting in 2500–3000 images per patient.
In addition to this we also used the scanner's motion map-based software to automatically determine and reconstruct an image series at the time of least cardiac motion during systole (auto-systole) [20].
Analysis of left ventricular function
All analyses were performed by two independent readers.
Semi-automatic short-axis analysis
For the semi-automatic approach we used the scanner's software (v.3.001) (Figure 1) to obtain continuous 8 mm short-axis orientations with a 0 mm gap from the axial image series of all cardiac phases. Applying the software's semi-automatic recognition tool, we traced the endo- and epicardial borders manually, adjusting them if necessary [16]. Endocardial contours excluded papillary muscles. In this way, end-diastolic volume (EDV), ESV, stroke volume (SV), EF and myocardial mass (MM) were calculated using Simpson's rule. Basal slices with <180° circumferential LV muscle ring were disregarded [23]. The overall time needed for uploading the images, obtaining short-axis reformations, tracing of the cardiac borders and calculation of LV volumes was recorded.
Figure 1.

Appearance of the semi-automatic cardiac function analysis software. Top row: short-axis views at (a) end-diastole and (b) end-systole, with lineation of the epicardium (red line) and the endocardium (green line). Note that the ventricular lumen (pink shading) does not completely fill the endocardial border (green line) as the lumen recognition is threshold based and the papillary muscles are automatically excluded from the blood pool (red-shaded area). Bottom row: (c) shows the results of the global left ventricular function analysis; (d) displays a volume curve for all 10 phases, with the corresponding volumes shown in (e). Note that this is the same patient as shown in Figure 2.
Automatic analyses (region-growing approaches)
Automatic global function analysis was performed using 4D data sets including all 10 phases (resulting in 2500–3500 images) covering the cardiac cycle on a commercially available dedicated workstation (Vitrea 3.9™; Vital Images, Minnetonka, MN) (Figure 2). This software offered automatic segmentation, border detection and volume calculation based upon a three-dimensional region-growing algorithm. Furthermore, the software's algorithm uses intensity thresholding with competitive boundary adjustment to label contrasted ventricular blood and distinguish it from myocardium and papillary muscle tissue. Then a contouring algorithm fits inner and outer contours on each slice from the label data. Finally, the voxel mask is computed by scan conversion of the contours in the full-resolution voxel space.
Figure 2.

Appearance of the automatic region-growing cardiac function analysis software. The left toolbar column shows a volume curve (a) and the results of the global function analysis (b). The image section on the right shows a (c) two-chamber- and (d) four-chamber view, as well as (e) a short-axis slice and (f) a semi-transparent three-dimensional reconstruction during end-systole. Note that the papillary muscles are excluded from the blood pool (coloured blue in the images) on the chamber views (c, d) as only voxels with a certain HU density are recognised. Note that this is the same patient as shown in Figure 1.
For the first region-growing approach, all 10 time points of the reconstructed axial images were loaded into the software and the automatic process was started. The time needed between the uploading of the cardiac phases and the display of the results was recorded. As a second approach, the automatic recognition of the cardiac axes, the mitral valve plane, the heart's apex and LV borders were visually evaluated in each of the 10 cardiac phases and, if necessary, altered manually (Figure 3). The time needed for correction and recalculation of the functional parameters was added to the time obtained from the first approach.
Figure 3.
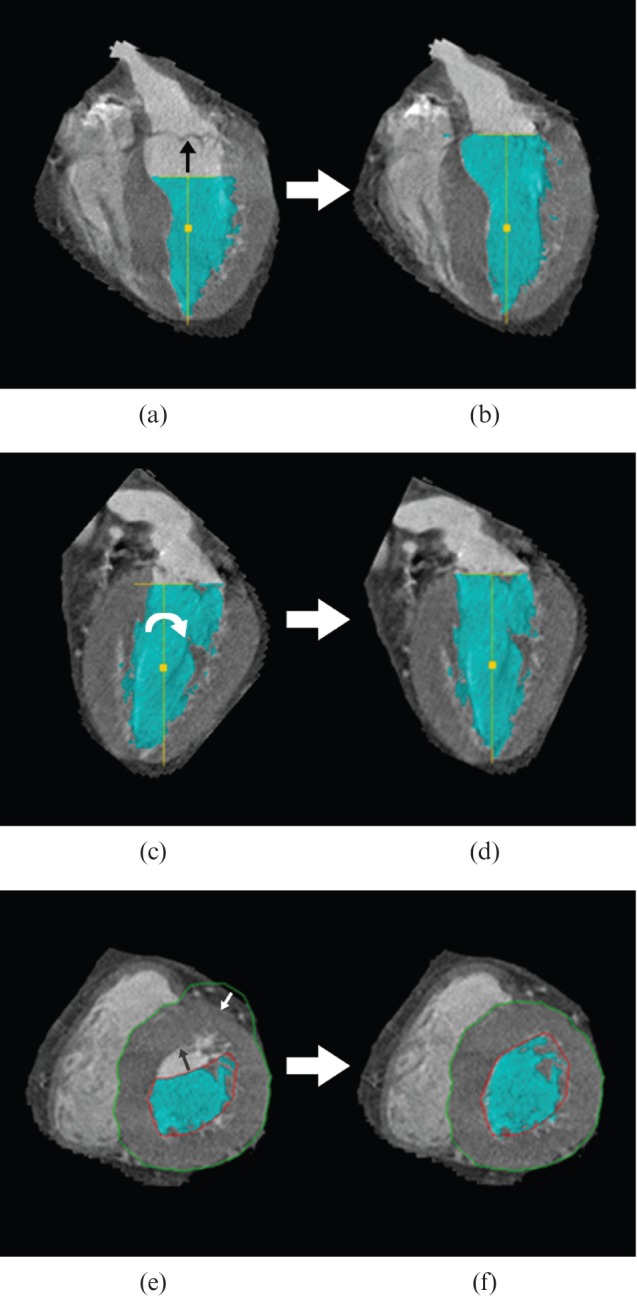
Manual adjustments in the region-growing approach. (a) Four-chamber view showing improper recognition of the mitral valve plane. For adjustment, the yellow T-bar was moved up to fit the valve plane (black arrow). (b) The result of repositioning; note the increased ventricular volume (blue-shaded area). (c) Two-chamber view showing an improper angle of the cardiac axis. For adjustment the yellow, vertical T-line was turned clockwise (white arrow) to line up the mitral valve and apex. (d) The result after rotation. (e) Short-axis view showing improper recognition of the endocardial (red line) and epicardial border (green line). For adjustment, the borders were manually moved to fit the endocardium (black arrow) and the epicardium (white arrow). (f) The result after border correction. Note the blue-shaded area (ventricular lumen) does not completely fill the endocardial border (red line), as the recognition of the ventricular lumen is threshold based.
As a third region-growing approach, instead of using all 10 phases from the cardiac circle, we used only the phase centred on 0% as the diastolic phase, and the auto-systole phase, determined by automatic motion mapping [20], as the systolic phase, applying the same method for manual adjustment as described above.
Statistical analysis
All data are expressed as mean values±standard deviation (SD) unless otherwise stated. Agreement between the different approaches was determined by Pearson's correlation coefficient, as well as Bland–Altman analysis [24], with the semi-automatic approach as reference. To compare the limits of agreement between the fully automatic and manually adjusted automatic region-growing approach a two-tailed F-test was performed. To examine the difference in time needed for the uncorrected and manually adjusted region-growing approach when compared with the semi-automatic approach, a paired Student's t-test was used.
For the interobserver variability, we compared differences between the two readers for the manually adjusted region-growing approach and semi-automatic approach using Bland–Altman analysis [24], and tested for any change in the limits of agreement using a two-tailed F-test. Furthermore, we used interclass correlation to test for reliability; results are expressed as the interclass correlation coefficient (ICC) and 95% confidence interval (CI). Statistical analysis was performed using SPSS v.12.0 (SPSS Inc., Chicago, IL). A p-value <0.05 was considered significant.
Results
MDCT was performed without any complication in all 36 patients. 76–100 ml (median 80 ml) of contrast agent was administered and the effective dose of MDCT was 15.5±1.7 msv. The average heart rate was 59.4±8.4 beats per minute. Two patients received oral (50 mg atenolol) and intravenous beta-blocker. 14 patients received intravenous beta-blocker (221±117 mg esmolol). For all patients, axial image series for 10 phases during the cardiac cycle (0–90%) could be reconstructed, but reconstruction of an image series using the scanner's automatic detection of the least motion feature (auto-systole) was not successful in one case. Thus, 35 patients were included in the comparison between the semi-automatic approach and the region-growing motion-mapping approach.
Ejection fraction
Regarding EF, there was a high and significant correlation (p<0.001) between the semi-automatic short-axis approach and both the automatic and manually adjusted region-growing approach including all 10 phases (Table 1). For the manually adjusted region-growing approach using motion mapping there was only a moderate but significant correlation (r=0.70; p<0.001) in comparison with the semi-automatic short-axis approach.
Table 1. Comparison of the fully automated and manually adjusted region-growing approach aganist the semi-automatic short-axis approach using 10 phases of the cardiac cycle for 36 patients.
| Semi-automatic SA |
Fully automated region-growing approach |
Manually adjusted automated region-growing approach |
|||||
| Mean±SD | Mean±SD | Regression vs SA | ICC [95% CI] | Mean±SD | Regression vs SA | ICC [95% CI] | |
| Analysis time in min | 12:12±6:19 | 01:34±0:29a | n/a | 02:53±1:19a,b | n/a | ||
| EF (%) | 58.0±15.3 | 56.7±16.1 | r=0.74; p<0,001; SEE=8.6; slope=0.89 intercept=4.84 | 0.85 [0.73; 0.92] | 58.6±14.9 | r=0.89; p<0.001; SEE=6.8; slope=0.87; intercept=8.10 | 0.81 [0.81; 0.95] |
| EDV (ml) | 142.8±54.6 | 130.5±36.0 | r=0.86; p<0.001; SEE=18.9; slope=0.56; intercept=50.06 | 0.78 [0.62; 0.89] | 137.2±44.0 | r=0.89; p<0.001; SEE=20.4; slope=0.72; intercept=34.87 | 0.87 [0.76; 0.93] |
| ESV (ml) | 65.7±52.6 | 59.9±39.3 | r=0.97; p<0.001; SEE=9.7; slope=0.72; intercept=12.36 | 0.93 [0.87; 0.96] | 60.9±41.8 | r=0.98; p<0.001; SEE=9.2; slope=0.78; intercept=9.97 | 0.95 [0.91; 0.98] |
| SV (ml) | 77.1±19.7 | 70.8±21.5 | r=0.52; p<0.001; SEE=18.6; slope=0.57; intercept=27.02 | 0.52 [0.23; 0.72] | 76.3±20.7 | r=0.65; p<0.001; SEE=15.9; slope=0.69; intercept=23.41 | 0.65 [0.42; 0.81] |
| MM (g) | 138.1±67.6 | 148.5±40.3 | r=0.75; p<0.001; SEE=26.9; slope=0.45; intercept=86.62 | 0.66 [0.42: 0.81] | 152.6±48.0 | r=0.77; p<0.001; SEE=31.0; slope=0.55; intercept=77.00 | 0.73 [0.53; 0.85] |
CI, confidence interval; EDV, end-diastolic volume; EF, ejection fraction; ESV, end-systolic volume; ICC, intraclass correlation coefficient; MM,myocardial mass; n/a, not available; SA, short-axis approach; SD, standard deviation; SEE, standard error of estimate; SV, stroke volume.
a<0.001, t-test vs semi-automatic short-axis approach.
b<0.001, t-test vs fully automated region-growing approach.
There was no significant over- or underestimation for any of the three region-growing approaches (p>0.05 for all) in comparison with the standard semi-automatic short-axis approach (Figures 4a and 5a). Furthermore, there was no significant difference in the limits of agreement for the automatic and manually adjusted region-growing approach (±16.6% vs ±13.1%, respectively; p=0.16; F-test), but the region-growing approach using motion mapping showed significantly larger limits of agreement (Figure 5a) than the manually adjusted region-growing approach using all 10 phases from the cardiac cycle (±25.0% vs ±13.2%; p<0.001; F-test).
Figure 4.

Summary of Bland–Altman analysis of (a) ejection fraction (EF), (b) end-diastolic volume (EDV), (c) end-systolic volume (ESV), (d) stroke volume (SV) and (e) myocardial mass (MM) for the automatic region-growing (RG_auto) and the manually adjusted region-growing (RG_man) approach, in comparison with the semi-automatic short-axis approach (SA) for the EF in 36 patients. There was a significant underestimation of EDV (b) by the RG_auto, whereas the RG_man significantly overestimated MM (e). There was also no difference in the limits of agreement between the RG_auto and the RG_man approach, which showed no significant difference (p>0.05 for all) for EF, SV and MM. However, the RG_man approach (c) showed significantly smaller limits of agreement (p<0.05) for EDV and ESV than the RG_auto approach (d). +, significant overestimation vs SA (p<0.05); −, significant underestimation vs SA (p<0.05); #, significant difference in limits of agreement vs RG_auto.
Figure 5.

Summary of Bland-Altman analysis of (a) ejection fraction (EF), (b) end-diastolic volume (EDV), (c) end-systolic volume (ESV), (d) stroke volume (SV) and (e) myocardial mass (MM) for the manually adjusted region-growing (RG_man) approach using all 10 phases of the cardiac cycle and the manually adjusted region-growing approach using motion mapping (RG_MM), in comparison with the semi-automatic short-axis approach (SA) in 35 patients. There was a significant overestimation of MM for both the RG_man approach using all 10 phases of the cardiac cycle and the RG_MM (e). Also, there were significantly larger limits of agreement in EF (a) and ESV (c) for the RG_MM in comparison with the RG_man approach using all 10 cardiac phases. +, significant overestimation vs SA (p<0.05); −, significant underestimation vs SA (p<0.05); #, significant difference in limits of agreement vs RG_man.
Intraclass correlation analysis with the semi-automatic short-axis approach showed high reliability for both the automatic and the manually adjusted region-growing approach (Table 1). The motion-mapping approach also showed high intraclass correlation (Table 2).
Table 2. Comparison of the manually adjusted region-growing approach using motion mapping with the semi-automatic short-axis approach using all 10 cardiac phases for 35 patients.
| Semi-automatic SA |
Manually adjusted automated region-growing approach (motion mapping) |
|||
| Mean±SD | Mean±SD | Regression vs SA | ICC [95% CI] | |
| Analysis time in min | 12:07±6:23 | 00:38±10:12a | n/a | n/a |
| EF (%) | 58.1±15.6 | 54.1±17.6 | r=0.70; p<0.001;SEE=12.7; slope=0.80; intercept=7.82 | 0.89 [0.79; 0.94] |
| EDV (ml) | 141.4±54.8 | 136.3±55.2 | r=0.90; p<0.001;SEE=24.30; slope=0.91; intercept=7.86 | 0.90 [0.81; 0.95] |
| ESV (ml) | 65.1±53.2 | 65.9±49.8 | r=0.92; p<0.001;SEE=19.4; slope=0.86; intercept=9.64 | 0.92 [0.85; 0.96] |
| SV (ml) | 76.3±19.4 | 70.4±20.2 | r=0.60; p<0.001;SEE=16.4; slope=0.62; intercept=22.74 | 0.60 [0.34; 0.78] |
| MM (g) | 136.5±67.9 | 149.7±61.2 | r=0.86; p<0.001;SEE=32.1; slope=0.77; intercept=44.50 | 0.85 [0.73; 0.92] |
CI, confidence interval; EDV, end-diastolic volume; EF, ejection fraction; ESV, end-systolic volume; ICC, intraclass correlation coefficient; MM,myocardial mass; n/a, not available; SA, short-axis approach; SD, standard deviation; SEE, standard error of estimate; SV, stroke volume.
ap<0.001, t-test vs semi-automatic short-axis approach.
End-diastolic volume and end-systolic volume
For both EDV and ESV there were again high and significant correlations (p<0.001) for both region-growing approaches using all 10 phases of the cardiac cycle (Table 1), as well as for the manually adjusted region-growing approach using motion mapping (Table 2), when compared with the semi-automatic short-axis approach.
There was also no significant over- or underestimation for all three region-growing approaches in respect to EDV (p>0.05 for all) and ESV (p>0.05 for all) in comparison with the semi-automatic short-axis approach (Figures 4b,c and 5b,c).
The manually adjusted region-growing approach showed significantly smaller limits of agreement than the fully automated region-growing approach (Figure 4b,c) with respect to EDV (±36.4 vs ±58.5 ml, respectively; p=0.006), as well as with respect to ESV (±23.6 vs ±33.6 ml, respectively; p=0.04). For ESV the manually adjusted region-growing approach using motion mapping showed significantly larger limits of agreement (Figure 5b,c) than the manually adjusted region-growing approach using all phases of the cardiac cycle (±39.4 vs ±23.9 ml, p<0.001).
For EDV, there was substantial reliability between the fully automated adjusted region-growing approach and the semi-automatic short-axis approach, whereas for the manually adjusted region-growing approach intraclass correlation analysis showed high reliability (Table 1). For ESV, both methods showed high reliability. The manually adjusted region-growing approach using motion mapping showed high reliability for both EDV and ESV (Table 2).
Stroke volume
For SV, all three region-growing methods showed only a moderate correlation, although manual adjustment tended to improve correlation (Tables 1 and 2). There was no significant over- or underestimation of SV by all three region-growing approaches when compared with the semi-automatic short-axis approach. Furthermore, there was no significant difference (p=0.16) in the limits of agreement between the automated and the manually adjusted region-growing approach using all phases of the cardiac cycle (Figure 4d), as well as between the manually adjusted region-growing approach using motion mapping and the manually adjusted region-growing approach using all phases of the cardiac cycle (p=0.33) (Figure 5d). For SV, the fully automated adjusted region-growing approach showed moderate reliability, whereas the manually adjusted region-growing approach showed substantial reliability (Table 1). The manually adjusted region-growing approach using motion mapping showed moderate reliability for SV (Table 2).
Myocardial mass
Analysis of MM showed a high, and significant, correlation (r>0.75, p<0.001) for both region-growing approaches using 10 cardiac phases. The manually adjusted region-growing approach using motion mapping also showed a high and significant correlation (Tables 1 and 2). There was a significant overestimation (mean difference −17.8±38.5 g; p=0.01) for the manually adjusted region-growing approach using 10 phases of the cardiac cycle, but not for the automatic approach (p=0.18).
The manually adjusted region-growing approach using motion mapping also showed a significant overestimation (mean difference −13.2±34.8 g; p=0.03). There was no significant difference in the limits of agreement (p=0.36) between the automated and the manually adjusted region-growing approach using 10 phases of the cardiac cycle (Figure 4e), nor for the manually adjusted region-growing approach using 10 cardiac phases or the region-growing approach using motion mapping (p=0.5) (Figure 5e). Interclass correlation with the semi-automatic short-axis approach showed substantial reliability for both region-growing approaches using all 10 phases of the cardiac cycle (Table 1), whereas for the manually adjusted region-growing approach using motion mapping reliability was high (Table 2).
Analysis time
The average time required for semi-automatic analysis was 12:12±6:19 min (Table 1). Using the automatic region-growing approach, the time needed for analysis was significantly reduced to 1:34±0:29 min (p<0.001), and the manually adjusted automated region-growing approach took on average 2:53±1:10 min, still showing a highly significant reduction of analysis time (p<0.001) compared with the semi-automatic approach (Table 1). The least time was required for the manually adjusted region-growing approach using automatic motion mapping, resulting in an average analysis time of only 0:38±0:12 min (Table 2).
Interobserver variability
There was a significant difference between Reader 1 and Reader 2 for EDV (149.7±57.2 ml vs 142.8±54.6 ml; p=0.02) and ESV (69.1±56.7 ml vs 65.7±52.6 ml; p=0.048) using the semi-automatic approach, but there was no significant difference between the readers for all cardiac function parameters (all p>0.05) when the manually adjusted region-growing approach was used (Figure 6). The semi-automatic short-axis approach also showed larger limits of agreement than the manually adjusted region-growing approach between the two readers for EF (±11.2% vs ±7.4%; p=0.005; F-test), for SV (±26.1 vs ±20.5 ml; p=0.005; F-test) and for MM (±66.6 vs ±52.2 g; p=0.02; F-test). Intraclass correlation analysis showed high reliability for both the semi-automatic and the manually adjusted region-growing approach (ICC >0.80 for all) for EF, EDV, ESV and MM (Table 3). Regarding SV, the manually adjusted region-growing approach showed slightly better reliability than the semi-automatic approach (ICC 0.87 vs 0.78, respectively).
Figure 6.

Summary of Bland-Altman analysis of (a) ejection fraction (EF), (b) end-diastolic volume (EDV), (c) end-systolic volume (ESV), (d) stroke volume (SV) and (e) myocardial mass (MM) for interobserver variability between Readers 1 and 2 for the semi-automatic short-axis approach (SA) and the manually adjusted region-growing approach (RG_man). For EDV (b) and ESV (c) there is a significant difference (p<0.05 for both) between the two readers using SA, but not for RG_man. Furthermore, SA shows significantly larger limits of agreement (p<0.05) than RG_man for EF (a). −, significant underestimation vs Reader 1 (p<0.05); #, significant difference in limits of agreement vs SA.
Table 3. Interrater reliability between two readers for the semi-automatic and the manually adjusted region-growing approach in 36 patients.
| Cardiac function parameters | Semi-automatic approach ICC [95% CI] | Manually adjusted region-growing approach ICC [95% CI] |
| EF | 0.93 [0.87; 0.96] | 0.97 [0.93; 0.98] |
| EDV | 0.96 [0.91; 0.98] | 0.93 [0.87; 0.97] |
| ESV | 0.98 [0.97; 0.99] | 0.97 [0.94; 0.98] |
| SV | 0.78 [0.61; 0.88] | 0.87 [0.76; 0.93] |
| MM | 0.85 [0.72; 0.92] | 0.88 [0.78; 0.94] |
CI, confidence interval; EDV, end-diastolic volume; EF, ejection fraction; ESV, end-systolic volume; ICC, intraclass correlation coefficient; MM, myocardial mass; SV, stroke volume.
Discussion
MDCT has shown promising results for the evaluation of global LV function [7-13], but so far, being based on short-axis reformations as adapted from MRI evaluation, it has been quite time-consuming [15,16]. An ideal method would be time-efficient and take advantage of the high spatial resolution of MDCT, while showing little interobserver variability. Such systems, based on a region-growing algorithm, have recently become available [17-19]. In our study we compared such a commercially available tool with an established semi-automatic short-axis method. EF, EDV and ESV determined by the novel automated 4D region tool using 10 cardiac phases showed good correlation for both the fully automatic and the manually adjusted approach with respect to the semi-automatic short-axis approach, while the manually adjusted approach showed superior limits of agreement for EDV. The time taken was reduced by 85% (to less than 2 min) for the automatic approach and by 75% (to less than 3 min) for the manually adjusted approach, a significant reduction in each case. The time needed was even further reduced using only two phases, obtained by using motion mapping [20], resulting in a reduction of 95% to less than 1 min. However, using only two phases resulted in only moderate correlation with the short-axis approach for EF, and it also showed a significant overestimation of myocardial mass and significantly larger limits of agreement for EF and ESV with respect to the region-growing approach using 10 phases, thus proving to be inferior to the manually adjusted region-growing approach. Furthermore, using all 10 phases of the cardiac cycle may also lead to further diagnostic information, such as regional assessment of LV function [13] or the evaluation of the aortic valve [25,26], especially as part of the emerging “triple-rule-out” protocols [27-29]. Any increase in the number of phases of the cardiac cycle used for analysis, on the other hand, may only lead to a minimal increase of diagnostic gain, as recently reported by Puesken et al [30], but requiring larger storage and network capacities.
Our results agree well with those previously shown by Mühlenbruch et al [19], except for SV, where Mühlenbruch et al reported an excellent correlation, whereas our study only showed moderate correlation. Furthermore, Mühlenbruch et al [19] required manual identification of systole and diastole, thus reducing the amount of images and workstation workload. In addition, this was not counted for in the time analysis, whereas in our study the identification of end-systole and end-diastole was done fully automatically and included in the time needed for analysis. Despite this difference, the analysis time in the current study (173±79 s) and in the study by Mühlenbruch et al [19] (173±38 s) were comparable, which probably relates to the increasing processing power of dedicated workstations. Our results also agree well with those reported by Krishnam et al [31], who used similar software and a similar approach to Mühlenbruch et al [19]. In agreement with our results, Krishnam et al [31], after excluding 6 out of their 26 patients owing to pacemaker artefacts, also reported no significant difference (p>0.05) for LV volumes (EF, EDV, ESV, SV) between two independent readers using automated region-growing segmentation software.
Joemai et al [32] evaluated automated cardiac phase selection using motion mapping, and reported excellent correlation for ESV (r=0.99), which agrees well with our results (r=0.92). However, Joemai et al [32] also reported a high correlation for EF (r=0.99), which was only moderate in our study (r=0.70). In addition, we found no significant over- or underestimation for ESV and EF, whereas Joemai et al [32] did report a small but significant overestimation for EF (−1±1.3%) and a significant underestimation for ESV (1.3±2.1 ml). In our opinion, those differences mainly relate to different reference standards, since we used a semi-automatic short-axis approach, whereas Joemai et al [32] used the region-growing approach itself (with 10 phases of the cardiac cycle) as the reference.
However, there are limitations to this study. All evaluations were done using different software applied to data sets acquired using MDCT alone, whereas MRI is currently considered the gold standard for LV functional analysis [33].
The main field of employment for cardiac MDCT is coronary angiography of patients with low or medium pre-test probability of coronary artery disease [34]. Hence, the number of patients with poor cardiac function should be significantly small. Nevertheless, our study also included patients (11 out of 36) with reduced cardiac function (EF <55%). Therefore MDCT could also act as a gatekeeper for further diagnostics using MRI, even in patients with poor cardiac function. Furthermore, this study focused on evaluating whether values obtained from a novel 4D region-growing approach could be used to replace a well-established two-dimensional semi-automatic short-axis approach, and all cardiac function analysis tools (four different approaches) were evaluated by two independent readers, allowing us to establish interobserver variability. In addition, we used retrospective gating in our study, which yields higher radiation exposure than prospective triggering. Nevertheless, cardiac function assessment is not possible with prospective gating. In another study, Mahnken et al [35] showed that using dose modulation does not impair accurate assessment of LV function. In fact, we think radiation dose can be reduced even further using this region-growing approach, as assessment of cardiac function is more dependent on temporal resolution than on spatial resolution and image noise (Figure 7).
Figure 7.

Effect of dose reduction on left ventricular function evaluation in a 63-year-old male patient (top row: diastole; bottom row: systole). (a) Images obtained by retrospective gating using a tube current of 400 mA. Simulated image quality as expected by using dose modulation and a tube current of (b) 250 mA and (c) 62.5 mA. Note that there is no substantial difference in detection of the epicardial (green line) and endocardial (red line) borders using lower doses.
In conclusion, region-growing-based 4D analysis of LV function using MDCT offers accurate and precise assessment, while considerably reducing analysis time. Automatic motion mapping may be used to reduce analysis time even further, but results in less precise estimation of EF and ESV. That said, CT could act as an easy-to-use alternative method in patients with contra-indications to MRI and poor accessibility in echocardiography, and it also shows the potential to become a “one-stop shop” solution for non-invasive cardiac assessment, if radiation dose can be further reduced.
References
- 1.Miller JM, Rochitte CE, Dewey M, Arbab-Zadeh A, Niinuma H, Gottlieb I, et al. Diagnostic performance of coronary angiography by 64-row CT. N Engl J Med 2008;359:2324–36 [DOI] [PubMed] [Google Scholar]
- 2.Sun Z, Lin C, Davidson R, Dong C, Liao Y. Diagnostic value of 64-slice CT angiography in coronary artery disease: a systematic review. Eur J Radiol 2008;67:78–84 [DOI] [PubMed] [Google Scholar]
- 3.Hay CS, Morse RJ, Morgan-Hughes GJ, Gosling O, Shaw SR, Roobottom CA. Prognostic value of coronary multidetector CT angiography in patients with an intermediate probability of significant coronary heart disease. Br J Radiol 2010;83:327–30 [DOI] [PMC free article] [PubMed] [Google Scholar]
- 4.Ko SM, Kim YJ, Park JH, Choi NM. Assessment of left ventricular ejection fraction and regional wall motion with 64-slice multidetector CT: a comparison with two-dimensional transthoracic echocardiography. Br J Radiol 2010;83:28–34 [DOI] [PMC free article] [PubMed] [Google Scholar]
- 5.White HD, Norris RM, Brown MA, Brandt PW, Whitlock RM, Wild CJ. Left ventricular end-systolic volume as the major determinant of survival after recovery from myocardial infarction. Circulation 1987;76:44–51 [DOI] [PubMed] [Google Scholar]
- 6.Hammermeister KE, DeRouen TA, Dodge HT. Variables predictive of survival in patients with coronary disease. Selection by univariate and multivariate analyses from the clinical, electrocardiographic, exercise, arteriographic, and quantitative angiographic evaluations. Circulation 1979;59:421–30 [DOI] [PubMed] [Google Scholar]
- 7.Dewey M, Muller M, Eddicks S, Schnapauff D, Teige F, Rutsch W, et al. Evaluation of global and regional left ventricular function with 16-slice computed tomography, biplane cineventriculography, and two-dimensional transthoracic echocardiography: comparison with magnetic resonance imaging. J Am Coll Cardiol 2006;48:2034–44 [DOI] [PubMed] [Google Scholar]
- 8.Wu YW, Tadamura E, Kanao S, Yamamuro M, Okayama S, Ozasa N, et al. Left ventricular functional analysis using 64-slice multidetector row computed tomography: comparison with left ventriculography and cardiovascular magnetic resonance. Cardiology 2007;109:135–42 [DOI] [PubMed] [Google Scholar]
- 9.Annuar BR, Liew CK, Chin SP, Ong TK, Seyfarth MT, Chan WL, et al. Assessment of global and regional left ventricular function using 64-slice multislice computed tomography and 2D echocardiography: a comparison with cardiac magnetic resonance. Eur J Radiol 2008;65:112–19 [DOI] [PubMed] [Google Scholar]
- 10.van derVleuten PA, de Jonge GJ, Lubbers DD, Tio RA, Willems TP, Oudkerk M, et al. Evaluation of global left ventricular function assessment by dual-source computed tomography compared with MRI. Eur Radiol 2009;19:271–7 [DOI] [PubMed] [Google Scholar]
- 11.van der Vleuten PA, Willems TP, Gotte MJ, Tio RA, Greuter MJ, Zijlstra F, et al. Quantification of global left ventricular function: comparison of multidetector computed tomography and magnetic resonance imaging. a meta-analysis and review of the current literature. Acta Radiol 2006;47:1049–57 [DOI] [PubMed] [Google Scholar]
- 12.Schlosser T, Mohrs OK, Magedanz A, Voigtlander T, Schmermund A, Barkhausen J. Assessment of left ventricular function and mass in patients undergoing computed tomography (CT) coronary angiography using 64-detector-row CT: comparison to magnetic resonance imaging. Acta Radiol 2007;48:30–5 [DOI] [PubMed] [Google Scholar]
- 13.Wu YW, Tadamura E, Yamamuro M, Kanao S, Okayama S, Ozasa N, et al. Estimation of global and regional cardiac function using 64-slice computed tomography: a comparison study with echocardiography, gated-SPECT and cardiovascular magnetic resonance. Int J Cardiol 2008;128:69–76 [DOI] [PubMed] [Google Scholar]
- 14.Dogan H, Veldkamp WJ, Dibbets-Schneider P, Spijkerboer AM, Mertens BJ, Kroft LJ, et al. Effects of heart rate, filling and slice thickness on the accuracy of left ventricular volume measurements in a dynamic cardiac phantom using ECG-gated MDCT. Br J Radiol 2008;81:577–82 [DOI] [PubMed] [Google Scholar]
- 15.Boehm T, Alkadhi H, Roffi M, Willmann JK, Desbiolles LM, Marincek B, et al. Time-effectiveness, observer-dependence, and accuracy of measurements of left ventricular ejection fraction using 4-channel MDCT. Rofo 2004;176:529–37 [DOI] [PubMed] [Google Scholar]
- 16.Dewey M, Muller M, Teige F, Hamm B. Evaluation of a semiautomatic software tool for left ventricular function analysis with 16-slice computed tomography. Eur Radiol 2006;1:25–31 [DOI] [PubMed] [Google Scholar]
- 17.Bastarrika G, Arraiza M, Pueyo JC, Herraiz MJ, Zudaire B, Villanueva A. Quantification of left ventricular function and mass in cardiac dual-source CT (DSCT) exams: comparison of manual and semiautomatic segmentation algorithms. Eur Radiol 2008;18:939–46 [DOI] [PubMed] [Google Scholar]
- 18.Busch S, Johnson TR, Wintersperger BJ, Minaifar N, Bhargava A, Rist C, et al. Quantitative assessment of left ventricular function with dual-source CT in comparison to cardiac magnetic resonance imaging: initial findings. Eur Radiol 2008;18:570–5 [DOI] [PubMed] [Google Scholar]
- 19.Mühlenbruch G, Das M, Hohl C, Wildberger JE, Rinck D, Flohr TG, et al. Global left ventricular function in cardiac CT. Evaluation of an automated 3D region-growing segmentation algorithm. Eur Radiol 2006;16:1117–23 [DOI] [PubMed] [Google Scholar]
- 20.Hoffmann MH, Lessick J, Manzke R, Schmid FT, Gershin E, Boll DT, et al. Automatic determination of minimal cardiac motion phases for computed tomography imaging: initial experience. Eur Radiol 2006;16:365–73 [DOI] [PubMed] [Google Scholar]
- 21.Stamm G, Nagel HD. CT-expo—a novel program for dose evaluation in CT. [In German.] Rofo 2002;174:1570–6 [DOI] [PubMed] [Google Scholar]
- 22.Dewey M, Muller M, Teige F, Schnapauff D, Schink T, Hamm B, et al. Multisegment and halfscan reconstruction of 16-slice computed tomography for assessment of regional and global left ventricular myocardial function. Invest Radiol 2006;41:400–9 [DOI] [PubMed] [Google Scholar]
- 23.Juergens KU, Grude M, Maintz D, Fallenberg EM, Wichter T, Heindel W, et al. Multi-detector row CT of left ventricular function with dedicated analysis software versus MR imaging: initial experience. Radiology 2004;230:403–10 [DOI] [PubMed] [Google Scholar]
- 24.Bland JM, Altman DG. Statistical methods for assessing agreement between two methods of clinical measurement. Lancet 1986;1:307–10 [PubMed] [Google Scholar]
- 25.Lembcke A, Kivelitz DE, Borges AC, Lachnitt A, Hein PA, Dohmen PM, et al. Quantification of aortic valve stenosis: head-to-head comparison of 64-slice spiral computed tomography with transesophageal and transthoracic echocardiography and cardiac catheterization. Invest Radiol 2009;44:7–14 [DOI] [PubMed] [Google Scholar]
- 26.Feuchtner GM, Dichtl W, Friedrich GJ, Frick M, Alber H, Schachner T, et al. Multislice computed tomography for detection of patients with aortic valve stenosis and quantification of severity. J Am Coll Cardiol 2006;47:1410–17 [DOI] [PubMed] [Google Scholar]
- 27.Hein PA, Romano VC, Lembcke A, May J, Rogalla P. Initial experience with a chest pain protocol using 320-slice volume MDCT. Eur Radiol 2009;19:1148–55 [DOI] [PubMed] [Google Scholar]
- 28.Gallagher MJ, Raff GL. Use of multislice CT for the evaluation of emergency room patients with chest pain: the so-called “triple rule-out”. Catheter Cardiovasc Interv 2008;71:92–9 [DOI] [PubMed] [Google Scholar]
- 29.Rist C, Johnson TR, Becker CR, Reiser MF, Nikolaou K. New applications for noninvasive cardiac imaging: dual-source computed tomography. Eur Radiol 2007;17(Suppl. 6):F16–25 [DOI] [PubMed] [Google Scholar]
- 30.Puesken M, Fischbach R, Wenker M, Seifarth H, Maintz D, Heindel W, et al. Global left-ventricular function assessment using dual-source multidetector CT: effect of improved temporal resolution on ventricular volume measurement. Eur Radiol 2008;18:2087–94 [DOI] [PubMed] [Google Scholar]
- 31.Krishnam MS, Tomasian A, Iv M, Ruehm SG, Saleh R, Panknin C, et al. Left ventricular ejection fraction using 64-slice CT coronary angiography and new evaluation software: initial experience. Br J Radiol 2008;81:450–5 [DOI] [PubMed] [Google Scholar]
- 32.Joemai RM, Geleijns J, Veldkamp WJ, Kroft LJ. Clinical evaluation of 64-slice CT assessment of global left ventricular function using automated cardiac phase selection. Circ J 2008;72:641–6 [DOI] [PubMed] [Google Scholar]
- 33.Bellenger NG, Francis JM, Davies CL, Coats AJ, Pennell DJ. Establishment and performance of a magnetic resonance cardiac function clinic. J Cardiovasc Magn Reson 2000;2:15–22 [DOI] [PubMed] [Google Scholar]
- 34.Meijboom WB, van Mieghem CA, Mollet NR, Pugliese F, Weustink AC, van Pelt N, et al. 64-slice computed tomography coronary angiography in patients with high, intermediate, or low pretest probability of significant coronary artery disease. J Am Coll Cardiol 2007;50:1469–75 [DOI] [PubMed] [Google Scholar]
- 35.Mahnken AH, Bruners P, Schmidt B, Bornikoel C, Flohr T, Gunther RW. Left ventricular function can reliably be assessed from dual-source CT using ECG-gated tube current modulation. Invest Radiol 2009;44:384–9 [DOI] [PubMed] [Google Scholar]