Abstract
Objective
Desmoid tumour is a common extraintestinal manifestation of patients with familial adenomatous polyposis (FAP) who have undergone prophylactic colectomy. We aimed to determine whether MRI provides equivalent or better assessment of desmoid tumours than CT, the current first-line investigation.
Methods
Following ethics approval and informed consent, FAP patients with known desmoid tumour underwent contrast-enhanced 64-slice multidetector CT (MDCT) and 1.5 T MRI (incorporating T1 weighted, T2 weighted, short tau inversion–recovery and T1 weighted with contrast, axial, sagittal and coronal sequences). The number, site, size, local extent, tumour signal intensity and desmoid-to-aorta enhancement ratio were analysed.
Results
MRI identified 23 desmoid tumours in 9 patients: 9 intra-abdominal desmoid (IAD) tumours, 10 abdominal wall desmoid (AWD) tumours and 4 extra-abdominal desmoid (EAD) tumours. CT identified only 21 desmoids; 1 EAD and 1 AWD were not identified. The two modalities were equivalent in terms of defining local extent of desmoid. Five IAD tumours involved the bowel, six caused ureteric compression and none compromised the proximal superior mesenteric artery. There was no difference in median desmoid size: 56.7 cm2 (range 2–215 cm2) on MDCT and 56.3 cm2 (3–215 cm2) on MRI (p=0.985). The mean MRI enhancement ratio, at 1.12 (standard deviation 0.43), was greater than the CT enhancement ratio, which was 0.48 (0.16) (p<0.0001). High signal intensity on T2 MRI was associated with increased MRI enhancement ratio (p=0.006).
Conclusions
MRI is at least equivalent (and may be superior) to MDCT for the detection of desmoid tumours in FAP. Coupled with the advantage of avoiding radiation, it should be considered as the primary imaging modality for young FAP patients.
Familial adenomatous polyposis (FAP) is an autosomal dominant disease predisposing to the development of hundred to thousands of colorectal adenomatous polyps. It is caused by a germline mutation in the APC tumour suppressor gene. The modern management of FAP, incorporating predictive genetic testing and prophylactic surgery, has meant that extracolonic manifestations of FAP, particularly desmoid tumours and polyposis of the upper gastrointestinal tract, are now the leading cause of mortality among patients having undergone prophylactic colectomy [1-3].
Desmoids are myofibroblastic proliferations that occur in 10–15% of patients with FAP [4]. An APC mutation 3′ to codon 1399 predisposes to an increased desmoid risk [5]. FAP-associated desmoids have a propensity for intra-abdominal sites and the abdominal wall, and frequently occur following surgery [6]. While they are non-metastasising, they can be locally invasive, resulting in symptoms through a mass or pressure effect. Aggressive mesenteric desmoids can lead to small bowel obstruction, ischaemia and perforation. Their proximity to the proximal superior mesenteric artery makes surgical excision challenging, often necessitating significant enterectomy. Retroperitoneal desmoids can cause hydronephrosis owing to ureteric impingement and often necessitate ureteric stenting.
Desmoids have a variable clinical course, with the majority undergoing cycles of growth and resolution, and only 10% growing relentlessly to cause mortality [7]. 70% of FAP-related desmoids are intra-abdominal desmoid (IAD) tumours, and are associated with significantly poorer survival than abdominal wall desmoid (AWD) tumours and extra-abdominal desmoid (EAD) tumours [8]. Surgical resection is the recommended first-line treatment for symptomatic abdominal wall and extra-abdominal desmoid tumours [4]. For IAD tumours, non-steroidal anti-inflammatory drugs (NSAIDs) and/or anti-oestrogen (tamoxifen/torimifene) are used as first-line therapy, with cytotoxic chemotherapy reserved for less responsive desmoids [4]. Owing to very high morbidity and recurrence rate, surgery is not recommended as first-line treatment for IAD tumours [9], but still remains a valuable option when medical treatment of large IAD fails [10].
CT is currently the standard technique for evaluating suspected IAD in FAP [11]. Intuitively, MRI may provide better assessment of desmoids, being the modality of choice in the diagnosis and prognostication of other benign and malignant soft-tissue tumours, owing to its superior contrast-to-noise ratio [12]. Nevertheless, to date there have been limited MRI data relating to FAP-associated desmoids. Various case reports and small series describe the MRI features of desmoids [13-16]. However, these combine sporadic and FAP-related desmoids to maximise case numbers. Clinically, this is less useful as FAP-related desmoids differ from sporadic desmoids in both their clinical traits and biology: FAP desmoids have an underlying “second-hit” somatic APC mutation [5]; sporadic desmoids tend to occur in extra-abdominal sites and usually cause less morbidity and mortality than the more commonly occurring IAD found in FAP patients.
A previous study [17] comparing MRI and CT for assessing desmoids in FAP demonstrated that MRI can show both IAD and AWD in FAP patients, but the anatomical imaging by CT was superior. This study also showed high signal intensity on T2 weighted images to be predictive of aggressive desmoid behaviour [17]. Since that study, MRI and CT techniques have improved substantially. To the best of our knowledge no studies have compared state-of-the-art MRI and multidetector CT (MDCT). The aim of this study was to establish whether current MRI techniques provide equivalent or superior assessment of FAP-related desmoids to 64-slice MDCT.
Methods and patients
Patients
The St Mark's Hospital polyposis registry database was searched to identify patients with a diagnosis of FAP, defined by either an identified APC mutation or the presence of over 100 colorectal adenomas with no evidence of MYH mutation. FAP patients with confirmed desmoid tumours based on previous radiological and clinical evidence were identified and prospectively recruited. All patients underwent abdominal MDCT and MRI, with scans being performed within 1 month of each other. Ethics approval and written informed consent were obtained.
Imaging
MDCT was performed using a 64-slice MDCT (Brilliance 64; Philips Healthcare, Best, the Netherlands). Following iv contrast administration (100 ml at 3 ml s−1 via a pump injector; Visipaque 270, GE Healthcare, Waukesha, WI) and a delay of 65 s, imaging was performed using the parameters summarised in Table 1.
Table 1. Acquisition parameters for multidetector CT (MDCT).
| MDCT kV | mA | Rotation speed | Matrix | FOV | Collimation | ST |
| 120 | 280 | 0.75 | 512 | 350 | 64×0.625 | 2 mm |
FOV, field of view; ST, slice thickness.
MRI was performed using a 1.5 T MR scanner (Siemens Avanto; Siemens Healthcare, Erlangen, Germany) and multichannel multielement coil system. T1 and T2 weighted axial, coronal and sagittal sequences of the abdomen and pelvis were supplemented by short tau inversion-recovery (STIR) and T1 weighted post-gadolinium axial sequences. The acquisition parameters are listed in Table 2. Respiratory gating was used to reduce movement artefacts caused by breathing, and 10 mg of intravenous hyoscine-N-butylbromide (Buscopan; Boehringer Ingelheim, Ingelheim am Rhein, Germany) was used to reduce peristalsis.
Table 2. Acquisition parameters for MRI.
| 1.5 T MRI | TR | TE | FA | TI | ST | NEX | Matrix | FOV |
| T1 | 200 | 4 | 70 | 5 | 1 | 256/179 | 70 | |
| T2 | 3180 | 97 | 150 | 5 | 1 | 256/179 | 150 | |
| STIR | 3800 | 93 | 160 | 150 | 5 | 1 | 256/131 | 160 |
| T1 post contrast | 195 | 4 | 70 | 8 | 1 | 256/157 | 70 |
FA, flip angle; FOV, field of view; NEX, number of excitations; ST, slice thickness; STIR, short tau inversion–recovery; T1, T1 weighted MRI; T2, T2 weighted MRI; TE, time to echo; TI, time to inversion; TR, time to repetition.
Image analysis
Two experienced gastrointestinal radiologists assessed the MDCT and MRI viewed on standard reporting workstations (Brilliance, Philips Healthcare; Leonardo, Siemens Healthcare) on separate occasions. In case of discrepancy, consensus was reached via discussion.
Outcomes of interest
For each modality the number of desmoids and desmoid tumour size was documented. The size of desmoids was obtained by automated region of interest analysis and the area recorded in centimetres squared. All desmoid lesions were classified by site into IAD, AWD or EAD. IAD incorporated mesenteric desmoids; AWD incorporated desmoids located in anterior and posterior abdominal wall muscles; and EAD incorporated desmoids at other sites. For each lesion, its margin was noted on both modalities, and its relationship to bowel, urinary tract and vessels, including the proximal superior mesenteric artery, was recorded. The enhancement ratio on each modality was calculated for each lesion by dividing the desmoid enhancement by the aortic enhancement.
The signal intensity on T2 weighted images was defined in relation to muscle and water. Low signal intensity was less than or equivalent to that of muscle, intermediate signal intensity was greater than that of muscle but less than that of water, and high signal intensity was greater than or equal to that of water. If a lesion had mixed signal intensity but had a significant proportion of high signal intensity (>50%), it was considered of high signal intensity.
Statistical analysis
Statistical analysis was conducted using Stata SE v.10.1 for Macintosh (StataCorp LP, College Station, TX). Desmoid tumour size is described as median and range; these were compared using the Mann–Whitney U-test. Contrast enhancement ratios obtained by the two modalities were reported as mean value and standard deviation (SD). These proportions were compared using Student's t-test following test of normality. A p-value <0.05 was considered statistically significant. Desmoids were stratified into two groups based on signal intensity on T2 weighted images: those with high signal intensity and those with low or intermediate signal intensity. The mean MRI contrast enhancement ratio between these two groups was also compared using Student's t-test.
Results
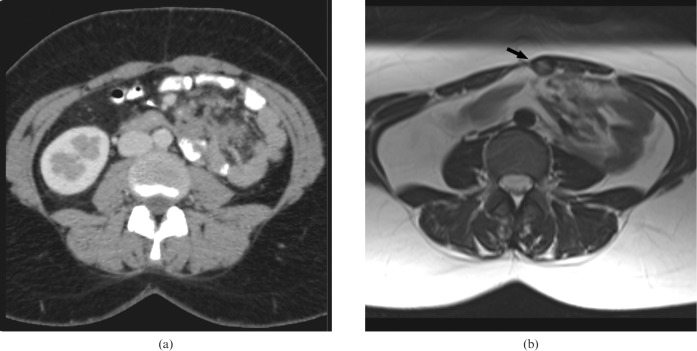
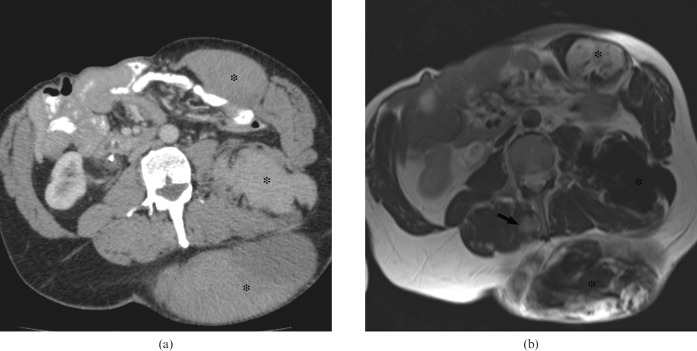
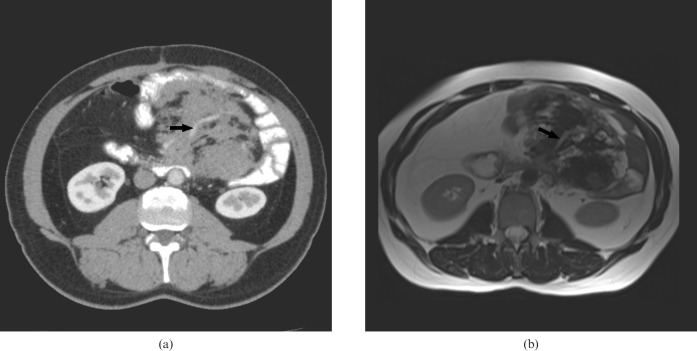
Nine patients with FAP and desmoid disease underwent MDCT and MRI within 1 month of each other. The demographic details of the included patients are described in Table 3; 23 desmoids (9 IAD, 10 AWD and 4 EAD) were identified on MRI; 21 desmoids (9 IAD, 9 AWD and 3 EAD) were identified on MDCT. MRI identified two additional desmoids, one AWD and one EAD, which were not easily detected even on retrospective review of MDCT (Figures 1 and 2). For the 21 lesions seen on both modalities, there was concordance with regard to desmoid size, site and extent of local infiltration margin. The contrast enhancement ratio for MRI was significantly greater than for MDCT. Table 4 summarises the results of comparison between the two modalities.
Table 3. Demographics of included patients.
| Patient | Age at desmoid diagnosis (years) | Gender | APC mutation (codon) | Surgery for FAP |
| 1 | 26 | F | 1392 | IRA |
| 2 | 43 | M | 1465 | RPC |
| 3 | 50 | M | 1551 | RPC |
| 4 | 22 | M | 1556 | IRA |
| 5 | 34 | M | 1551 | RPC |
| 6 | 24 | F | 1509 | RPC |
| 7 | 32 | F | 1182 | IRA |
| 8 | 24 | F | 213 | IRA |
| 9 | 31 | F | 1444 | IRA |
F, female; FAP, familial adenomatous polyposis; IRA, colectomy and ileorectal anastomosis; M, male; RPC, restorative proctocolectomy.
Figure 1.
A 31-year-old female with familial adenomatous polyposis. (a) Contrast-enhanced CT and (b) corresponding T2 weighted MRI of a 3 cm abdominal wall desmoid. This lesion was detected on MRI (arrow) but not on CT.
Figure 2.
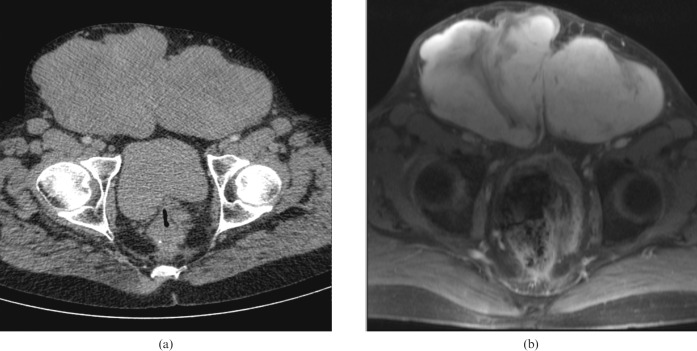
A 50-year-old male with familial adenomatous polyposis. (a) Contrast-enhanced CT and (b) T2 weighted MRI demonstrate multiple desmoid tumours (asterisks). The extra-abdominal desmoid shown on MRI (black arrow) is difficult to identify on CT.
Table 4. Summary of results.
| DT | Site | Size (cm2) |
Infiltration |
T2 signal | Enhancement ratio |
||||
| CT | MRI | Bowel | Ureter | SMA origin | CT | MRI | |||
| 1 | IA | 63 | 61 | Yes | Yes | No | Low | 0.47 | 0.75 |
| 2 | AW | 181 | 179 | High | 0.43 | 1.38 | |||
| 3 | IA | 79 | 81 | Yes | Yes | No | Low | 0.49 | 1.38 |
| 4 | IA | 11 | 10 | No | Yes | No | Low | 0.54 | 1.12 |
| 5 | EA | 215 | 215 | Low | 0.5 | 1.24 | |||
| 6 | AW | 28 | 27 | High | 0.48 | 1.81 | |||
| 7 | IA | 74 | 72 | Yes | Yes | No | Low | 0.49 | 0.75 |
| 8 | EA | 41 | 39 | Low | 0.79 | 0.33 | |||
| 9 | AW | 13 | 14 | Low | 0.69 | 0.99 | |||
| 10 | AW | 49 | 51 | High | 0.66 | 2.17 | |||
| 11 | IA | 85 | 84 | Yes | No | No | Low | 0.7 | 0.66 |
| 12 | EA | 15 | 14 | High | 0.53 | 0.87 | |||
| 13 | AW | 5 | 4 | Low | 0.67 | 1.11 | |||
| 14 | IA | 73 | 72 | No | No | No | Low | 0.43 | 1.66 |
| 15 | AW | 74 | 72 | No | Yes | No | High | 0.25 | 1.26 |
| 16 | AW | 5 | 7 | Intermediate | 0.38 | 1.07 | |||
| 17 | IA | 126 | 126 | No | No | No | Low | 0.37 | 0.88 |
| 18 | IA | 22 | 21 | Yes | No | No | Low | 0.25 | 0.91 |
| 19 | AW | 3 | 4 | Intermediate | 0.19 | 0.89 | |||
| 20 | IA | 26 | 27 | No | No | No | Low | 0.36 | 0.72 |
| 21 | AW | 2 | 3 | High | 0.38 | 1.55 | |||
| Median | 41 | 39 | Mean | 0.479 | 1.12 | ||||
| Range | 2–215 | 3–215 | Standard deviation | 0.159 | 0.432 | ||||
| p-valuea | 0.985 | p-valueb | <0.0001 | ||||||
AW, abdominal wall; DT, desmoid tumour; EA, extra-abdominal; IA, intra-abdominal; SMA, superior mesenteric artery; T2, T2 weighted MRI.
aMann–Whitney U-test.
bStudent's t-test.
Intra-abdominal desmoids
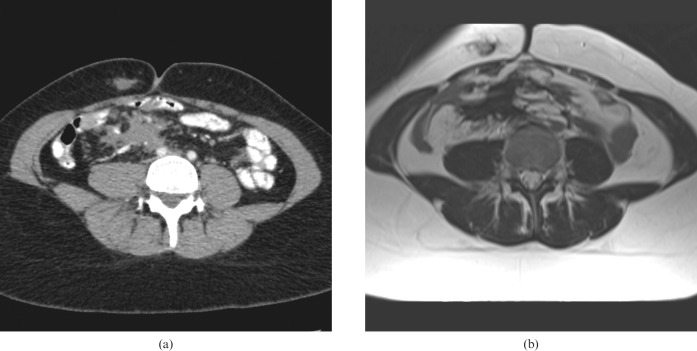
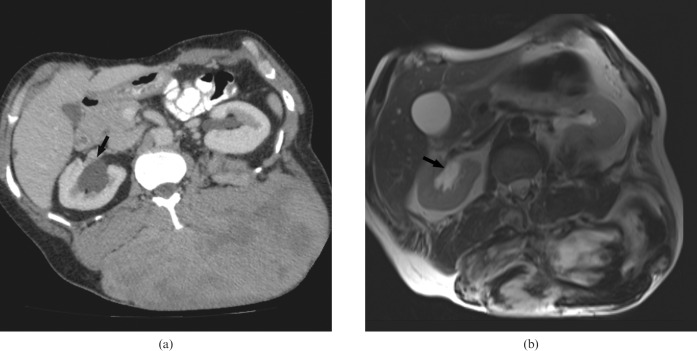
Nine IAD tumours were identified, all localised to the small bowel mesentery (Figure 3). There was consistency between the two modalities in the assessment of number, site and local extent of these mesenteric desmoids. Five IAD tumours involved the bowel; four resulted in extrinsic ureteric compression (Figure 4). While infiltration around mesenteric vessels was demonstrated on both scans (Figure 5), none compromised the proximal superior mesenteric artery. The median size of these IAD tumours was 73 cm2 (range 11–126 cm2) on MDCT and 72 cm2 (range 10–126 cm2) on MRI (p=0.98). For these IAD tumours, the mean contrast enhancement ratio for MRI (0.98; SD 0.34) was significantly greater than for MDCT (0.46; SD 0.13; p=0.0005). All nine IAD tumours had a low T2 signal intensity.
Figure 3.
A 24-year-old female with mesenteric and abdominal wall desmoid demonstrated on corresponding (a) CT and (b) T2 weighted MRI.
Figure 4.
A 50-year-old male with a large extra-abdominal desmoid. (a) Contrast-enhanced CT and (b) corresponding T2 weighted MRI show bilateral hydronephosis (black arrow) caused by a further pelvic desmoid, not seen in this view.
Figure 5.
A 55-year-old male with familial adenomatous polyposis. (a) Contrast-enhanced CT and (b) corresponding T2 weighted MRI shows an infiltrative mesenteric desmoid. Encasement of mesenteric vessel is clearly demonstrated (black arrow).
Abdominal wall desmoids
Nine AWD tumours were identified, with both MDCT and MRI agreeing on desmoid number, site and local extent. The size of these AWD tumours on MDCT (median 13 cm2, range 2–181 cm2) was equivalent to that on MRI (median 14 cm2, range 3–179 cm2; p=0.99). The contrast enhancement ratio on MRI (1.36; SD 0.42) was significantly greater than for MDCT (0.46; SD 0.18; p<0.0001; Figure 6). These AWD tumours displayed variable T2 signal intensity, as described in Table 4. MRI identified one extra AWD that was difficult to identify even on retrospective review of MDCT owing to its similar density to muscle (Figure 1).
Figure 6.
A 53-year-old male with large abdominal wall desmoid. (a) Contrast-enhanced CT and (b) corresponding contrast-enhanced T1 weighted MRI demonstrate higher contrast enhancement on MRI than CT.
Extra-abdominal desmoids
Three EAD tumours were detected by MDCT. MRI identified these lesions and one additional EAD within the erector spinae muscle (Figure 2). For the three EAD tumours seen on both modalities, there was consistency regarding site and local infiltration. The size of these EAD tumours on MDCT (median 41 cm2, range 15–215 cm2) was equivalent to that on MRI (median 39 cm2, range 14–215 cm2; p=0.98). The contrast enhancement ratio of these EAD tumours on MRI (0.81; SD 0.46) was not significantly different from MDCT (0.61; SD 0.16; p=0.50). These EAD tumours had a range of T2 signal intensity as described in Table 4. The additional EAD tumours detected by MRI displayed high T2 signal intensity and was thus conspicuous (Figure 2).
T2 signal intensity and MRI contrast enhancement ratio
The comparison between MRI contrast enhancement ratio and signal intensity on T2 weighted images shows that the high signal intensity group had a significantly greater MRI contrast enhancement ratio than the low and intermediate group, at 1.51 (SD 0.45) and 0.96 (SD 0.32), respectively (p=0.006). Figure 7 displays the comparison between T2 signal intensity and MR enhancement ratio. The MRI contrast enhancement ratio across the three anatomical sites for desmoids was 0.97 (SD 0.39) for IAD, 1.54 (SD 0.40) for AWD and 0.79 (SD 0.46) for EAD. No significant difference was detected between these three groups.
Figure 7.
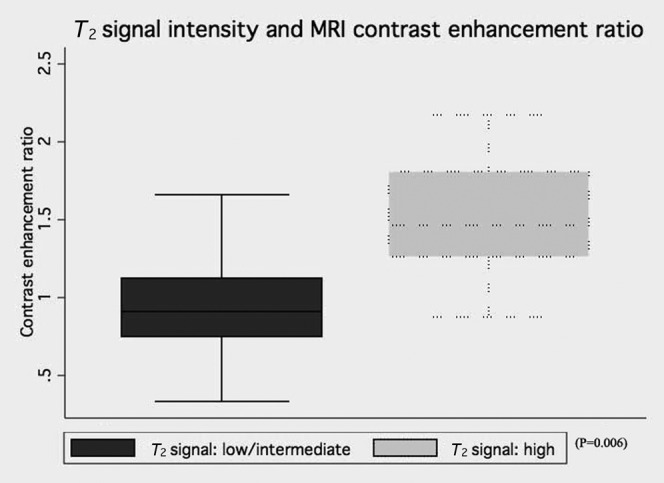
MRI contrast enhancement ratio between desmoids of low/intermediate T2 signal intensity and high T2 signal intensity.
Discussion
A previous study suggested CT was superior in detecting desmoids in patients with FAP [17]. Healy et al [17] detected 35 desmoids (22 IAD and 13 AWD) on CT compared with 34 desmoids (21 IAD and 13 AWD) on MRI, giving a detection rate of 97% on MRI; no EAD tumours were identified by either modality. In Healy et al’s study, there was one false-positive diagnosis (the pancreatic head was misdiagnosed as a desmoid on MRI) and one false-negative diagnosis (a desmoid was misdiagnosed as a loop of small bowel on MRI).
In our current study we detected 21 desmoids (9 IAD, 9 AWD and 3 EAD) on MDCT and 23 (9 IAD, 10 AWD and 4 EAD) on MRI, giving a detection rate of 110% on MRI. The two additional desmoids detected by MR, while small in size, were of high T2 signal and more conspicuous. There were no false-positive or false-negative diagnoses. Advances in MRI technology, including better spatial resolution (particularly when using breath-hold sequences), have enabled this superior detection rate. This is consistent with another study, where MRI was superior to CT in the assessment of soft-tissue tumours due to its superior soft-tissue contrast [12].
Unlike the study by Healy et al [17], where MRI was inferior to CT in delineating the extent of mesenteric desmoids, in our study both MDCT and MRI were equivalent in assessment of infiltrative extent of intra-abdominal desmoids, in particular small bowel and ureteric involvement. Both techniques were able to demonstrate disease around mesenteric vessels, but the superior mesenteric artery remained uncompromised in all patients, again reflecting improvements in MRI technology since Healy et al conducted their study.
Healy et al [17] also suggested that high signal intensity on T2 weighted images might be useful in identifying aggressive desmoids. In our study, high signal intensity on T2 weighted images was associated with a significantly higher MRI enhancement ratio (in comparison with low/intermediate signal intensity group), suggesting that this may reflect greater cellularity and vascularisation of potentially aggressive desmoid tumours. The potential for signal intensity and MRI enhancement ratio as a surrogate for desmoid growth warrants further exploration. Nevertheless, it should be borne in mind that this remains controversial, as another study of aggressive fibromatosis [16] has been unable to predict desmoid behaviour based on the MRI signal alone. However, this previous study combined sporadic and FAP-associated desmoids, which are biologically distinct entities [5].
A limitation of this study is that only a small number of patients were included; however, this was a prospective study and FAP-associated desmoids are rare. In addition, the interpretation of both MDCT and MRI is highly dependent on reader expertise, but both readers in this study were experienced gastrointestinal radiologists at a tertiary FAP centre.
The MRI examination time was approximately 25 min, which is longer than CT but was well tolerated by the study patients. Generally, young patients are able to manage the breath-holds required for MRI without difficulty. However, it can be a problem for some, resulting in reduced accuracy of MRI compared with CT in the assessment of intra-abdominal relationships. No patient declined MRI and no one suffered claustrophobia.
FAP patients with IAD tumours require periodic imaging to assess the disease status, to evaluate symptoms and to exclude complications of desmoid disease. Current practice using CT potentially incurs a heavy radiation burden, given the effective dose of 10 mSv per examination for abdominal pelvic CT. These patients are usually young. Hence, MRI is an attractive prospect owing to its lack of radiation.
In summary, this study has shown that MRI is at least equivalent to (and may be superior to) MDCT in the detection of desmoid tumours in patients with FAP, and supports the use of a modern MRI protocol for assessing desmoids in patients with FAP.
Acknowledgments
The authors are grateful to the Polyposis Registry for aiding with patient recruitment, and to Mr J Stirling and Mr I Simcock for their assistance with image collection.
Footnotes
This study was funded by the St Mark's Foundation.
References
- 1.Vasen HF, Möslein G, Alonso A, Aretz S, Bernstein I, Bertario L, et al. Guidelines for the clinical management of familial adenomatous polyposis (FAP). Gut 2008;57:704–13 [DOI] [PubMed] [Google Scholar]
- 2.Bulow S. Results of national registration of familial adenomatous polyposis. Gut 2003;52:742–6 [DOI] [PMC free article] [PubMed] [Google Scholar]
- 3.Heiskanen I, Luostarinen T, Järvinen HJ. Impact of screening examinations on survival in familial adenomatous polyposis. Scand J Gastroenterol 2000;35:1284–7 [DOI] [PubMed] [Google Scholar]
- 4.Sturt NJ, Clark SK. Current ideas in desmoid tumours. Fam Cancer 2006;5:275–85 [DOI] [PubMed] [Google Scholar]
- 5.Sturt NJ, Gallagher MC, Bassett P, Philp CR, Neale KF, Tomlinson IP, et al. Evidence for genetic predisposition to desmoid tumours in familial adenomatous polyposis independent of the germline APC mutation. Gut 2004;53:1832–6 [DOI] [PMC free article] [PubMed] [Google Scholar]
- 6.Sinha A, Tekkis PP, Neale KF, Phillips RK, Clark SK. Risk factors predicting intra-abdominal desmoids in familial adenomatous polyposis: a single centre experience. Tech Coloproctol 2010;14:141–6 [DOI] [PubMed] [Google Scholar]
- 7.Church J, Lynch C, Neary P, LaGuardia L, Elayi E. A desmoid tumor-staging system separates patients with intra-abdominal, familial adenomatous polyposis-associated desmoid disease by behaviour and prognosis. Dis Colon Rectum 2008;51:897–901 [DOI] [PubMed] [Google Scholar]
- 8.Sinha A, Gibbons DC, Phillips RK, Clark S. Surgical prophylaxis in familial adenomatous polyposis: do pre-existing desmoids outside the abdominal cavity matter? Fam Cancer 2010;9:407–11 [DOI] [PubMed] [Google Scholar]
- 9.Clark SK, Neale KF, Landgrebe JC, Phillips RK. Desmoid tumours complicating familial adenomatous polyposis. Br J Surgery 1999;86:1185–9 [DOI] [PubMed] [Google Scholar]
- 10.Middleton SB, Phillips RK. Surgery for large intra-abdominal desmoid tumors: report of four cases. Dis Colon Rectum 2000;43:1759–62 [DOI] [PubMed] [Google Scholar]
- 11.Magid D, Fishman EK, Jones B, Hoover HC, Feinstein R, Siegelman SS. Desmoid tumours in Gardner syndrome: use of computed tomography. AJR Am J Roentgenol 1984;142:1141–5 [DOI] [PubMed] [Google Scholar]
- 12.Tuncbilek T, Karakas HM, Okten OO. Dynamic contrast enhanced MRI in the differential diagnosis of soft tissue tumors. Eur J Radiol 2005;53:500–5 [DOI] [PubMed] [Google Scholar]
- 13.Souza FF, Fennessy FM, Yang Q, van denAbbeele AD. PET/CT appearance of desmoid tumour of the chest wall. Br J Radiol 2010;83:E39–42 [DOI] [PMC free article] [PubMed] [Google Scholar]
- 14.O'Keefe FE, Kim E, Wallace S. Magnetic resonance imaging in aggressive fibromatosis. Clin Radiol 1990;42:170–3 [DOI] [PubMed] [Google Scholar]
- 15.Chummun S, McLean NR, Abraham S, Youseff M. Desmoid tumour of the breast. J Plast Reconstr Aesthet Surg 2010;63:339–45 [DOI] [PubMed] [Google Scholar]
- 16.Castellazzi G, Vanel D, Le Cesne A, Le Pechoux C, Caillet H, Perona F, et al. Can the MRI signal of aggressive fibromatosis be used to predict its behavior? Eur J Radiol 2008;69:222–6 [DOI] [PubMed] [Google Scholar]
- 17.Healy JC, Reznek RH, Clark SK, Phillips RK, Armstrong P. MR appearances of desmoids tumors in familial adenomatous polyposis. AJR Am J Roentgenol 1997;169:465–72 [DOI] [PubMed] [Google Scholar]


