

Abstract
Objective
To investigate the diagnostic performance of 18F-fludeoxyglucose (18F-FDG) positron emission tomography (PET)/CT in patients with suspected large-vessel vasculitis and its potential to evaluate the extent and activity of disease.
Methods
78 consecutive patients (mean age 63 years; 53 females) with suspected large-vessel vasculitis were evaluated with 18F-FDG PET/CT. 18F-FDG uptake in the aorta and major branches was visually graded using a four-point scale and quantified with standardised uptake values (SUVmax). According to clinical diagnosis, patients were classified into three groups: (a) steroid-naïve, large-vessel vasculitis (16 patients), (b) vasculitis on steroid treatment (18 patients) and (c) no evidence of vasculitis (44 patients). Analysis of variance and linear regression were used to investigate the association of 18F-FDG uptake with clinical diagnosis and inflammatory markers.
Results
18F-FDG PET/CT was positive (visual uptake ≥2; equal to or greater than liver) in all patients with steroid-naïve, large-vessel vasculitis. The thoracic aorta, the carotid and the subclavian arteries were most frequently involved. In these patients, SUVmax values were significantly higher than in the other groups (analysis of variance; p<0.05). Linear regression showed a significant positive association (b-coefficients: 0.018–0.02; p<0.05) between SUVmax of the thoracic aorta and inflammatory markers in patients with vasculitis (Groups a and b). Patients on steroid treatment showed low visual scores (uptake <2) and significantly lower SUVmax values than steroid-naïve patients.
Conclusion
18F-FDG PET/CT can detect the extent and activity of large-vessel vasculitis in untreated patients and is unreliable in diagnosing vasculitis in patients on steroids.
Timely and accurate diagnosis of large-vessel vasculitis, either giant cell arteritis (GCA) or Takayasu arteritis (TA), and evaluation of its extent and activity are challenging, since a significant proportion of patients present with atypical disease features. Temporal artery biopsy is the mainstay in the diagnostic work-up of GCA [1]; however, it is invasive, it can be false negative in a substantial number of cases [2] and it does not delineate the extracranial component of the disease. The proposed diagnostic criteria for GCA, including age, headache, temporal artery histology and erythrocyte sedimentation rate (ESR) levels [3], were designed to differentiate GCA from other large-vessel vasculitides and are not accurate to direct diagnosis in individual subjects. TA is a progressive vasculitis primarily affecting the aorta and its major branches, leading to segmental stenosis, occlusion, dilatation and formation of aneurysms. CT and MR angiography may detect inflammatory vessel wall changes, such as oedema and mural enhancement, even when conventional angiography is negative, yet they do not optimally correlate with disease activity [4]. Inflammatory markers are routinely included in the diagnostic tests for vasculitides; however, they are not specific and not always concordant with disease clinical activity, especially in cases of TA [1,5,6].
A decade ago 18F-fludeoxyglucose (18F-FDG) positron emission tomography (PET) was introduced in the evaluation of large-vessel vasculitis [7]. 18F-FDG accumulates in activated inflammatory cells owing to the overexpression of glucose transporters and the overproduction of glycolytic enzymes [8]. This has been the basis for the application of 18F-FDG PET in vasculitis, where there is avid leukocytic infiltration of the vessel wall with corresponding reactive damage to regional tissues. It has been postulated that 18F-FDG PET may have superior sensitivity for the detection of vasculitis in an early stage because of its ability to identify tissue metabolism changes in pathological processes, before structural changes occur and become detectable by conventional imaging modalities. Yet the accuracy of this technique has not been defined, nor has its exact clinical role been established with respect to initial diagnosis, evaluation of the response to therapy, monitoring of disease activity or follow-up. The 18F-FDG PET studies that have been performed demonstrate notable variability regarding the diagnostic criteria (visual scoring systems for 18F-FDG uptake, semi-quantitative standardised uptake values (SUVs) and target to background ratios) [9-12] used for differentiation between affected and unaffected vessels and for assessment of disease activity.
The purpose of our study was to evaluate whether 18F-FDG PET/CT could identify the distribution of vascular inflammation and facilitate the diagnosis of large-vessel vasculitis in patients with clinical suspicion of the disease. We also investigated the confounding effect of steroid treatment on 18F-FDG PET/CT imaging results and checked for any association of 18F-FDG PET/CT parameters with parameters of disease activity (inflammatory marker levels).
Methods and materials
Patients
Between January 2008 and December 2008 we performed a retrospective review of patients who had been referred for 18F-FDG PET/CT with suspicion of large-vessel vasculitis. We included cases with fever of unknown origin, or unexplained raised inflammatory markers, or any suspicious clinical signs and symptoms that would suggest large-vessel vasculitis in the differential. In each patient, presence or absence of large-vessel vasculitis was confirmed or excluded by case-based work-up, including assessment of clinical signs and symptoms, serial measurements of inflammatory marker levels [ESR, C-reactive protein (CRP)] over time, biopsies, other imaging modalities (duplex sonography, CT, MR or conventional angiography) and evaluation of response to corticosteroid treatment (if given). The clinician’s decision was used to classify a patient as a case of large-vessel vasculitis or not. A minimum of 6 months of clinical follow-up after 18F-FDG PET/CT imaging was considered sufficient to establish or exclude such a diagnosis. Patients with insufficient data for a clinical decision or those lost to follow-up were excluded from further analysis.
78 patients [53 females, 25 males; mean age (±SD) 63±13 years] were included in the study. GCA was finally diagnosed in 22 patients, TA in 1 and polymyalgia rheumatica (PMR) in 11. In the remaining 44 patients a diagnosis of large-vessel vasculitis was excluded; these cases included various aetiologies (autoimmune diseases, infections, neuropathies, malignancies etc.).
The patients were further divided into 3 groups:
16 patients with active large-vessel vasculitis (15 patients with GCA and 1 patient with TA) who had not received any corticosteroid treatment prior to 18F-FDG PET/CT imaging
18 patients with large-vessel vasculitis who were already on corticosteroid treatment at imaging time: 7 patients with GCA and 11 patients with PMR
44 patients in whom the existence of large-vessel vasculitis was ultimately excluded.
In order to investigate any association between 18F-FDG PET/CT imaging results and disease activity parameters, inflammatory marker levels (CRP, ESR) and full blood count were recorded as long as they were obtained no more than 1 week before 18F-FDG PET/CT imaging.
18F-FDG PET/CT imaging protocol
18F-FDG PET/CT studies were performed using a dedicated combined GE Discovery PET/CT scanner (GE Healthcare, Chalfont St Giles, UK). The PET scanner contains bismuth germanate (BGO) detectors and reconstructs 35 axial images at 4.25 mm intervals with a field of view of approximately 15 cm. Whole-body acquisitions (mid-brain to mid-thigh) were performed in two-dimensional (2D) mode with the use of five or six bed positions and with the patient in the supine position. Patients fasted for a minimum of 6 h prior to the injection of 370–550 MBq 18F-FDG; the blood glucose level was checked in all patients and was <9 mg dl–1. Images were acquired from 55 to 65 min post injection [13].
CT data were acquired using the four 3.75 mm detectors, a pitch of 1.5 and a 5 mm collimation. The CT exposure factors for all examinations were 120–140 kVp and 80 mAs. A separate data set of thoracic CT images was reconstructed with an appropriate algorithm for lung imaging. Maintaining patient position, a whole-body PET emission scan was performed covering an area identical to that covered by CT. PET images were reconstructed using CT for attenuation correction. Transaxial PET emission images of 4.3×4.3×4.25 mm3 were reconstructed using ordered subsets expectation maximisation with 2 iterations and 28 subsets.
Image analysis
Images were reviewed by two nuclear medicine physicians, in consensus, who were blinded to clinical and laboratory data and the final clinical diagnosis. For each patient 18F-FDG vascular uptake was recorded in six arterial compartments: thoracic and abdominal aorta, and iliac, femoral, carotid and subclavian arteries. 18F-FDG uptake was evaluated visually and quantitatively. In accordance with previous relevant studies [5,9,10,14], a visual score was assigned to each arterial segment using a four-point scale: 0, no uptake present; 1, minimal but not negligible uptake, certainly less than liver uptake; 2, intermediate uptake similar to liver uptake; 3, high-grade intense uptake higher than liver activity. 18F-FDG vascular uptake scores ≥2 (equal to or higher than liver uptake) were considered “positive” for vasculitis and scores of 0 and 1 (less than liver uptake) were considered “negative”.
Semi-quantitative indices (SUVs) of the uptake of 18F-FDG were calculated for each vascular segment. SUVs were calculated according to the formula
 |
where Ql is the activity in the region of interest in mCi ml–1; Qinj is the activity injected in mCi; and BW is the patient’s body weight in grams. We manually applied regions of interest (ROIs) around the vessel wall in the transaxial attenuation-corrected PET slices and recorded the corresponding maximum SUV (SUVmax). Fused PET/CT images enabled appropriate ROI placement within the vessel and exclusion of adjacent structures. In order to obtain representative SUVmax segmental values, we acquired at least four measures in each arterial compartment and averaged those numbers. In the case of the thoracic aorta, four measures were obtained in each of three distinct segments: ascending aorta, arch and descending aorta (total of 3×4=12 SUVmax values).
Statistical analysis
We compared the visual vascular 18F-FDG uptake scores and the semi-quantitative SUVmax values (one-way analysis of variance with the Bonferroni corrections) across the three groups. Spearman’s correlation coefficients were calculated for the association between SUVmax values and visual scoring. The regional segmental pattern of 18F-FDG uptake in the vascular bed of each group was identified. We investigated for the association between 18F-FDG uptake and laboratory parameters in affected patients. Sufficient data were available for 28 patients of Groups a and b. Univariable linear regression analysis was performed using the SUVmax of the thoracic aorta as a dependent variable and age, CRP, ESR and blood count values as independent variables. The selection of the thoracic aorta as the vessel of interest was supported by previous evidence in this field, which identified this as the most frequently involved vascular territory in patients with large-vessel vasculitis. In order to check whether any of these factors was independently statistically significant, they were introduced in a multivariable regression model and backwards stepwise regression analysis was performed.
Results
18F-FDG PET/CT was positive (visual uptake ≥2 in the thoracic aorta and/or its tributaries, the carotid and subclavian arteries) in all (16/78) patients finally diagnosed with active, steroid-naïve, large-vessel vasculitis (15 cases of GCA and 1 case of TA) at the time of imaging (Table 1). SUVmax values in these patients were significantly higher than those in the other groups (Figure 1, Table 2). The thoracic aorta and the its major branches, the carotid and the subclavian arteries, were most frequently involved, followed by the abdominal aorta (Table 3). There was good correlation between quantitative SUVmax values and visual scores in the whole study group (Spearman’s correlation coefficient values were in the range 0.65–0.85; p<0.05). The 18 patients who were already on steroid treatment at imaging showed significantly lower SUVmax values and lower visual scores (<2) than the steroid-naïve vasculitis patients (Tables 1 and 2, Figure 1). In the “no vasculitis” group, the femoral arteries were the more frequently visualised vessels (low-grade uptake=1 in 18/44 subjects).
Table 1. Visual scores of the thoracic aorta and/or its major branches, across study groups.
| Vessel scores | Active vasculitis (steroid-naïve) | Vasculitis on steroids (GCA, PMR) | No vasculitis subjects |
| 0 | 0 | 12 (66.7%) | 34 (77.3%) |
| 1 | 0 | 6 (33.3%) | 10 (22.7%) |
| 2 | 3 (18.7%) | 0 | 0 |
| 3 | 13 (81.3%) | 0 | 0 |
GCA, giant cell arteritis; PMR, polymyalgia rheumatica.
For each patient the highest score observed in the thoracic aorta, the carotids or the subclavians is presented. Percentages, within brackets, refer to relative frequencies within each group.
Figure 1.

Box-plots of the maximun standardised uptake values (SUVmax)of the thoracic aorta across the three study groups: (a) active (steroid-naïve) large-vessel vasculitis, (b) steroid-treated [giant cell arteritis (GCA) and polymyalgia rheumatica (PMR)] vasculitis and (c) no vasculitis patients. Analysis of variance comparisons with the Bonferroni corrections showed statistically significant differences in SUVmax values between the steroid-naïve vasculitis group and the no vasculitis group (p<0.001) and between the steroid treated group and the no vasculitis group (p=0.009).
Table 2. Maximun standardised uptake values (mean±SD) in the vascular compartments of the three study groups.
| Vessel | Active vasculitis (steroid-naïve) | Vasculitis on steroids (GCA, PMR) | No vasculitis subjects |
| Thoracic aorta | 3.38±0.99a** | 2.32±0.39* | 1.77±0.24 |
| Abdominal aorta | 3.26±0.76a** | 2.26±0.53* | 1.81±0.27 |
| Iliacs | 2.43±0.82a** | 1.77±0.32 (NS) | 1.49±0.28 |
| Femorals | 2.01±0.83* | 1.99±0.36* | 1.43±0.29 |
| Carotids | 3.40±0.74a** | 1.79±0.39 (NS) | 1.37±0.32 |
| Subclavians | 3.40±1.42a** | 1.34±0.28 (NS) | 1.10±0.26 |
GCA, giant cell arteritis; PMR, polymyalgia rheumatica; SD, standard deviation.
Symbols (*, **, NS) indicate the p-value of the analysis of variance comparisons with the Bonferroni corrections between groups “steroid-naïve vasculitis” and “vasculitis on steroids” and the group “no vasculitis” (reference group): *statistically significant at a level <0.05; **statistically significant at a level <0.001; NS, non-significant difference.
aIndicates whether there was a statistically significant difference at p<0.05 between “steroid-naïve vasculitis” and “vasculitis on steroids” groups.
Table 3. Distribution of visual vessel scores in the 16 patients with active, non-steroid-treated vasculitis.
| Score |
||||
| Vessel | 0 | 1 | 2 | 3 |
| Thoracic aorta and major branches | 0 | 0 | 3 | 13 |
| Abdominal aorta | 2 | 1 | 6 | 7 |
| Femorals | 5 | 3 | 6 | 2 |
Univariable linear regression analysis demonstrated a statistically significant association between SUVmax of the thoracic aorta and age, CRP, ESR and haemoglobin (Hb) levels (Table 4). There was no significant relation between SUVmax and platelet or white cell count (p-values of 0.22 and 0.69, respectively). According to these results, higher SUVmax values were associated with higher patient age, higher inflammatory marker levels (CRP and ESR) and lower Hb levels. Age and ESR levels remained statistically significant (p<0.05) and independent factors, even when all these parameters were introduced into a multivariable regression model and backwards stepwise regression was performed (Table 4).
Table 4. Results of univariable and multivariable linear regression analyses.
| Variable | b-coefficient (95% CI) | p-value |
| Univariable linear regression | ||
| Age | 0.015 (0.010, 0.046) | 0.04 |
| CRP | 0.018 (0.006, 0.028) | 0.003 |
| ESR | 0.020 (0.010, 0.029) | <0.001 |
| Hb | −0.34 (−0.65, −0.04) | 0.03 |
| Multivariable linear regression | ||
| Age | 0.033 (0, 0.066 ) | 0.05 |
| ESR | 0.022 (0.013, 0.030 ) | <0.001 |
We used maximum standardised uptake values (SUVmax) of the thoracic aorta as the dependent variable and age, C-reactive protein (CRP), erythrocyte sedimentation rate (ESR) and haemoglobin (Hb) values as independent variables, in patients with vasculitis (non- and steroid treated). Age and ESR were the independent variables, which remained statistically significant (p<0.05) at backwards stepwise regression. The b-coefficient, its 95% confidence intervals (CIs) and the corresponding p-value are presented.
Discussion
In this study, 18F-FDG PET/CT correctly identified active large-vessel vasculitis in untreated (steroid-naïve) patients. A pattern of high-grade (equal to or higher than liver activity) 18F-FDG uptake in the vessel wall of the thoracic aorta and/or its major branches (carotid and subclavian arteries) was observed in these patients (Tables 1 and 3, Figure 2). This is in accordance with a recent study which, by applying receiver operator curve analysis in GCA patients and healthy control subjects, calculated an aortic wall/liver 18F-FDG uptake ratio of >1.00 to be highly sensitive (89%) and specific (95%) for diagnosing vasculitis [12]. In the series of Walter et al [9], who applied a similar scoring system to our study, a vessel score ≥2 was not found to be sensitive (60%) but still demonstrated high specificity (99%). However, 70% of the scans in Walter et al’s study were performed under glucocorticosteroid treatment, which suppresses inflammatory vessel wall 18F-FDG uptake. This would explain why most of Walter et al’s positive scans had a visual score of 2, whereas our study more frequently showed a score of 3 in the thoracic aorta and/or its major branches in affected patients.
Figure 2.
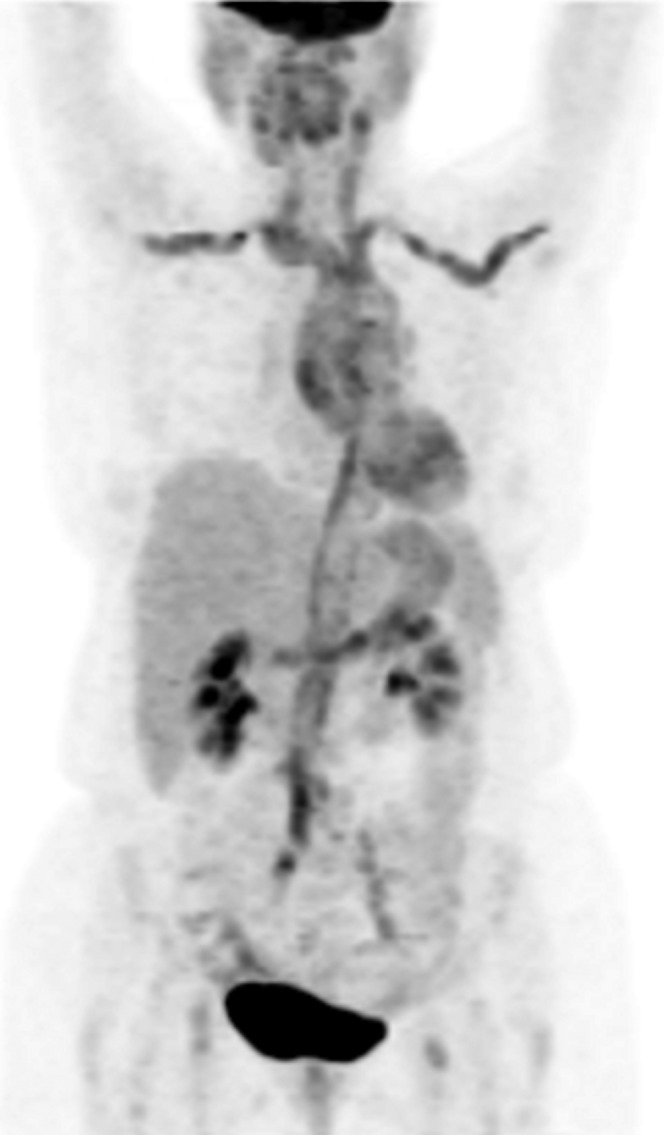
18F-Fludeoxyglucose (18F-FDG) positron emission tomography/CT (MIP image) in a 73-year-old female with giant cell arteritis at initial diagnosis. She presented with fever, malaise and increased inflammatory marker levels [erythrocyte sedimentation rate (ESR) 108, C-reactive protein (CRP) 96 mg dl–1]. There is intense 18F-FDG activity along the wall of the thoracic aorta and its tributaries, the subclavian and carotid arteries, the abdominal aorta and the iliac arteries. The degree of uptake was graded as 3, >liver.
18F-FDG PET/CT was unreliable in evaluating patients with large-vessel vasculitis under steroid treatment. They showed low-grade (<2) vascular 18F-FDG uptake not appreciable on visual interpretation (Figure 3) and significantly lower SUVmax values than untreated patients. Aortic SUVmax values in steroid-treated patients were, however, significantly higher than those in the “no vasculitis” group (Table 2). It is unknown whether this 18F-FDG activity represents ongoing residual minimal inflammation despite corticosteroid suppression, or neo-vessel formation and vessel wall healing–remodelling, or both. Similarly, Both et al [15] found 18F-FDG PET inadequate for patients on immunosuppressive treatment, whereas in a small series (13 patients) of TA patients on steroids, low aortic SUVmax values (in the range of 1.20–2.50) were observed [11]. Unlike our results, the retrospective study of Lee et al [16] did not report a significant difference in vascular 18F-FDG uptake between patients with and without steroid treatment. This can be explained by differences in the clinical setting and population selection: Lee et al evaluated patients already diagnosed with TA only, in various clinical stages, with less than one-third of their population being under steroids/immunosuppressants. It could be argued that our vasculitis group under steroid treatment was inhomogeneous since it included both patients with PMR and patients with GCA; however, this is appropriate on clinical grounds, given that PMR and GCA are associated and are suggested to be different manifestations of the same disease process [1].
Figure 3.
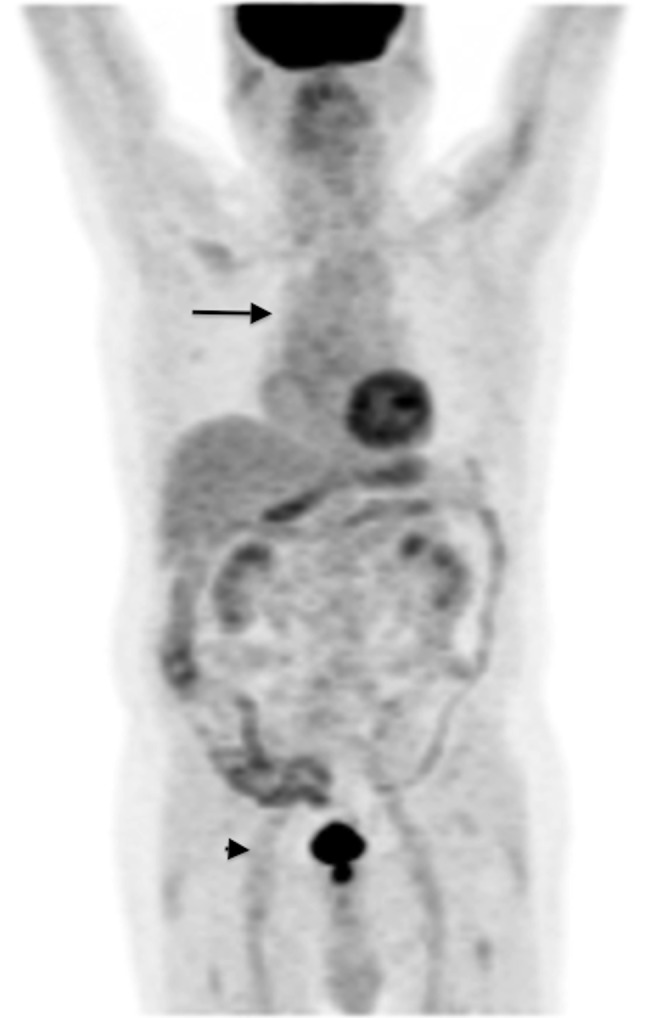
18F-Fludeoxyglucose (18F-FDG) positron emission tomography (PET)/CT (MIP image) in a 72-year-old male with giant cell arteritis, under long-term steroid treatment. There is some (Grade 1, <liver) 18F-FDG activity in the wall of the ascending aorta and the aortic arch (arrow). There is low-grade uptake in the iliofemoral vessels (arrowhead), which is a normal variant and is not related to large-vessel vasculitis. 18F-FDG PET/CT is not accurate for the evaluation of patients on corticosteroids.
In our study, SUVmax values of patients with vasculitis were positively associated with inflammatory marker levels (ESR, CRP) (Table 4), supporting the assumption that 18F-FDG activity mirrors disease activity. The pathophysiology of large-vessel vasculitis comprises a vivid inflammatory cascade with T-cell and activated macrophage recruitment and accumulation in the vessel wall [1]. Avid utilisation of glucose and glucose analogues, such as 18F-FDG, by these cells could subsequently represent the degree of inflammation. However, there is conflicting literature on this issue; some studies have shown significant correlation of 18F-FDG uptake with raised inflammatory marker levels, similar to our results [9,10,17], while other studies have failed to show this correlation [5,15]. In two recent reviews, there was no consensus whether 18F-FDG PET/CT can be reliably used [18] or not [19] to monitor treatment response and disease activity.
Vascular 18F-FDG uptake is not specific for vasculitis, but can be observed in cases of atherosclerosis. Experimental and animal models have identified 18F-FDG concentration within vulnerable atherosclerotic plaques [20,21] and a human study reported a positive correlation of aortic 18F-FDG uptake with age, which is a major factor for atherosclerosis progression [22]. Evaluating the intensity and distribution pattern of vascular uptake we can differentiate active vasculitis from atherosclerotic lesions. We have observed a pattern of relatively linear and intense (≥liver) 18F-FDG uptake in the vessel wall of the thoracic aorta and its tributaries, the carotid and subclavian arteries, in cases of active, untreated vasculitis. In atherosclerosis vascular uptake has been described as “patchy”: non-linear and less intense (less than or, rarely, equal to liver activity) [4]. We have frequently seen a pattern of low-grade (=1, less than liver) 18F-FDG accumulation in the femoral vessels of the no vasculitis group (Figure 4). This has been suggested to correspond to smooth muscle activity and local atherosclerotic changes (intima layer thickening and macrophage accumulation); it should be regarded as a normal variant and not misinterpreted as vasculitis.
Figure 4.
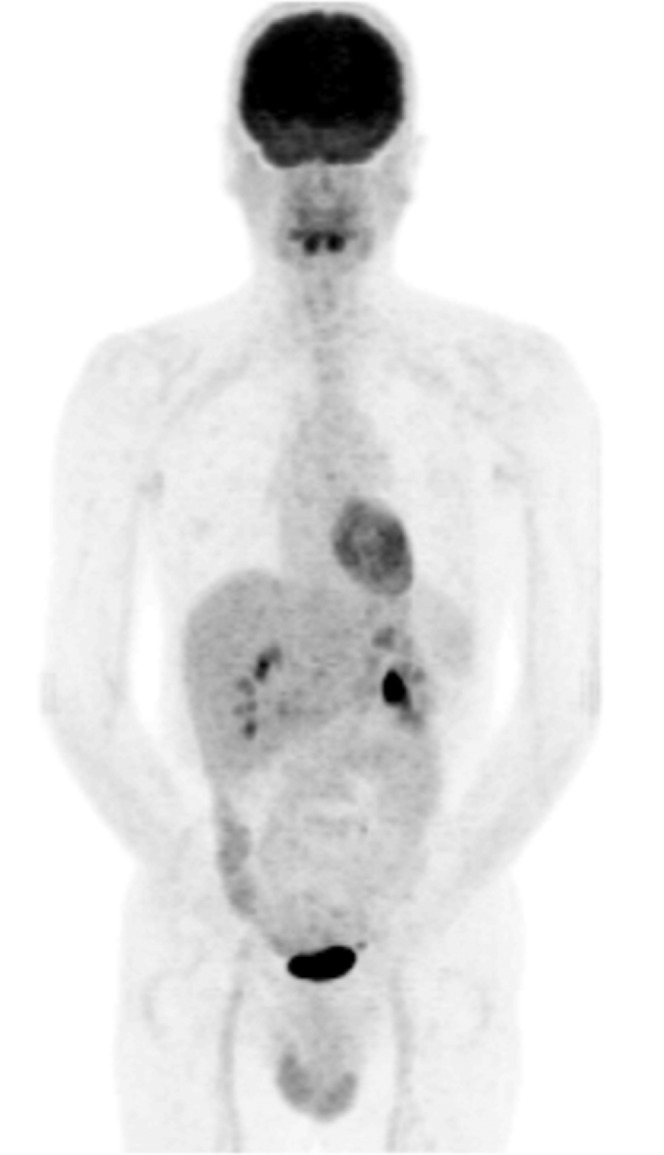
18F-Fludeoxyglucose (18F-FDG) positron emission tomography/CT (MIP image) in a 45-year-old patient of the “no vasculitis group”, diagnosed later as multiple sclerosis. There is negligible 18F-FDG uptake in the thoracic aorta, which was graded 0. There is mild Grade 1 18F-FDG activity in the femoral vessels, which is a frequently encountered normal variant and was observed in 40.9% of subjects in this group.
The main limitation of our study is its retrospective nature. The retrospective data precluded a valid comparison of 18F-FDG PET/CT with other imaging modalities (e.g. duplex sonography), within a reasonable time-frame. Owing to the referral bias we did not acquire sufficient data for patients with TA (only one patient).
Conclusion
Our results suggest a clinical role for 18F-FDG PET/CT as an additional tool in the early diagnosis of large-vessel vasculitis, before steroid treatment is given. 18F-FDG PET/CT has inadequate resolution to evaluate the temporal arteries [23] but it can delineate the extracranial distribution of GCA, mainly in the thoracic aorta, the carotid and the subclavian arteries. 18F-FDG-PET/CT can be a second approach in untreated patients with atypical presentations of GCA and equivocal ultrasound or temporal artery biopsy findings. Positive 18F-FDG-PET/CT scan results in patients with PMR symptomatology warrant further classification of them as having GCA and not being labelled as “isolated PMR”. This is clinically significant since GCA patients with aortic involvement are prone to aneurysm formation and should be monitored carefully [14]. 18F-FDG PET/CT cannot be used to diagnose vasculitis in patients on steroids/immunosuppressants and there is not enough evidence to support its use as a surrogate marker of disease activity, during follow-up.
Acknowledgments
The department in which this work was undertaken received a proportion of funding from the UK’s Department of Health’s NIHR Biomedical Research Centres funding scheme and the KCL/UCL CCIC. The authors would like to thank Xanthi Pedeli, biostatistician, University of Athens Medical School, Greece, for her statistical advice.
References
- 1.Salvarani C, Cantini F, Hunder GG. Polymyalgia rheumatica and giant-cell arteritis. Lancet 2008;372:234–45 [DOI] [PubMed] [Google Scholar]
- 2.Chong EW, Robertson AJ. Is temporal artery biopsy a worthwhile procedure? ANZ J Surg 2005;75:388–91 [DOI] [PubMed] [Google Scholar]
- 3.Hunder GG, Bloch DA, Michel BA, Stevens MB, Arend WP, Calabrese LH, et al. The American College of Rheumatology 1990 criteria for the classification of giant cell arteritis. Arthritis Rheum 1990;33:1122–8 [DOI] [PubMed] [Google Scholar]
- 4.Pipitone N, Versari A, Salvarani C. Role of imaging studies in the diagnosis and follow-up of large-vessel vasculitis: an update. Rheumatology (Oxford) 2008;47:403–8 [DOI] [PubMed] [Google Scholar]
- 5.Arnaud L, Haroche J, Malek Z, Archambaud F, Gambotti L, Grimon G, et al. Is (18)F-fluorodeoxyglucose positron emission tomography scanning a reliable way to assess disease activity in Takayasu arteritis? Arthritis Rheum 2009;60:1193–200 [DOI] [PubMed] [Google Scholar]
- 6.Webb M, Chambers A, Al-Nahhas A, Mason JC, Maudlin L, Rahman L, et al. The role of 18F-FDG PET in characterising disease activity in Takayasu arteritis. Eur J Nucl Med Mol Imaging 2004;31:627–34 [DOI] [PubMed] [Google Scholar]
- 7.Blockmans D, Stroobants S, Maes A, Mortelmans L. Positron emission tomography in giant cell arteritis and polymyalgia rheumatica: evidence for inflammation of the aortic arch. Am J Med 2000;108:246–9 [DOI] [PubMed] [Google Scholar]
- 8.Meller J, Sahlmann CO, Gurocak O, Liersch T, Meller B. FDG-PET in patients with fever of unknown origin: the importance of diagnosing large vessel vasculitis. Q J Nucl Med Mol Imaging 2009;53:51–63 [PubMed] [Google Scholar]
- 9.Walter MA, Melzer RA, Schindler C, Muller-Brand J, Tyndall A, Nitzsche EU. The value of [18F]FDG-PET in the diagnosis of large-vessel vasculitis and the assessment of activity and extent of disease. Eur J Nucl Med Mol Imaging 2005;32:674–81 [DOI] [PubMed] [Google Scholar]
- 10.Blockmans D, de Ceuninck L, Vanderschueren S, Knockaert D, Mortelmans L, Bobbaers H. Repetitive 18F-fluorodeoxyglucose positron emission tomography in giant cell arteritis: a prospective study of 35 patients. Arthritis Rheum 2006;55:131–7 [DOI] [PubMed] [Google Scholar]
- 11.Kobayashi Y, Ishii K, Oda K, Nariai T, Tanaka Y, Ishiwata K, et al. Aortic wall inflammation due to Takayasu arteritis imaged with 18F-FDG PET coregistered with enhanced CT. J Nucl Med 2005;46:917–22 [PubMed] [Google Scholar]
- 12.Hautzel H, Sander O, Heinzel A, Schneider M, Muller HW. Assessment of large-vessel involvement in giant cell arteritis with 18F-FDG PET: introducing an ROC-analysis-based cutoff ratio. J Nucl Med 2008;49:1107–13 [DOI] [PubMed] [Google Scholar]
- 13.Menezes LJ, Kotze CW, Hutton BF, Endozo R, Dickson JC, Cullum I, et al. Vascular inflammation imaging with 18F-FDG PET/CT: when to image? J Nucl Med 2009;50:854–7 [DOI] [PubMed] [Google Scholar]
- 14.Blockmans D, Coudyzer W, Vanderschueren S, Stroobants S, Loeckx D, Heye S, et al. Relationship between fluorodeoxyglucose uptake in the large vessels and late aortic diameter in giant cell arteritis. Rheumatology (Oxford) 2008;47:1179–84 [DOI] [PubMed] [Google Scholar]
- 15.Both M, Ahmadi-Simab K, Reuter M, Dourvos O, Fritzer E, Ullrich S, et al. MRI and FDG-PET in the assessment of inflammatory aortic arch syndrome in complicated courses of giant cell arteritis. Ann Rheum Dis 2008;67:1030–3 [DOI] [PubMed] [Google Scholar]
- 16.Lee SG, Ryu JS, Kim HO, Oh JS, Kim YG, Lee CK, et al. Evaluation of disease activity using F-18 FDG PET-CT in patients with Takayasu arteritis. Clin Nucl Med 2009;34:749–52 [DOI] [PubMed] [Google Scholar]
- 17.Moosig F, Czech N, Mehl C, Henze E, Zeuner RA, Kneba M, et al. Correlation between 18-fluorodeoxyglucose accumulation in large vessels and serological markers of inflammation in polymyalgia rheumatica: a quantitative PET study. Ann Rheum Dis 2004;63:870–3 [DOI] [PMC free article] [PubMed] [Google Scholar]
- 18.Zerizer I, Tan K, Khan S, Barwick T, Marzola MC, Rubello D, et al. Role of FDG-PET and PET/CT in the diagnosis and management of vasculitis. Eur J Radiol 2010;73:504–9 [DOI] [PubMed] [Google Scholar]
- 19.Blockmans D, Bley T, Schmidt W. Imaging for large-vessel vasculitis. Curr Opin Rheumatol 2009;21:19–28 [DOI] [PubMed] [Google Scholar]
- 20.Ogawa M, Ishino S, Mukai T, Asano D, Teramoto N, Watabe H, et al. (18)F-FDG accumulation in atherosclerotic plaques: immunohistochemical and PET imaging study. J Nucl Med 2004;45:1245–50 [PubMed] [Google Scholar]
- 21.Tawakol A, Migrino RQ, Hoffmann U, Abbara S, Houser S, Gewirtz H, et al. Noninvasive in vivo measurement of vascular inflammation with F-18 fluorodeoxyglucose positron emission tomography. J Nucl Cardiol 2005;12:294–301 [DOI] [PubMed] [Google Scholar]
- 22.Bural GG, Torigian DA, Chamroonrat W, Houseni M, Chen W, Basu S, et al. FDG-PET is an effective imaging modality to detect and quantify age-related atherosclerosis in large arteries. Eur J Nucl Med Mol Imaging 2008;35:562–9 [DOI] [PubMed] [Google Scholar]
- 23.Brodmann M, Lipp RW, Passath A, Seinost G, Pabst E, Pilger E. The role of 2-18F-fluoro-2-deoxy-D-glucose positron emission tomography in the diagnosis of giant cell arteritis of the temporal arteries. Rheumatology (Oxford) 2004;43:241–2 [DOI] [PubMed] [Google Scholar]