Abstract
Objective
The aim was to evaluate the effects of diagnostic performance of diffusion-weighted (DW) MRI in the assessment of acute impairment of transplanted kidneys.
Methods
From January 2009 to January 2010, 49 patients with stable renal allograft function (Group 1) and 21 patients with acute graft impairment (Group 2) were included in the study. All patients were evaluated with coronal T2 weighted (T2W) and DW MRI of the kidney. Patients in Group 2 underwent graft biopsy to determine the underlying histopathological aetiology. Apparent diffusion coefficient (ADC) was calculated and the kidneys were studied for any areas of diffusion restriction. Two radiologists, who were blinded to the results of histopathology, independently interpreted the T2W and DW images.
Results
The histopathological diagnosis ofGroup 2 (21 patients) was acute cellular rejection (ACR) in 10, acute tubular necrosis (ATN) in 7 and immunosuppressive toxicity in 4 patients. ADC values in Group 1 were significantly higher compared with Group 2 (p<0.001), patients with ACR (p<0.001), patients with ATN (p<0.001) and patients with drug toxicity (p<0.001). Using 2×10⁻³ mm2 s−1 as a cut-off, there was no overlap between the ADC values of patients with normal graft function and those with ATN. Both ACR and ATN had a low ADC value, but on the ADC map the kidney in cases of ATN appears heterogeneous with a characteristic mosaic pattern resembling the Tiger skin. There was no significant T2W morphological difference between the two groups.
Conclusion
These results show how DW MRI is a promising new technique for the diagnosis of acute renal transplant dysfunction.
Renal transplantation is the preferred method of renal replacement therapy in end-stage renal disease [1]. Acute deterioration in function, in a transplanted kidney, is a diagnostic and a therapeutic challenge. It could be due to infection, renal allograft rejection, urinary or vascular obstruction, ciclosporin or tacrolimus nephrotoxicity, dehydration or acute tubular necrosis, and each requires distinctly different management [2]. Accurate differentiation between previous causes relies on combination of clinical findings and histopathological examination of a biopsy from the transplanted kidney. However, a needle biopsy from a transplanted kidney may be associated with serious morbidity, such as haematuria requiring transfusion, obstruction of the graft by clots, hypovolaemic shock and intraperitoneal haemorrhage that may lead to graft nephrectomy [3]. Unfortunately, there is no non-invasive tool that can diagnose the aetiology of acute graft dysfunction. Ultrasonography, including colour Doppler imaging, is a non-invasive diagnostic method that provides flowmetric quantitative parameters for the haemodynamic assessment of the renal transplant. These values present certain sensitivity but are not specific of renal graft dysfunction because there is no reliable differentiation between acute rejection and other parenchymal pathology [4].
Diffusion-weighted (DW) MRI is an established method used in the diagnosis of acute stroke [5]. Diffusion-weighted imaging (DWI) provides quantification of Brownian motion of water protons by calculating the apparent diffusion coefficient (ADC), and can be used for in vivo quantification of the combined effects of capillary perfusion and diffusion [6]. Since the main kidney functions are related to transportation of water (glomerular filtration, active and passive tubular reabsorption, and secretion), diffusion characteristics may provide a useful insight into the functional consequences of different renal diseases.
DW MRI has been used to examine transplanted kidneys in both animal and human studies [7-9]. However, none of these studies examined the value of DW MRI in identification of the underlying aetiology of acute graft dysfunction. Therefore, the aim of our study was to assess the clinical value of DW MRI in the diagnosis of the underlying aetiology of acute renal allograft dysfunction. In the future, this will allow us to reduce the need for invasive ultrasound-guided biopsies. which have a high-risk of complication.
Methods and materials
Our institutional review board approved the study protocol, and consent was obtained from all of our patients. From January 2009 to January 2010, 76 patients who underwent kidney transplantation at our centre from live related donors were prospectively enrolled in the study. There were 57 males and 19 females; their mean age was 28.3±9.7 years (range, 10–55 years). We divided our patients into 2 main groups: Group 1 (49 patients) included patients with stable graft function as indicated by normal serum creatinine (≤1.3 mg dl−1). All patients were evaluated by DW MRI on day 14 after transplantation.
Group 2 (27 patients) included patients with acute kidney dysfunction as indicated by elevated serum creatinine. Among this group, we excluded six patients in whom graft biopsy was not required because the aetiology of graft dysfunction was determined by other means: pyelonephritis diagnosed clinically (n=2), renal vein thrombosis diagnosed by Doppler sonography (n=2) and urinary obstruction diagnosed by greyscale sonography (n=2). The remaining 21 patients, in whom the aetiology of graft dysfunction was uncertain, underwent both DW MRI and ultrasound-guided needle biopsy and were included in the final analysis. DW MRI was performed just before biopsy.
MRI protocol
The MRI study was performed with a 1.5 T imager (Signa-Horizon; GE medical system, Milwaukee, WI). For morphological evaluation and accurate anatomical localisation of the transplanted kidney, we initially acquired coronal fast spin-echo (FSE) T2W images of the kidney with the following parameters: time of repetition (TR), 10 000–14 000 ms; time to echo (TE), 80–90 ms; section thickness, 4 mm; intersection gap, 1 mm; matrix, 256×192; number of excitation (NEX), 2; field of view (FOV), 36 cm; in all, we acquired 24 images of the kidney. Then, with the patient free breathing, DW images were obtained in the coronal plane by using a body coil and a gradient multishot spin-echo echoplanar sequence (TR/TE, 8000/61.2; bandwidth, 142 kHz; matrix, 128×128; section thickness, 4 mm; intersection gap, 0 mm; FOV, 36 cm; signals acquired, 7; water signals acquired with b-values of 0 and 800 s mm−2). 40−54 sections were obtained in 60–120 s to cover the pelvis. Gadolinium (Gd)-enhanced MR angiography (MRA) was performed for all cases in Group 1 as a part of its basal study followed by coronal contrast-enhanced gradient echo (GRE) T1W scan of the kidney. In Group 2, because of impaired renal function no contrast was used to avoid the risk of nephrogenic systemic fibrosis.
Image analysis
We commenced image analysis by morphological evaluation of the kidney at the coronal T2W for kidney size to detect if there was any abnormal signal intensity (SI). DW images were analysed using dedicated software (FuncTool; GE Medical Systems) for any areas of high SI. The region of interest (ROI) was placed at the middle of the kidney including the entire renal parenchyma, but excluding renal sinus and any areas of abnormally high SI. In cases of an abnormal focal area of high SI we selected a ROI for it separately. DW values were calculated on a pixel-by-pixel basis to obtain the ADC values.
Two radiologists (MA, HR), who were blinded to the results of biopsy, analysed all images to nullify interobserver variability. Diagnosis was obtained in consensus. They measured the ADC values and the mean of both readings was used in final statistics. They also studied the morphological changes.
Statistical analysis
Data were processed using SPSS version 16 (SPSS Inc., Chicago, IL). ADC values, compared with normal and impaired grafts, were performed with one-way analysis of variance (ANOVA) with Bonferroni post hoc contrasts to detect significant differences between subgroups; p<0.05 was considered statistically significant. In evaluating the agreement and in identifying the morphological changes, we applied the κ statistic. A κ-value of less than 0.20 was considered poor; 0.21–0.40, fair; 0.41–0.60, moderate; 0.61–0.80, good; and 0.81–1.00, excellent.
Results
The final analysis included 49 patients with normal graft function (Group 1) and 21 patients with acute graft impairment (Group 2). In Group 2 the mean serum creatinine was 3.3±1 mg dl−1 (range, 1.8–7 mg dl−1). The final histopathological diagnosis of the second group (21 patients) was ACR in 10, ATN in 7 and immunosuppressive toxicity in 4 patients.
Functional evaluation
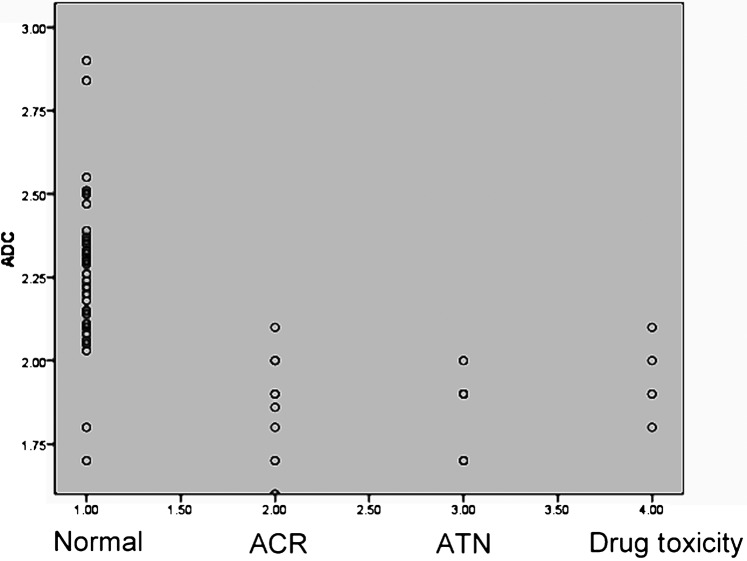
The range [mean±standard deviation (SD)] of the ADC values (×10−3 mm2 s−1) was as follows: Group 1 with normal graft function (n=49), 1.7–2.9 (2.26±0.20), Group 2 with graft impairment (n=21), 1.6–2.1 (1.88±0.13), ACR (n=10), 1.6–2.1 (1.88±0.15), ATN (n=7), 1.7–2 (1.85±0.11) and drug toxicity (n=4), 1.8–2.1 (1.95±0.12).
ADC values of Group 1 were significantly higher compared with Group 2 with impaired graft function (p<0.001), with ACR (p<0.001), with ATN (p<0.001) and with drug toxicity (p<0.001). There was no overlap between the ADC values of patients with normal graft function and those with ATN, but minimal overlap was observed in patients with ACR and those with drug toxicity (Figure 1).
Figure 1.
Scatter plots of the apparent diffusion coefficient (ADC) of normal transplanted grafts, grafts with acute cellular rejection (ACR), acute tubular necrosis (ATN) grafts and grafts with immunosuppressive drug toxicity.
Table 1 lists the sensitivity, specificity and overall accuracy of DW MRI in diagnosis of acute graft dysfunction when we used an ADC value of 2×10⁻³ mm2 s−1 as a cut-off value to differentiate between normal and acutely impaired grafts.
Table 1. Diagnostic performance of diffusion-weighted MRI in acute renal allograft dysfunction.
| Diagnostic accuracy | ACR, number (%) | ATN, number (%) | Drug toxicity, number (%) |
| Sensitivity | 9/10 (90) | 7/7 (100) | 3/4 (75) |
| Specificity | 47/49 (95.9) | 47/49 (95.9) | 47/49 (95.9) |
| Accuracy | 56/59 (94.9) | 54/56 (96.4) | 50/53 (94.3) |
ACR, acute cellular rejection; ATN, acute tubular necrosis.
Morphological evaluation
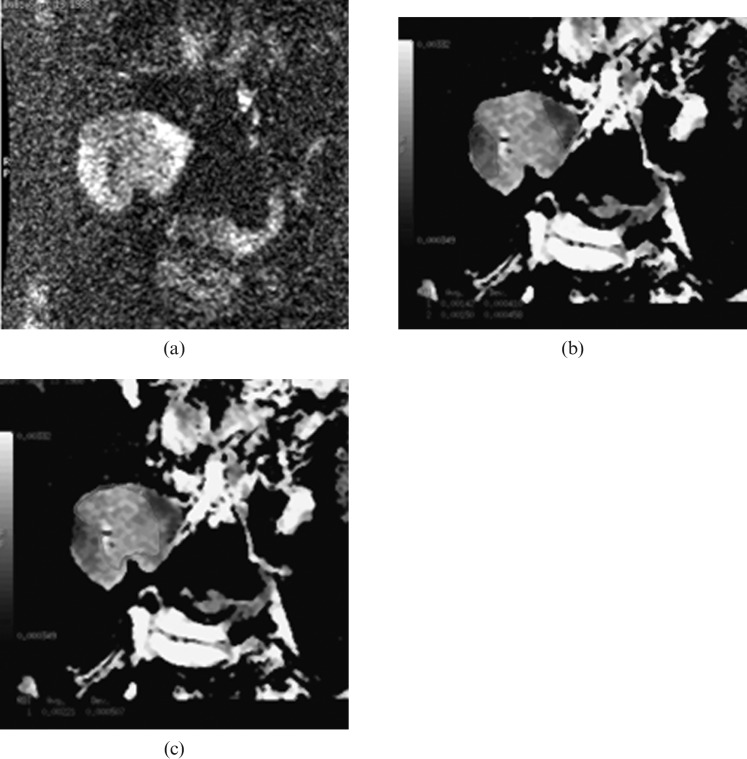
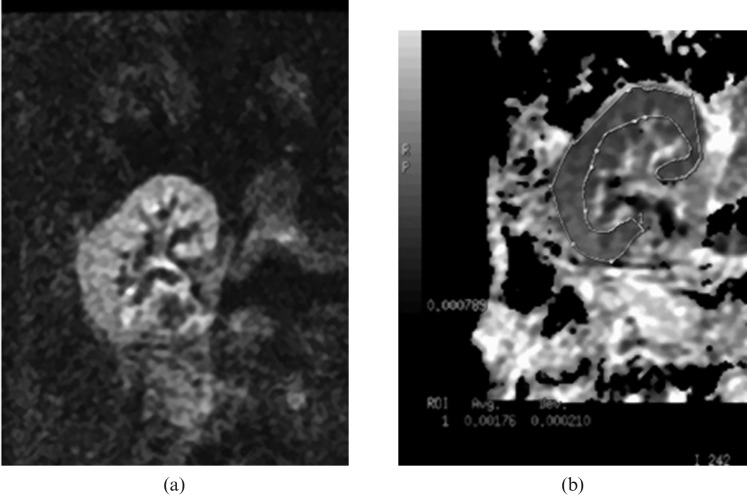
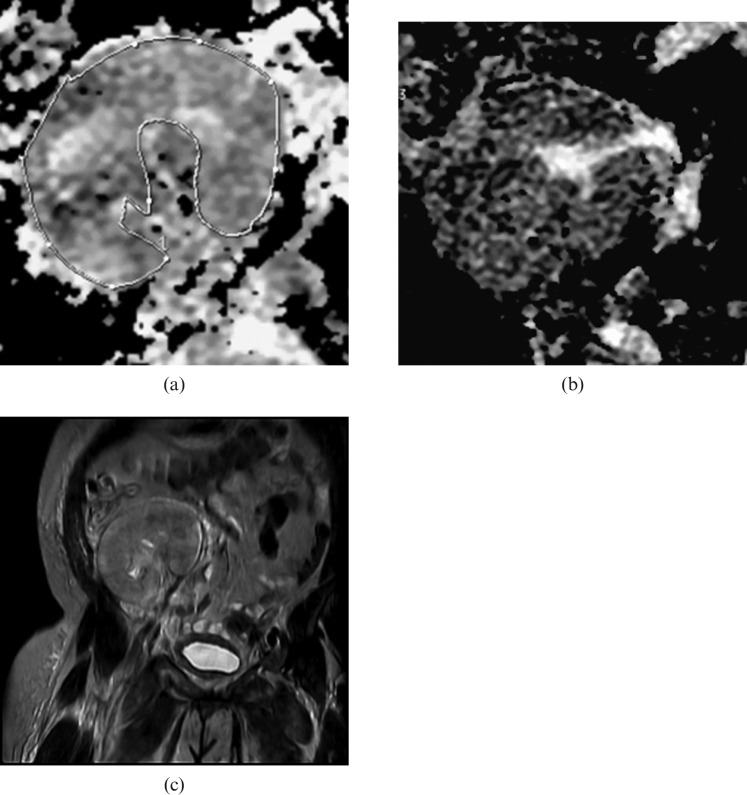
In Group 1 with normal graft function, morphological analysis of DW MRI could identify seven focal areas of restricted diffusion in five cases (two patients with two areas in both). They appeared as wedge-shaped areas of high SI (Figure 2) with low ADC value (range, 1.38–1.8; mean=1.68×10⁻³ mm2 s−1). The diagnosis was confirmed by contrast-enhanced MRI that showed hypoperfusion at the affected areas. In Group 2, there was a diffuse reduction in SI of the graft (Figure 3). In cases of ATN, the ADC map showed multiple tubular hypointense areas with mosaic pattern of the kidney resembling tiger skin (Figure 4). On DW MRI, the reviewers agreed on the identification of all lesions in both groups (the agreement between the two readers was excellent: κ=1.) Analysis of T2W images revealed no morphological changes in Group 1, and no abnormalities could be detected in cases with a perfusion defect. In Group 2, there were abnormal areas of relatively low SI at the parenchyma in two cases of ATN, with no parenchymal abnormalities noted in the other cases.
Figure 2.
Renal transplant recipient with normal kidney function. Diffusion-weighed images, 2 weeks after transplantation:(a) DW image at b=800 s mm−2 shows areas of high SI at upper (black arrow) and lower (white arrow) poles due to restricted diffusion secondary to ischaemic changes, (b) region of interest (ROI), applied to an ischaemic area. Its apparent diffusion coefficient (ADC) value equals 1.42 and 1.5×10⁻³ mm2 s−1. (c) ROI at the normal parenchyma shows ADC value of 2.21×10⁻³ mm2 s−1.
Figure 3.
Renal transplant dysfunction; biopsy demonstrated acute rejection. (a) Diffusion-weighed image at b=800 s mm−2 shows no abnormal areas of high signal intensity, (b) region of interest for the renal parenchyma shows an apparent diffusion coefficient, value of 1.76×10⁻³ mm2 s−1.
Figure 4.
Renal transplant dysfunction; biopsy demonstrated acute tubular necrosis. (a) Diffusion-weighed image shows patchy areas of restricted diffusion and heterogeneous pattern of the kidney. (b) Apparent diffusion coefficient map shows multiple tubular hypo-intense areas “mosaic pattern” resembling the tiger skin. (c) Coronal T2 weighted of the kidney shows abnormal low signal intensity at the upper pole of the kidney.
Discussion
DW MRI is a technique used to show molecular diffusion, which is the Brownian motion of the spin in biological tissues [10]. As a quantitative parameter calculated from the DW MRI, the ADC combines the effect of capillary perfusion and water diffusion in the extracellular–extravascular space [10]. Thus, DW MRI provides information on perfusion and diffusion simultaneously in any organ. The kidney is well suited for diffusion studies because of its high blood flow and its fluid transport function [11].
DW MRI is already an established method used routinely at several institutions in the diagnosis of acute stroke [5]. Until recently, only a few studies have involved measurement of water diffusion in the kidneys [11-15]. Some investigators have reported higher values in the medulla than in the cortex of the kidney [11,15], whereas others have reported the opposite [13,14]. Comparison of these results is difficult because of the different imaging strategies employed in these studies.
Acute graft impairment is a diagnostic challenge and can occur at any time after transplantation. Sometimes the cause can be suspected on clinical grounds. Fever is common with infection and/or rejection. Tremor can be a clue to calcineurin inhibitor toxicity, which can be confirmed by determining the blood level of the calcineurin inhibitor. Renal ultrasound examination, including a Doppler flow study may demonstrate allograft enlargement, the presence or absence of hydronephrosis, and blood flow in and out of the kidney graft [2].
Although renal biopsy with histopathological assessment is the gold standard for diagnosing acute graft rejection, it is an invasive procedure and can have serious complications [3]. Thus, non-invasive tools for detecting acute graft rejection are desirable. The kidney has an important role in both water re-absorption and concentration–dilution functions. Thus, measurement of the diffusion characteristics of a kidney may provide useful insights into the events leading to acute renal dysfunction. To the best of our knowledge, only three reports discuss the value of DWI in functional evaluation of transplanted kidneys [7-9].
A study by Thoeny et al [8] evaluated 15 patients with a renal allograft with stable function and compared them with healthy volunteers. They reported that the ADC values were virtually identical in the cortex and the medulla of transplanted kidneys. Yang et al [7] used DW MRI to assess transplanted kidneys in rats; in addition, they observed a small difference in ADC between the cortex and medulla, in contrast with the findings of Thoeny et al [8]. Allografts exhibited significant decreased ADC values and isografts exhibited similar ADC values compared with native kidneys. Reduction in renal blood flow with the use of a renal vasoconstrictor, angiotensin II, also resulted in a concomitant decrease in ADC values [7].
Recently, Blondin et al [9] assessed the clinical value of DWI in the functional evaluation of transplanted kidneys. Their study included 32 patients who were divided into 4 groups: (a) patients with stable function renal allograft for at least 6 months, (b) patients with acute deterioration of allograft function, patients who recently underwent transplantation (<14 days) with good (c), or decreased (d) renal function. They found that, the difference in ADC between groups (a) and (b) (p<0.006) and between group (c) and (d) (p<0.04) was statistically significant. A recent study by Eisenberger et al [16] evaluated the DWI in 15 patients at the early transplant period, 5–19 days after transplantation, using a 3 T MRI machine. They stated that DWI allows reliable determination of diffusion and microcirculation contributions in renal allografts shortly after transplantation; deviations in acute rejection might indicate the potential clinical use of this method to non-invasively monitor derangements in renal allografts.
Our study found that the ADC values in patients with stable kidney function were significantly higher than in patients with altered kidney function. If there is acute impairment in renal function, kidney perfusion and cellular diffusion may be deficient. This finding is in agreement with a recent article by Blondin el al [9]. In cases of ATN, the ADC map showed a characteristic heterogeneous appearance with mosaic pattern resembling tiger skin; this may be due to filling the tubules with debris and a consequent lack of fluid inside the tubules that appear as sites of signal void areas. Grafts displaying acute rejection and calcineurin inhibitor nephrotoxicity have low ADC and could be differentiated from each other by determining the blood level of the calcineurin inhibitor.
Our study shows that DW MRI has another advantage other than the diagnosis of graft impairment: it can detect the ischaemic changes in the kidney with high accuracy without using the Gd-based MR contrast agents, which carry the risk of nephrogenic systemic fibrosis in patients with impaired kidney function.
Finally, larger series are needed to analyse different abnormalities in more detail. One of the limitations of our study is that the number of patients with graft impairment and with the same abnormality is small.
Conclusion
Renal allografts with acute functional impairment have a lower ADC compared with normal grafts. Grafts with ATN showed low ADC values and a characteristic heterogeneous mosaic appearance. Grafts, which are the result of rejection and calcineurin inhibitor nehrotoxicity, have a low ADC and could be differentiated from each other by determining the blood level of the calcineurin inhibitor. DW MRI also allows the diagnosis of ischaemic changes without using contrast media. Our results also showed that DW MRI has a high sensitivity and specificity in diagnosis of acute renal allograft dysfunction; this may allow us in the future to reduce the need for invasive US-guided biopsies with their high risk of complications. Clinical experience with DW MRI is still preliminary and further studies with a lager number of patients are required.
References
- 1.Ali MG, Coakley FV, Hricak H. Complex post-transplantation abnormalities of renal allografts: Evaluation with MR imaging. Radiology 1999;211:95–111 [DOI] [PubMed] [Google Scholar]
- 2.Barry JM, Jordan MI, Conlin MJ. Renal transplantation. Walsh PC, Retik AB, Vaughan ED, Wein AJ, Campbell's Urology. 8th edn, Vol. 2 Philadelphia, PA: WB Saunders; 2002. pp. 1295–324 [Google Scholar]
- 3.Mahoney MC, Racadio JM, Merhar GL, First MR. Safety and efficacy of kidney transplant biopsy: tru-cut needle vs sonographically guided biopsy gun. AJR AM J Roentgenol 1993;160:325–6 [DOI] [PubMed] [Google Scholar]
- 4.Drudi FM, Cascone F, Pretagostini R, Ricci P, Trippa F, Righi A. Role of colour Doppler US in the evaluation of renal transplant. Radiol Med 2001;101:243–50 [PubMed] [Google Scholar]
- 5.Buckley BT, Wainwright A, Meagher T, Briley D. Audit of a policy of magnetic resonance imaging with DW imaging as first-line neuroimaging for inpatients with clinically suspected acute stroke. Clin Radiol 2003;58:234–7 [DOI] [PubMed] [Google Scholar]
- 6.Le Bihan D. Diffusion/perfusion MR imaging of the brain: from structure to function. Radiology 1990;177:328–9 [DOI] [PubMed] [Google Scholar]
- 7.Yang D, Ye Q, Williams DS, Hitchens TK, Ho C. Normal and transplanted rat kidneys: diffusion MR imaging at 7 T. Radiology 2004;231:702–9 [DOI] [PubMed] [Google Scholar]
- 8.Thoeny HC, Zumstein D, Simon-Zoula S, Eisenberger U, De Keyzer F, Hofmann L, et al. Functional evaluation of transplanted kidneys with diffusion-weighted and BOLD MR imaging: initial experience. Radiology 2006;241:812–21 [DOI] [PubMed] [Google Scholar]
- 9.Blondin D, Lanzman RS, Mathys C, Grotemeyer D, Voiculescu A, Sandmann W, et al. Functional MRI of transplanted kidneys using diffusion-weighted imaging. [In German.] Rofo 2009;181:1162–7 [DOI] [PubMed] [Google Scholar]
- 10.Le Bihan D, Breton E, Lallemand D, Aubin ML, Vignaud J, Laval-Jeantet M. Separation of diffusion and perfusion in intravoxel incoherent motion MR imaging. Radiology 1988;168:497–505 [DOI] [PubMed] [Google Scholar]
- 11.Muller MF, Prasad PV, Bimmler D, Kaiser A, Edelman RR. Functional imaging of the kidney by means of measurement of the apparent diffusion coefficient. Radiology 1994;193:711–15 [DOI] [PubMed] [Google Scholar]
- 12.Laissy JP, Menegazzo D, Dumont E, Piekarski JD, Karila-Cohen P, Chillon S, et al. Hemodynamic effect of iodinated high viscosity contrast medium in the rat kidney: a diffusion-weighted MRI feasibility study. Invest Radiol 2000;35:647–52 [DOI] [PubMed] [Google Scholar]
- 13.Ries M, Jones RA, Basseau F, Moonen CT, Grenier N. Diffusion tensor MRI of the human kidney. J Magn Reson Imaging 2001;14:42–9 [DOI] [PubMed] [Google Scholar]
- 14.Siegel CL, Aisen AM, Ellis JH, Londy F, Chenevert TL. Feasibility of MR diffusion studies in the kidney. J Magn Reson Imaging 1995;5:617–20 [DOI] [PubMed] [Google Scholar]
- 15.Namimoto T, Yamashita Y, Mitsuzaki K, Nakayama Y, Tang Y, Takahashi M. Measurement of the apparent diffusion coefficient in diffuse renal disease by diffusion-weighted echo-planar MR imaging. J Magn Reson Imaging 1999;9:832–7 [DOI] [PubMed] [Google Scholar]
- 16.Eisenberger U, Thoeny HC, Binser, Gugger M, Frey FJ, Boesch C, et al. Evaluation of renal allograft function early after transplantation with diffusion-weighted MR imaging. Eur Radiol 2010;20:1374–83 [DOI] [PubMed] [Google Scholar]


