

Abstract
Walnuts contain multiple ingredients that, individually, have been shown to slow cancer growth, including omega-3 fatty acids, antioxidants, and phytosterols. In previous research, consumption of walnuts has slowed the growth of implanted breast cancers. We wanted to determine whether regular walnut consumption might reduce the risk for developing cancer. Homozygous male C(3)1 TAg mice were bred with female SV129 mice consuming either the control AIN-76 diet or the walnut-containing diet. At weaning, the female hemizygous pups were randomized to control or walnut-containing diets and followed for tumor development. Compared to a diet without walnuts, consumption of walnuts significantly reduced tumor incidence (fraction of mice with at least one tumor), multiplicity (number of glands with tumor/mouse), and size. Gene expression analyses indicated that consumption of the walnut diet altered expression of multiple genes associated with proliferation and differentiation of mammary epithelial cells. A comparison with another dietary intervention indicated that the omega 3 content alone did not account for the extent of tumor suppression due to the walnut. The results of this study indicate that walnut consumption could contribute to a healthy diet to reduce risk for breast cancer.
INTRODUCTION
Many scientists now think that diet can alter carcinogenesis (1). Epidemiology studies have tried to identify individual components of whole foods that might reduce risk for cancer; however, these studies often indicate little or no benefit to consuming a specific dietary component. Clinical trials that have used specific supplements [i.e., calcium (2), calcium and wheat bran (3), selenium, and vitamin E (4)] often demonstrate little or no effect of the supplement. However, people consume whole foods; the multiple ingredients in individual foods, as well as accumulated amounts of these components within a whole diet, could act additively or synergistically to contribute to reduction of risk for disease, including cancer. In support of this idea, one preclinical study reported that very low doses (more similar to dietary doses) of selenium and docosahexaenoic acid in combination were more effective against cancer than either of these components individually at high doses (5).
Walnuts contain multiple ingredients (6) that individually have been reported to reduce cancer risk or growth rate. These ingredients include omega-3 fatty acids (7,8); phytosterols, especially β-sitosterol (9,10); and antioxidants (11,12). We have previously reported that walnut in the diet of mice (human equivalent of 2 servings a day) would reduce the growth rate of implanted human breast cancers (13). We have also reported that canola oil—which contains α-linolenic acid, the 18C omega-3 fatty acid incorporated in the maternal diet during gestation and lactation of offspring—significantly reduced mammary gland cancer risk in the offspring (14). Walnuts contain the highest fraction of α-linolenic acid of any tree nut (15). The current study was designed to determine whether the risk for developing breast cancer might be reduced by regular walnut consumption, perhaps due to the high α-linolenic acid content.
In designing mouse diets that were applicable to human consumption, we used a 10% corn oil diet as the control diet. This diet has an omega-6 fatty acid (linoleic acid) content that is approximately equivalent to the linoleic acid content in the American diet. It turned out that the α-linolenic acid content of the walnut diet was equivalent to the α-linolenic acid content of the canola oil diet, giving us the added value of comparing 2 interventions containing the same amount of α-linolenic acid to determine if the α-linolenic acid content of the walnut diet might be the primary cancer suppressive component of walnut.
The C(3)1 TAg transgenic mouse is a well-characterized breast cancer model and the females of these mice develop mammary gland cancer at a predicable rate (16,17). As in human tumors, the early stages are estrogen receptor α (ERα) positive but become ERα negative in later stages (17). The cancer development is slow enough that a dietary modification can make a difference in tumor development. Use of this model allowed us to control the maternal diet as well as the diet of the experimental offspring. However, as with any dietary modification study, we cannot determine if subtraction of a detrimental component or addition of a beneficial component determined the difference in tumorigenesis.
When a dietary component is routinely consumed within a population, the offspring are exposed to the component during gestation and lactation as well as by consumption after weaning. This notion is duplicated by the experiment reported here. Exposure to the walnut included in the maternal diet during gestation and lactation, as well as by individual consumption after weaning, provided significant protection from mammary gland cancer in the offspring. The reduction in cancer risk cannot be explained solely by the omega-3 content of the diet. Increased consumption of walnut could be part of a healthy diet and reduce risk for cancer in future generations.
METHODS AND MATERIALS
Animals
Breeding pairs of mice bearing a transgene for the SV40 large T antigen with a C3(1) rat prostate steroid binding protein promoter were obtained from Dr. Jeffrey Green. The female transgenic mice are expected to develop mammary gland cancer due to expression of the large T antigen in the mammary gland (17). The transgenic line is maintained in the laboratory and all mice were genotyped to ensure presence of the transgene. Twenty female SV129 mice, 6 wk old, were obtained from Charles River Laboratories (Wilmington, MA), quarantined for 2 wk, and then moved to a study room. All animal work was approved by the Marshall University School of Medicine Institutional Animal Care and Use Committee.
Study Design
SV129 females (breeder females) were split into 2 groups and numbered for identification. Ten female mice were placed on a diet containing 10% w/w corn oil (control diet, see below) and 10 female mice were placed on a diet containing walnuts (test diet). The compositions of the diet and of the dietary fat are listed in Table 1. After 2 wk, these females were bred with homozygous C3(1)/TAg male mice. The hemizygous female pups from these breedings were the experimental mice—not the wild-type mother mice. Pups were weaned at 21 days old and were randomized to the 2 diets, generating 4 experimental groups: corn oil/corn oil (CO/CO), corn oil/walnut (CO/walnut), walnut/walnut, or walnut/corn oil (walnut/CO) (the first diet was the maternal diet; the second diet was the pup's diet). The offspring were housed 3 to 4 in a cage, individually numbered for identification, and weighed weekly.
TABLE 1.
Compositions of the diets
| Both Diets |
Walnut Diet (18% of calories from walnut) |
|||||
|---|---|---|---|---|---|---|
| Diet Compositions | Corn Oil (Control) Diet g/kg diet | Calories/g diet | % of total energy | g/kg diet | Additional nutrient contained in 111 g walnut/kg diet | |
| Casein | 200 | 0.80 | 19.2 | 183 g | Protein: 17.2 g | |
| Sucrose | 450 | 1.800 | 43.4 | 450 g | ||
| Corn starch | 150 | 0.60 | 14.46 | 135 g | Carbohydrate: 15.5 g | |
| Alphacel | 50 | 0 | 0 | 48 g | Fiber: 2.0 g | |
| Choline bitartrate | 2.0 | 0 | 0 | 2g | ||
| DL-methionine | 3.0 | 0 | 0 | 3g | ||
| AIN-76 Mineral mix | 35.0 | 0.02 | 0.4 | 35 g | ||
| AIN-76A Vitamin mix | 10.0 | 0.030 | 0.7 | 10 g | ||
| Ground walnut | 0 | 111 g | ||||
| Fat (10% total fat) | 100 g corn oil | 0.90 | 21.7 | 26.3 g corn oil | Fat: 73.7 g | |
| Totals | 1,000 g | 4.15 cal/g | 99.9 | 1,003g | (4.6 g water in walnut) | |
| Fat in diet | From corn oil g/kg diet | From corn oil g/kg diet | From walnut g/kg diet | Total g/kg diet | ||
| Oleic acid | 27.33 | 7.2 | 9.7 | 16.9 | ||
| Linoleic acid | 53.2 | 14.0 | 41.9 | 55.9 | ||
| α-Lenolenic acid | 1.2 | 0.3 | 10.0 | 10.3 | ||
| Total saturated fat | 12.9 | 3.3 | 6.7 | 10.0 | ||
Fat composition (g/100 g) of corn oil and walnut from Ref. 15. Small amounts of various lipids make up the remainder of the fat and are not listed. Shown are the compositions of the corn oil and walnut-containing diets of this article. The canola oil diet, referred to in Fig. 4, had 10% canola oil instead of 10% corn oil and is detailed in Ref. 21.
Diet
Diets were prepared in the Marshall University School of Medicine animal diet prep room. Diet composition is shown in Table 1 and was formulated to be isocaloric, isonutrient, and more relevant to human consumption than the very high-fat diets used in many studies. [If a Western diet contains about 14.7 g of linoleic acid/day (18) the calories from linoleic acid are 6.6% of a 2,000 calorie diet. The 10% corn oil mouse diet contained 10.9% of calories from linoleic acid.] The walnut-containing diet was formulated to contain 18% of calories from walnut. This approximates a human diet that includes 2 servings (2 ounces) of walnuts per day. (Two ounces of walnuts, 28 halves, equals 370 calories; 370 calories = 18.5% of a 2,000 calorie diet.) The AIN-76A diet is adequate for the nutritional support of the mice (19). The dry ingredients of the diet, except sugar, were obtained in bulk from MP Biomedicals (Solon, OH); sugar and corn oil were purchased locally (100% corn oil, no additives or preservatives). Walnuts were provided by the California Walnut Commission and kept frozen at −20°C until used. Walnuts (with brown pellicle but without shells) were ground fine in a blender for mixing into the diet. Batches of diet were prepared as needed, about each 2 wk. The diet mixture was pressed into trays and cut into small squares. Individual cage-sized portions (25–30 g) were stored in sealed containers at −20°C to prevent oxidation of the fat and bacterial growth in the food. Mice had free access to food and water and were fed fresh food 5 days per wk. Food removed from cages was discarded.
Transgene Copy Number
Real time PCR was used to verify the presence of the transgene in all experimental pups, as previously described (14). Primers for the transgene (SV40 foward: ATA TGC CTT CAT CAG AGG AAT ATT C; SV40 reverse: TAA AGT TTT AAA CAG AGA GGA ATC TTT GC) and the VIC labeled SV40PROBE (VICCCC AGG CAC TCC TTT CAA GAC CTA GAA GGMGBNFQ), β-actin primers and PCR Master Mix were purchased from Applied Biosystems (Foster City, CA). The rtPCR assay was performed according to the Applied Biosystems instructions on an ABI Prism 7000 (Applied Biosystems, Foster City, CA) instrument.
Body Weights
Body weights were measured each week and terminally. Statistical differences in mean body weight change between groups were determined using analysis of variance (ANOVA) and Prism (Graphpad, Inc.) software.
Tumor Incidence, Multiplicity, and Weight
Mice were palpated for tumors 3 times weekly from 90 days of age. Total tumor incidence, multiplicity, and weights were determined at necropsy. The differences between groups and across time were statistically analyzed by Kruskal-Wallis, 2-way ANOVA, χ2, Fisher exact test, or Mann-Whitney test as appropriate using Prism software (Graphpad, Inc., La Jolla, CA).
Necropsy
Mice were euthanized at 110, 130, and 145 days of age. The earliest time for tumors was expected to be 110 days of age; mice were euthanized thereafter to follow the increase in tumor incidence and multiplicity. The left fourth mammary gland was quickly removed and frozen in liquid nitrogen. All 10 mammary glands were examined for the presence of a tumor 1 mm or larger. All tumors detected were measured, removed, and weighed; thus total tumor weight and numbers include tumors that were too small to be detected by palpation. If a tumor was large enough for further assay, it was flash-frozen in liquid nitrogen. The number of tumors in each gland and the number of glands with tumor were recorded for every mouse. Some mice in the CO/CO group had to be euthanized (due to large tumor size) before a scheduled 145 days, thus slightly skewing (to a smaller size) the results for tumor mass in this group.
Gas Chromatography
The fatty acid compositions of mammary glands at 130 days of age were analyzed by gas chromatography. Frozen tissues were thawed and homogenized in distilled water containing 0.1% BHT to prevent oxidation of the fatty acids. Lipids were extracted with chloroform/methanol, and the fatty acids were methylated followed by separation and identification using gas chromatography, as previously described (20). ANOVA followed by a Bonferroni posttest was used to determine statistical differences of individual fatty acids between dietary groups.
Gene Expression Assay
The Mouse Signal Transduction Pathway Finder RT2 Profiler PCR Array, PAMM-014 (SuperArray Bioscience Corporation, Frederick, MD) was used to analyze the expression of 84 genes in 3–4 mammary glands per group at 130 days of age mice. (The complete list of genes on the plate can be found at www.sabiosciences.com/rt_pcr_product/HTML/PAMM-014A.html.) The Signal Transduction pathway finder array was used because, a priori, we did not know what genes or pathways might be influenced by consumption of the walnut diet. Mammary gland without macroscopic tissue was analyzed to obtain changes due to the diet not to the presence of a tumor. This array profiles genes in 18 different pathways that could be applicable to cancer development. Frozen tissue was homogenized in Tri Reagent (Sigma-Aldrich, St. Louis, MO) following the protocol of the manufacturer to isolate the RNA. RNA quality control was performed for all samples to ensure the purity and integrity of the RNA on an Agilent 2100 Bioanalyzer (Santa Clara, CA). The RT2 First Strand Kit was used to make cDNA; the cDNA was then quantitatively amplified by real-time PCR using an ABI Prism 7000 (Applied Biosystems, Foster City, CA) and RT2 qPCR Master Mix (Superarray) according to the manufacturer's protocol. The protocol and software provided by SuperArray were followed to determine relative fold difference in gene expression using the ΔΔct method and for statistical analyses of the data by t-test.
Immunoblot Analysis
Tri Reagent (Sigma-Aldrich, St. Louis, MO) was used to homogenize and isolate protein from frozen mammary gland tissues following the manufacturer's protocol. Protein concentration was determined by BCA protein Assay Kit (EMD Bio-sciences, Inc., Darmstadt, Germany) following the manufacturer's protocol. Ten micrograms of protein were applied to each lane of a 4–15% Tris-HCl polyacrylamide gradient gel (Bio-Rad, Hercules, CA), separated by electrophoresis and then transferred onto a nitrocellulose membrane. The blots were blocked with 5% BSA in TBST overnight at 4°C and probed with primary antibodies against nitric oxide synthase Type II (NOS 2); Simian virus 40 Large T antigen (SV40 T Ag; BD Biosciences, San Diego, CA); NF kappa B inhibitor alpha (IκB alpha; Abcam, Inc., Cambridge, MA); or inhibitor of NF kappa-B kinase beta (IKK beta; Cell Signaling Technology, Inc., Danvers, MA) in blocking buffer for 1 h at room temperature. Cytokeratin 8 (Santa Cruz Biotechnology, Inc., Santa Cruz, CA) was used to normalize for the epithelial compartment of the mammary gland specimen and GAPDH (Chemicon International, Temecula, CA) was used to normalize protein loading. The membrane was thereafter incubated with horseradish peroxidase (HRP) conjugated anti-mouse (Santa Cruz Biotechnology, Inc.) or antirabbit (Pierce, Inc.) secondary antibody. Band detection was done with chemiluminescence ECL Kit (Pierce, Inc.). Densitometry was used to quantify the bands. A ChemDoc XRS system (Bio-Rad Laboratories, Inc., Hercules, CA) was used to acquire the image then image analysis was done using Quantity One software, v. 4.5.2 (Bio-Rad Laboratories, Inc., Hercules, CA). Tissue availability (many of walnut-consuming mice either had no or very small tumors) limited the number of repeats that could be performed.
RESULTS
Body Weight and Weight Gain
There were no differences between groups in terminal body weight at any of the necropsy time points. Body weight gain between 91 and 135 days were (mean g ± SD) CO/CO = 3.85 ± 1.05; CO/walnut = 2.87 ± 1.5; walnut/walnut = 2.72 ± 1.1; walnut/CO = 2.12 ± 1.1. ANOVA indicated no significant differences between these weight gains. The groups with the greatest difference in tumor incidence and size were the CO/CO and walnut/walnut groups. However, there was no significant difference in body weight (mean ± SD of 12 mice/group: CO/CO = 24.85 ± 1.6 g vs. walnut/walnut = 24.25 ± 1.4 g) at 135 days (before any tumor cachexia). The mean tumor mass of the CO/CO group was 1/3 of the variance in body weight; thus it does not seem that the tumor mass was a significant portion of the mouse weight gain though certainly some of the extra weight gain in the CO/CO group could be due to tumor growth. An important point here is that free access to walnut, a high-calorie food, in the diet did not increase weight gain as would be a concern of many readers. Clinical trials have also indicated that addition of walnut to the diet does not increase body weight or cause weight gain in people (21-23).
Fatty Acid Composition of the Diet and of the Mammary Gland
Table 1 shows that the corn oil diet contained more oleic acid (monounsaturated fat) and saturated fat but that the walnut diet contained more linoleic acid and α-linolenic acid. The fat composition of the mammary gland (Fig. 1) reflects the fat composition of the diet; that is, the mammary glands of mice that consumed the walnut diet after weaning contained significantly less oleic acid and significantly more linoleic acid, α-linolenic acid, and total omega-3 fats than did the mammary glands of the mice that consumed the corn oil diet after weaning [2-way ANOVA (fatty acid and diet group) followed by Bonferroni posttest, P < 0.05]. There were no other fatty acids that were significantly different due to diet.
Tumor Incidence and Multiplicity
At 110 days of age, the first euthanasia point, no mice had tumors. Fig. 2 shows the tumor size, incidence, and multiplicity at 130 and 145 days of age. At 130 days it appears that consumption of walnut is increasing the latency of tumors; however, largely due to the early stage of tumorigenesis, neither the tumor mass (Fig. 2A, Kruskal Wallis, P value for walnut/walnut vs. Co/CO = 0.06), multiplicity (Fig. 2B, number of glands with tumor, by ANOVA), nor the tumor incidence (Fig. 2C, fraction of mice with any tumor, by Fisher's exact test) were significantly different.
FIG. 1.
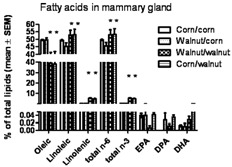
Gas chromatography was used to analyze fatty acids in the mammary gland. Shown are the monounsaturated (oleic) and polyunsaturated [omega-6 (n-6), linoleic and omega-3 (n-3), linolenic] fatty acids that were significantly different due to the diet. Total omega 6 includes linoleic acid (18C) and arachidonic acid (20C), and total omega-3 fatty acid includes α-linolenic acid (18C), eicosapentaenoic (20C), docosapentaenoic (22C), and docosahexaenoic (22C) acids. Individually, the fractions of the 20C and 22C fatty acids were not different between diets (by t-test). Fatty acid compositions reflect the current diet and are as expected based on the fat composition of the diet. (n = 4–5 per group, P < 0.05 by ANOVA).
FIG. 2.
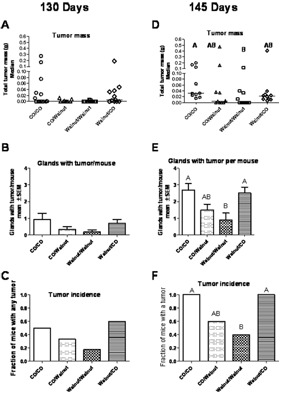
Mammary gland tumors were quantified at euthanasia at 130 and 145 days of age, n = 10–13 mice per time point and diet group. By 145 days, the total tumor mass, number of glands with tumor (multiplicity), and tumor incidence of the walnut/walnut group was significantly less than of the corn oil/corn oil group. Consumption of walnut after weaning (corn oil/walnut group) also decreased the multiplicity, mass, and incidence or tumors (groups which share a letter are not significantly different P < 0.05, statistical test stated in Results).
By 145 days, suppression of tumorigenesis by the walnut-containing diet was clearly evident. The median tumor size of the walnut/walnut group was significantly less than of the CO/CO group (Fig. 2D, P < 0.05, Kruskal-Wallis followed by Dunn's multiple comparison test). (Some mice in the CO/CO group had to be euthanized due to large tumor size before the scheduled 145 days, thus slightly skewing the results for tumor mass in this group to a smaller mass than if the mice had lived to 145 days old.) The multiplicity of tumor was decreased in both groups that consumed walnuts after weaning, with the multiplicity of tumor in the walnut/walnut group being significantly less (Fig. 2E, P < 0.05, Kruskal-Wallis followed by Dunn's multiple comparison test) than in the group not exposed to walnut (CO/CO). The tumor incidence was less in both groups that consumed walnut after weaning than in the group not exposed to walnut (Fig. 2F, CO/CO) with the tumor incidence in the walnut/walnut group being significantly less than the tumor incidence of the CO/CO group (P < 0.05 by Fisher's exact test). Tumor incidence was decreased 40% compared to the CO/CO group when walnut was consumed after weaning; however, with 10 mice in a group this did not reach significance.
PCR Array Analyses for mRNA Expression Followed by Western Blot
The mRNA from a total of 84 genes was quantitatively assayed by the Mouse Signal Transduction Pathway Finder RT2 Profiler PCR Array. Table 2 lists the 41 genes of these genes in which expression in the mammary gland was changed either more than twofold or with a P value < 0.05 by t-test (using the manufacturer's statistical analyses software). Genes in the arrays are listed in the applicable pathways at the bottom of Table 2 with genes that were significantly altered by walnut consumption shown in italics. The expression of many genes in pathways associated with mitogenesis, survival, or NfkB and other signaling has been altered by exposure to dietary walnut.
TABLE 2.
Genes with significantly different expressions as determined by PCR array
| Symbol |
t-testa P Value |
Fold Difference CO/Walnut vs. CO/CO |
t-testa P Value |
Fold Difference Walnut/Walnut vs. CO/CO |
t-testa P Value |
Fold Difference Walnut/CO vs. CO/CO |
|---|---|---|---|---|---|---|
| Activating transcription factor 2 (ATF2) | 0.004 | 2.597 | 0.034 | 1.737 | 0.021 | 1.838 |
| Bcl2-associated X protein (BAX) | 0.079 | 107.535 | 0.074 | 119.263 | 0.079 | 105.420 |
| B-cell leukemia/lymphoma 2 (Bcl2) | 0.163 | 27.338 | 0.292 | 11.867 | 0.178 | 24.098 |
| Baculoviral IAP repeat-containing 2 | 0.002 | 4.328 | 0.076 | 1.896 | 0.007 | 3.375 |
| (Birc2) | ||||||
| Bone morphogenetic protein 2 (BMP2) | 0.109 | 17.182 | 0.095 | 19.865 | 0.139 | 12.914 |
| Bone morphogenetic protein 4 (BMP4) | 0.486 | 3.254 | 0.450 | 3.592 | 0.399 | 4.228 |
| Cyclin-dependent kinase inhibitor 2A | 0.011 | 950.691 | 0.026 | 216.092 | 0.024 | 308.865 |
| [Cdkn2a (p16)] | ||||||
| CCAAT/enhancer binding protein | 0.014 | 2876.968 | 0.027 | 790.342 | 0.016 | 2152.305 |
| (C/EBP), beta | ||||||
| Chemokine (C-X-C motif) ligand 1 | 0.001 | 9.309 | 0.001 | 4.728 | 0.000 | 3.732 |
| (Cxcl1) | ||||||
| Early growth response 1 (EGR1) | 0.033 | 472.608 | 0.037 | 363.002 | 0.057 | 168.410 |
| Engrailed 1 (En1) | 0.000 | 21.449 | 0.162 | 6.895 | 0.000 | 43.236 |
| Fas (TNF receptor superfamily member) | 0.000 | 5.794 | 0.123 | 1.782 | 0.000 | 5.084 |
| Fatty acid synthase (Fasn) | 0.365 | 7.350 | 0.447 | 5.280 | 0.332 | 8.649 |
| FBJ osteosarcoma oncogene (FOS) | 0.068 | 67.275 | 0.077 | 59.356 | 0.124 | 29.446 |
| Growth arrest and | 0.067 | 3.519 | 0.083 | 3.156 | 0.166 | 2.362 |
| DNA-damage-inducible 45 alpha (Gadd45a) | ||||||
| Gene regulated by estrogen in breast | 0.280 | −2.328 | 0.096 | −4.923 | 0.150 | −4.134 |
| cancer protein (Grebl) | ||||||
| Glycogen synthase 1, muscle (Gys1) | 0.002 | −2.717 | 0.009 | −2.213 | 0.000 | −2.086 |
| Hedgehog-interacting protein (Hhip) | 0.035 | 2.111 | 0.164 | −3.308 | 0.003 | 4.285 |
| Hexokinase 2 (Hk2) | 0.192 | 35.886 | 0.237 | 24.499 | 0.213 | 29.719 |
| Heat shock factor 1 (Hsf1) | 0.200 | 15.378 | 0.987 | −1.034 | 0.221 | 13.462 |
| Insulin-like growth factor binding | 0.241 | 18.214 | 0.205 | 24.584 | 0.229 | 19.904 |
| protein 4 (Igfbp4) | ||||||
| Inhibitor of kappaB kinase beta (Ikbkb) | 0.305 | −2.727 | 0.168 | −6.874 | 0.236 | −3.456 |
| Interleukin 2 (Il2) | 0.182 | 2.749 | 0.127 | 4.986 | 0.804 | 1.260 |
| Interleukin 2 receptor, alpha chain | 0.091 | −4.650 | 0.042 | −12.622 | 0.103 | −5.448 |
| (Il2ra) | ||||||
| Interleukin 4 receptor, alpha (Il4ra) | 0.025 | −6.221 | 0.045 | −8.601 | 0.029 | −6.317 |
| Jun oncogene (Jun) | 0.000 | 506.529 | 0.336 | 2.230 | 0.000 | 465.456 |
| Transformed mouse 3T3 cell double | 0.015 | 71.937 | 0.036 | 29.135 | 0.020 | 53.199 |
| minute 2 (Mdm2) | ||||||
| Matrix metallopeptidase 10 (Mmp10) | 0.077 | 2.350 | 0.167 | 3.487 | 0.541 | 1.275 |
| Matrix metallopeptidase 7 (Mmp7) | 0.206 | 2.285 | 0.004 | 10.664 | 3.647 | |
| Myelocytomatosis oncogene (Myc) | 0.040 | 1.739 | 0.089 | −4.569 | 1.360 | |
| Ngfi-A binding protein 2 (Nab2) | 0.000 | −7.938 | 0.215 | −2.961 | −8.042 | |
| Nuclear factor of kappa light chain gene enhancer in B-cells inhibitor, alpha (Nfkbia) | 0.196 | 20.971 | 0.267 | 12.874 | 18.358 | |
| Nitric oxide synthase 2, inducible, macrophage (Nos2) | 0.021 | −3.080 | 0.015 | −2.922 | −1.813 | |
| Patched homolog 1 (Ptch1) | 0.062 | −4.102 | 0.004 | −21.412 | −3.651 | |
| TRAF family member-associated Nf-kappa B activator (Tank) | 0.018 | 4.188 | 0.351 | −2.890 | 3.389 | |
| Transcription factor 7, T-cell specific (Tcf7) | 0.126 | 70.661 | 0.337 | 12.807 | 28.003 | |
| Telomerase reverse transcriptase (Tert) | 0.120 | −1.423 | 0.929 | −1.042 | −1.422 | |
| Tmepai | 0.076 | −5.109 | 0.029 | −147.067 | −8.545 | |
| Tumor necrosis factor (Tnf) | 0.847 | −1.106 | 0.075 | −3.123 | −1.762 | |
| Vascular cell adhesion molecule 1 (Vcam1) | 0.046 | 1.750 | 0.040 | −2.019 | 1.193 | |
| Vascular endothelial growth factor A (Vegfa) | 0.008 | −2.094 | 0.086 | −1.621 | −2.612 | |
| WNT1 inducible signaling pathway protein 1 (Wisp1) | 0.076 | 12.556 | 0.250 | 4.055 | 8.825 |
All comparisons are to the corn oil/corn oil group. Genes with expression that differed by more than twofold or with a P < 0.05 are listed.
The data indicate that walnut consumption influences pathways involved in cell proliferation, cell death, and differentiation of the mammary glands and that would be expected to alter carcinogenesis.
- Mitogenic Pathway: Egrl (egr-1), Fos (c-fos), Jun (c-jun), Nab2.
- Wnt Pathway: Birc5, Ccnd1 (cyclin D1), Cdh1, Fgf4, Jun (c-jun), Lef1, Myc (c-myc), Pparg, Tcf7, Vegfa, Wisp1.
- Hedgehog Pathway: Bmp2, Bmp4, En1 (engrailed), Foxa2 (forkhead box A2/HNF3B), Hhip, Ptch1 (patched 1), Wnt1, Wnt2.
- TGF-β Pathway: Cdkn 1a (p21Waf1, p2lCip1), Cdkn 1b (p27), Cdkn2a (p16Ink4), Cdkn2b (p15 Ink2b).
- Survival Pathway: PI3 Kinase/AKT Pathway: Bcl2 (Bcl-2), Ccnd1, Fn1 (fibronectin), Jun (c-jun), Mmp7 (matrilysin), Myc (c-myc).
- Jak/Src Pathway: Bcl2 (Bcl-2), Bcl2ll (Bc1-XL).
- p53 Pathway: Bax, Cdkn1a (p2lWafl, p2lCipl), Ei24 (Pig3), Fas (Tnfrsf6), Gadd45a (gadd45), Igfbp3, Mdm2.
- Stress Pathway: Atf2, Fos (c-fos), Hsf1 (tcf5), Hspb1 (Hsp25), Myc (c-myc), Trp53 (p53).
- NFκB Pathway: Birc1a, Birc2 (c-IAP2), Birc3 (c-IAP1), Ccl20, Cxcl1, Icam1, Ikbkb, I11a, Il2, Lta (TNFb), Nfkbia, Nos2 (iNOS), Tank, Tnf (TNFa), Tert, Vcam1.
- NFAT Pathway: Cd5, Fasl (Tnfsf6), Il2.
- CREB Pathway: Cypl9al, Egr1 (egr-1), Fos (c-fos).
- Jak-Stat Pathway: Cxcl9 (MIG), Il4ra, Irf1, Mmp10 (stromelysin-2), Nos2 (iNOS).
- Estrogen Pathway: Bcl2 (Bcl-2), Brcal, Greb1, Igfbp4, Nrip1.
- Androgen Pathway: Cdk2, Cdkn1a (p21Waf1, p21Cip1), Tmepai.
- Calcium and Protein Kinase C Pathway: Csf2 (GM-CSF), Fos (c-fos), Il2, Il2ra (IL-2 R?), Jun (c-jun), Myc (c-myc), Odc1, Tfrc.
- Phospholipase C Pathway: Bcl2 (Bcl-2), Egr1, Fos (c-fos), Icam1, Jun (c-jun), Nos2 (iNOS), Ptgs2 (cox-2), Vcaml.
- Insulin Pathway: Cebpb (C/EBP-β), Fasn (fatty acid synthase), Gys1 (GS, glycogen synthase), Hk2 (hexokinase II), Lep (Ob).
- LDL Pathway: Ccl2, Csf2 (GM-CSF), Sele, Selp (P-selectin), Vcaml.
- Retinoic Acid Pathway: En1 (engrailed), Hoxa1, Rbp1 (CRBPI).
Available statistical software only allowed t-tests of test group vs. a control group.
We noted that a number of the genes with altered expression are in the NFkB signaling pathway, so 3 of these genes [NFkB inhibitor alpha (IkB, Nfkbia), ikB kinase (IKK, Ikbkb) and nitric oxide synthase 2 (iNOS or Nos2)] were chosen for Western blot analyses. Western blot results (Fig. 3) were in general agreement with the PCR array analyses for these genes and with the actual tumor incidence results. That is, compared to protein abundance in the mammary glands of the CO/CO group, protein abundance of Nfkbia was increased and of Ikbkb was decreased in the walnut/walnut group. Since Nfkbia binds and prevents activation of NFkB and Ikbkb cleaves NFkB to allow activation of NFkB, these coordinated changes would be expected to decrease NFkB activation and to be associated with suppression of cancer risk (24). Nfkbia was also increased in the CO/walnut and in walnut/CO groups but Ikbkb was not changed. These results would be expected to be associated with less tumor suppression in the CO/walnut and walnut/CO groups than in the walnut/walnut group. Inducible nitric oxide synthase (Nos2) mRNA was slightly decreased but protein was barely detectable in any group and was not changed by a walnut-containing diet.
FIG. 3.
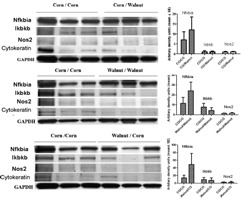
Protein quantification for genes of interest in NFkB pathway. Increased NFkB activity has been associated with increased carcinogenesis. Western blot followed by densitometry was used to quantify NFkB inhibitor alpha (Nfkbia), inhibitor of kappa B kinase beta (Ikbkb), and inducible nitric oxide sythase. Nfkbia binds to and keeps NFkB inactive, Ikbkb cleaves Nfkbia for activation of NFkB; thus increased Nfkbia and decreased Ikbkb would be associated with less activation of NFkB. Nos2 is downstream of NFkB but protein was not changed. N = 3 mice per group. Individual protein changes are not significantly different. GAPDH bands are shown. Since we were interested in gene expression in the epithelial cells, columns in graphs show protein normalized for cytokeratin, which is present in epithelial cells of the mammary gland.
Comparison of Tumor Multiplicity With a Diet Containing the Same Omega-3 Amount as the Walnut Diet
We have previously reported partial results of a study in which incorporation of canola oil instead of corn oil was the dietary intervention (14). The experimental design was the same as above except that 10% canola oil was incorporated into the diet of some mother mice and offspring instead of 10% corn oil. The canola oil diet contained 1% α-linolenic acid (10 g/kg dry weight), the same amount of α-linolenic acid as in the walnut diet of this study. The canola oil study (with different funding) was run in parallel and at the same time as the walnut study using the same control group. Fig. 4 shows the number of glands with tumor per mouse with time, from 110 to 145 days of age. It is clear that fastest tumor development was when the diets of mother and offspring contained only corn oil (CO/CO), providing canola oil in the diet significantly suppressed tumor development (CA/CA), yet there was additional significant suppression of tumor development when walnut was included in the diet (walnut/walnut). The number of glands with tumor per mouse of each group are each significantly different from the other two groups (2-way ANOVA followed by Bonferroni posttest, n = 11–13 mice per time point).
FIG. 4.
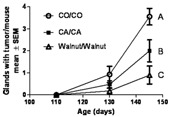
Glands with tumor per mouse for corn oil/corn oil (CO/CO), canola oil/canola oil (CA/CA), and walnut/walnut groups. This experimental design represents dietary exposures for a population that routinely consumes these components in the diet. Tumor multiplicity for each group is significantly different (P < 0.05, 2-way analysis of variance, Bonferroni posttest) from the 2 other groups, CO/CO > CA/CA > walnut/walnut as indicated by different letters for each dataset.
DISCUSSION
Epidemiology studies indicate that some populations have lower incidences of cancer (1,25), the challenge is to identify the foods that contribute to reducing cancer risk given the complex compositions of whole foods. Another challenge in all dietary studies is to determine whether it is the addition of a beneficial component or the subtraction of a detrimental component that provided the benefit against cancer.
The primary aim of this study was to assess the effects of walnut consumption on mammary gland cancer risk. The results presented herein indicate that walnut consumption could significantly alter expression of multiple genes and mammary gland cancer development. Walnut consumption by both mother and offspring, as would naturally occur when walnuts are consumed as part of the usual diet of a population, did significantly reduce mammary gland cancer development and reduced multiplicity in this transgenic mouse. Consumption of walnut after weaning, as might occur when children migrate to a different environment or choose to add walnut to their diet, also slowed mammary gland cancer development and showed a 40% reduction in tumor incidence and a 44% reduction in multiplicity compared to mice not exposed to walnut. The next question is: What component of walnut was effective at slowing carcinogenesis?
Our first hypothesis was that the increased omega 3 content and decreased omega-6 content of the diet-reduced carcinogenesis. Long-chain omega-3 fatty acids have been shown to slow breast cancer growth in multiple animal studies (7,26-30) and have been proposed for cancer prevention (30). Conversely, omega 6 fatty acids, especially linoleic acid as found in corn oil, have been shown to increase carcinogenesis (31-33). In order to maintain balanced fat in the diet, if one species is increased (α-linolenic) then another (linoleic) has to decrease. We had data from another recently completed study (14) that provided information that indicated that increasing the α-linolenic content contributed to reduced mammary gland cancer risk. After doing the calculations we realized that the canola oil and walnut diets contained the same amount of omega-3 in the form of α-linolenic acid. The canola oil containing diet did significantly suppress tumorigenesis compared to the corn oil containing diet; however, the walnut diet resulted in an additional significant suppression of tumorigenesis. Thus, some component of the diet, in addition to the increased α-linolenic content (or reduced linoleic acid), was functioning to suppress carcinogenesis.
There are reports that β-sitosterol can suppress cancer cell growth (34-36) and walnuts contain a significant amount of β-sitosterol (6,37). However, in assessing the β-sitosterol composition of the diets (using composition of the diet and Ref. 15), we found that the β-sitosterol content for the corn oil diet was 968 mg/kg; for the canola oil diet was 413 mg/kg; and for the walnut diet was 71 mg/kg, thus the total β-sitosterol content of the walnut diet was less than that of the corn oil diet. Most of the references for benefit of β-sitosterol against cancer do not use breast cancer cells, which might be stimulated by binding of β-sitosterol to the estrogen receptor, but use other cell types that are not usually considered estrogen dependent. Interestingly, we did find 1 paper (9) indicating that β-sitosterol may increase breast cancer cell growth in estrogen responsive cells; this would agree with our data. The tumors formed by this C3(1)/SV40 TAg model have been well characterized (16,17). Green et al. reported that
Atypia of the mammary ductal epithelium develops at about 8 wk of age, progressing to mammary intraepithelial neoplasia (resembling human ductal carcinoma in situ) at about 12 wk of age with invasive carcinomas at about 16 wk in 100% of female mice. The tumors appear hormone responsive at early stages, invasive carcinomas are hormone independent, which corresponds to loss of ERα during progression. (16) (p. 1020)
Tumors were evident sooner in the mice that consumed the corn oil diet, perhaps in response to the β-sitosterol stimulation of ERα. At later times, when tumors became invasive and should be ERα-, the growth of tumors of mice that consumed the corn oil diet was not as influenced by corn oil diet. More research will be needed to decide this question.
Assessment of vitamin E in the diets did provide a lead to an additional active component that was common to the diets. We found the gamma tocopherol is associated with slowing cancer cell growth (38-40) whereas alpha tocopherol did not have benefit against cancer and may block some of the activity of gamma tocopherol. Assessing the tocopherol content of the diets revealed that for the corn oil diet, alpha tocopherol = 14.3 mg/kg and gamma tocopherol = 0; for the canola oil diet, alpha tocopherol = 17.46 mg/kg, gamma tocopherol = 27.34 mg/kg; for the walnut diet, alpha tocopherol = 1.77 mg/kg and gamma tocopherol = 22.9 mg/kg. The changes of alpha and gamma tocopherol are clearly in the direction that according to the work of others would indicate benefit against cancer. Studies could be devised to test this question.
CONCLUSION
These data indicate that exposure to a small amount of walnut in the diet of this transgenic mouse slowed the development and reduced the multiplicity of mammary gland cancers but does not define the mechanism of action for the walnut nor an active ingredient of the walnut. Walnut in the diet was associated with alterations in cell signaling pathways involved in proliferation, cell differentiation, and apoptosis. The signaling pathways altered in mammary glands of these mice have been identified as important in the development of human breast cancer, thus this study should be relevant to humans. The fatty acid composition of the mammary glands was altered but comparison to another study with the same amount of omega 3 fatty acids in the diet indicates that increased omega 3 fatty acids in the mammary gland does not explain the altered tumor incidence. However, alterations in dietary gamma tocopherol were inversely associated with tumorigenesis.
More work will need to be done to determine the components of walnut and the mechanisms associated with tumor suppression. However, humans eat the whole nut, not specific components. It seems likely that incorporation of walnuts as part of a healthy diet could reduce the risk for breast cancer in humans.
ACKNOWLEDGMENTS
The authors gratefully acknowledge financial support from a matching grant from the American Institute for Cancer Research and the California Walnut Commission, MG 07A001 to W. Elaine Hardman. Canola oil data from grant W81XWH-04-1-0450 from the Department of Defense Breast Cancer Research Program to W. Elaine Hardman. Juliana A. Akinsete received student support from a minority training supplement to 5R01CA114018-03 to W. Elaine Hardman. No funding agency had input on experimental design, collection, or interpretation of the data.
REFERENCES
- 1.World Cancer Research Fund/American Association for Cancer Research. Food, Nutrition, Physical Activity, and the Prevention of Cancer: A Global Perspective. Washington, DC: American Institute of Cancer Research; 2007. [Google Scholar]
- 2.Gregoire RC, Stern HS, Yeung KS, Stadler J, Langley S, et al. Effect of calcium supplementation on mucosal cell proliferation in high risk patients for colon cancer. Gut. 1989;30:376–382. doi: 10.1136/gut.30.3.376. [DOI] [PMC free article] [PubMed] [Google Scholar]
- 3.Alberts DS, Einspahr J, Ritenbaugh C, Aickin M, Rees-McGee S, et al. The effect of wheat bran fiber and calcium supplementation on rectal mucosal proliferation rates in patients with resected adenomatous colorectal polyps. Cancer Epidemiol, Biomarkers & Prev. 1997;6:161–169. [PubMed] [Google Scholar]
- 4.Lippman SM, Klein EA, Goodman PJ, Lucia MS, Thompson IM, et al. Effect of selenium and vitamin E on risk of prostate cancer and other cancers: the Selenium and Vitamin E Cancer Prevention Trial (SELECT) JAMA. 2009;301:39–51. doi: 10.1001/jama.2008.864. [DOI] [PMC free article] [PubMed] [Google Scholar]
- 5.Narayanan BA, Narayanan NK, Desai D, Pittman B, Reddy BS. Effects of a combination of docosahexaenoic acid and 1,4-phenylene bis(methylene) selenocyanate on cyclooxygenase 2, inducible nitric oxide synthase and beta-catenin pathways in colon cancer cells. Carcinogenesis. 2004;25:2443–2449. doi: 10.1093/carcin/bgh252. [DOI] [PubMed] [Google Scholar]
- 6.Maguire LS, O'Sullivan SM, Galvin K, O'Connor TP, O'Brien NM. Fatty acid profile, tocopherol, squalene and phytosterol content of walnuts, almonds, peanuts, hazelnuts, and the macadamia nut. Int J Food Sci Nutr. 2004;55:171–178. doi: 10.1080/09637480410001725175. [DOI] [PubMed] [Google Scholar]
- 7.Petrik MB, McEntee MF, Johnson BT, Obukowicz MG, Whelan J. Highly unsaturated (n-3) fatty acids, but not alpha-linolenic, conjugated linoleic or gamma-linolenic acids, reduce tumorigenesis in Apc(Min/+) mice. J Nutr. 2000;130:2434–2443. doi: 10.1093/jn/130.10.2434. [DOI] [PubMed] [Google Scholar]
- 8.Berquin IM, Edwards IJ, Chen YQ. Multi-targeted therapy of cancer by omega-3 fatty acids. Cancer Lett. 2008;269:363–377. doi: 10.1016/j.canlet.2008.03.044. [DOI] [PMC free article] [PubMed] [Google Scholar]
- 9.Ju YH, Clausen LM, Allred KF, Almada AL, Helferich WG. beta-Sitosterol, beta-sitosterol glucoside, and a mixture of beta-sitosterol and beta-sitosterol glucoside modulate the growth of estrogen-responsive breast cancer cells in vitro and in ovariectomized athymic mice. J Nutr. 2004;134:1145–1151. doi: 10.1093/jn/134.5.1145. [DOI] [PubMed] [Google Scholar]
- 10.Choi YH, Kong KR, Kim YA, Jung KO, Kil JH, et al. Induction of Bax and activation of caspases during beta-sitosterol-mediated apoptosis in human colon cancer cells. Int J Oncol. 2003;23:1657–1662. [PubMed] [Google Scholar]
- 11.Han DH, Lee MJ, Kim JH. Antioxidant and apoptosis-inducing activities of ellagic acid. Anticancer Res. 2006;26:3601–3606. [PubMed] [Google Scholar]
- 12.Liu D, Kim DH, Park JM, Na HK, Surh YJ. Piceatannol inhibits phorbol ester-induced NF-kappa B activation and COX-2 expression in cultured human mammary epithelial cells. Nutr Cancer. 2009;61:855–863. doi: 10.1080/01635580903285080. [DOI] [PubMed] [Google Scholar]
- 13.Hardman WE, Ion G. Suppression of implanted MDA-MB 231 human breast cancer growth in nude mice by dietary walnut. Nutr Cancer. 2008;60:666–674. doi: 10.1080/01635580802065302. [DOI] [PubMed] [Google Scholar]
- 14.Ion G, Akinsete JA, Hardman WE. Maternal consumption of canola oil suppressed mammary gland tumorigenesis in C3(1) TAg mice offspring. BMC Cancer. 2010;10:81. doi: 10.1186/1471-2407-10-81. [DOI] [PMC free article] [PubMed] [Google Scholar]
- 15.U.S. Department of Agriculture, Agricultural Research Service. USDA National Nutrient Database for Standard Reference, Release 22. USDA Nutrient Data Laboratory Home Page, 2009 Available at http://explore.data.gov.
- 16.Green JE, Shibata MA, Yoshidome K, Liu ML, Jorcyk C, et al. The C3(1)/SV40 T-antigen transgenic mouse model of mammary cancer: ductal epithelial cell targeting with multistage progression to carcinoma. Oncogene. 2000;19:1020–1027. doi: 10.1038/sj.onc.1203280. [DOI] [PubMed] [Google Scholar]
- 17.Maroulakou IG, Anver M, Garrett L, Green JE. Prostate and mammary adenocarcinoma in transgenic mice carrying a rat C3(1) simian virus 40 large tumor antigen fusion gene. Proc Natl Acad Sci USA. 2001;91:11236–11240. doi: 10.1073/pnas.91.23.11236. [DOI] [PMC free article] [PubMed] [Google Scholar]
- 18.Johnson GH, Keast DR, Kris-Etherton PM. Dietary modeling shows that the substitution of canola oil for fats commonly used in the United States would increase compliance with dietary recommendations for fatty acids. J Am Diet Assoc. 2007;107:1726–1734. doi: 10.1016/j.jada.2007.07.015. [DOI] [PubMed] [Google Scholar]
- 19.American Institute of Nutrition. Report of the American Institute of Nutrition ad hoc committee on standards for nutritional studies. J Nutr. 1977;107:1340–1348. doi: 10.1093/jn/107.7.1340. [DOI] [PubMed] [Google Scholar]
- 20.Witte TR, Salazar AJ, Ballester OF, Hardman WE. RBC and WBC fatty acid composition following consumption of an omega-3 supplement: lessons for future clinical trials. Lipids Health Dis. 2010;9:31. doi: 10.1186/1476-511X-9-31. [DOI] [PMC free article] [PubMed] [Google Scholar]
- 21.Sabate J, Cordero-Macintyre Z, Siapco G, Torabian S, Haddad E. Does regular walnut consumption lead to weight gain? Br J Nutr. 2005;94:859–864. doi: 10.1079/bjn20051567. [DOI] [PubMed] [Google Scholar]
- 22.Sabate J. Nut consumption and body weight. Am J Clin Nutr. 2003;78:647S–650S. doi: 10.1093/ajcn/78.3.647S. [DOI] [PubMed] [Google Scholar]
- 23.Gillen LJ, Tapsell LC, Patch CS, Owen A, Batterham M. Structured dietary advice incorporating walnuts achieves optimal fat and energy balance in patients with Type 2 diabetes mellitus. J Am Diet Assn. 2005;105:1086–1096. doi: 10.1016/j.jada.2005.04.007. [DOI] [PubMed] [Google Scholar]
- 24.Aggarwal BB. Nuclear factor-kappaB: the enemy within. Cancer Cell. 2004;6:203–208. doi: 10.1016/j.ccr.2004.09.003. [DOI] [PubMed] [Google Scholar]
- 25.Mitrou PN, Kipnis V, Thiebaut AC, Reedy J, Subar AF, et al. Mediterranean dietary pattern and prediction of all-cause mortality in a U.S. population: results from the NIH-AARP Diet and Health Study. Arch Intern Med. 2007;167:246l–2468. doi: 10.1001/archinte.167.22.2461. [DOI] [PubMed] [Google Scholar]
- 26.Cave WT., Jr. Omega-3 polyunsaturated fatty acids in rodent models of breast cancer. Breast Cancer Res Treat. 1997;46:239–246. doi: 10.1023/a:1005923418886. [DOI] [PubMed] [Google Scholar]
- 27.Karmali RA, Marsh J, Fuchs C. Effect of omega-3 fatty acids on growth of a rat mammary tumor. J Natl Cancer Inst. 1984;73:457–461. doi: 10.1093/jnci/73.2.457. [DOI] [PubMed] [Google Scholar]
- 28.Karmali RA, Reichel P, Cohen LA, Terano T, Hirai A, et al. The effects of dietary omega-3 fatty acids on the DU-l45 transplantable human prostatic tumor. Anticancer Res. 1987;7:1173–1179. [PubMed] [Google Scholar]
- 29.Rose DP, Connolly JM. Effects of dietary omega-3 fatty acids on human breast cancer growth and metastasis in nude mice. J Natl Cancer Inst. 1993;85:1743–1747. doi: 10.1093/jnci/85.21.1743. [DOI] [PubMed] [Google Scholar]
- 30.Rose DP, Connolly JM. Omega-3 fatty acids as cancer chemopreventive agents. Pharmacol Ther. 1999;83:2l7–244. doi: 10.1016/s0163-7258(99)00026-1. [DOI] [PubMed] [Google Scholar]
- 31.Rose DP, Connolly JM, Liu X-H. Effect of linoleic acid on the growth and metastasis of two human breast cancer cell lines in nude mice and the invasive capacity of these cell lines in vitro. Cancer Res. 1994;54:6557–6562. [PubMed] [Google Scholar]
- 32.Rose DP, Hatala MA, Connolly JM, Rayburn J. Effects of diets containing different levels of linoleic acid on human breast cancer growth and lung metastasis in nude mice. Cancer Res. 1999;53:4686–4690. [PubMed] [Google Scholar]
- 33.Hilakivi-Clarke L, Clarke R, Onojafe I, Raygada M, Cho E, et al. A maternal diet high in n-6 polyunsaturated fats alters mammary gland development, puberty onset, and breast cancer risk among female rat offspring. Proc Natl Acad Sci USA. 1997;94:9372–9377. doi: 10.1073/pnas.94.17.9372. [DOI] [PMC free article] [PubMed] [Google Scholar]
- 34.Zhao Y, Chang SK, Qu G, Li T, Cui H. Beta-sitosterol inhibits cell growth and induces apoptosis in SGC-7901 human stomach cancer cells. J A gric Food Chem. 2009;57:5211–5218. doi: 10.1021/jf803878n. [DOI] [PubMed] [Google Scholar]
- 35.Moon DO, Kim MO, Choi YH, Kim GY. Beta-sitosterol induces G2/M arrest, endoreduplication, and apoptosis through the Bcl-2 and PI3K/Akt signaling pathways. Cancer Lett. 2008;264:181–191. doi: 10.1016/j.canlet.2008.01.032. [DOI] [PubMed] [Google Scholar]
- 36.Moon DO, Lee KJ, Choi YH, Kim GY. Beta-sitosterol-induced-apoptosis is mediated by the activation of ERK and the downregulation of Akt in MCA-102 murine fibrosarcoma cells. Int Immunopharmacol. 2007;7:1044–1053. doi: 10.1016/j.intimp.2007.03.010. [DOI] [PubMed] [Google Scholar]
- 37.Pereira JA, Oliveira I, Sousa A, Ferreira IC, Bento A, et al. Bioactive properties and chemical composition of six walnut (Juglans regia L.) cultivars. Food Chem Toxicol. 2008;46:2103–2111. doi: 10.1016/j.fct.2008.02.002. [DOI] [PubMed] [Google Scholar]
- 38.Lu G, Xiao H, Li GX, Picinich SC, Chen YK, et al. A gamma-tocopherolrich mixture of tocopherols inhibits chemically induced lung tumorigenesis in A/J mice and xenograft tumor growth. Carcinogenesis. 2010;31:687–694. doi: 10.1093/carcin/bgp332. [DOI] [PMC free article] [PubMed] [Google Scholar]
- 39.Pierpaoli E, Viola V, Pilolli F, Piroddi M, Galli F, et al. Gamma- and delta-tocotrienols exert a more potent anticancer effect than alpha-tocopheryl succinate on breast cancer cell lines irrespective of HER-2/neu expression. Life Sci. 2010;86:668–675. doi: 10.1016/j.lfs.2010.02.018. [DOI] [PubMed] [Google Scholar]
- 40.Yu W, Jia L, Park SK, Li J, Gopalan A, et al. Anticancer actions of natural and synthetic vitamin E forms: RRR-alpha-tocopherol blocks the anticancer actions of gamma-tocopherol. Mol Nutr Food Res. 2009;53:1573–1581. doi: 10.1002/mnfr.200900011. [DOI] [PMC free article] [PubMed] [Google Scholar]