

Abstract
Background
The utility of conventional prostate-specific antigen (PSA) measurements in blood for monitoring rapid responses to treatment for prostate cancer is limited because of its slow elimination rate. Prior studies have shown that free PSA (fPSA), intact PSA (iPSA) and human kallikrein-related peptidase 2 (hK2) are eliminated more rapidly after radical prostatectomy. In contrast, all three markers have similarly slow elimination rates after castration induced by GnRH agonists, possibly due to the slow onset of castration. Therefore, we assessed elimination rates of tPSA, fPSA, iPSA and hK2 after rapid induction of castration with degarelix (Firmagon®), a novel GnRH antagonist.
Methods
This study included 24 patients treated with degarelix. Blood was taken at 1, 3, 7, 14, 21, and 28 days after injection of degarelix. Free and total PSA were measured with a commercial dual-label assay, and with in-house research assays of intact PSA and hK2.
Results
Median (interquartile range, IQR) tPSA at baseline was 23.4 (15.8, 59.8). Twenty-two patients (92%) reached castrate levels of testosterone within 24 hours of degarelix initiation, and all patients did so within 72 hours. All kallikrein forms declined in an exponential fashion after degarelix administration. The median time to 50% reduction in biomarker level was 8–9 days for tPSA or complexed PSA versus 2–4 days for hK2, iPSA and fPSA. The percentage eliminated at day 3 and day 7 was significantly higher for hK2, iPSA and fPSA than for tPSA (all p<0.02), while tPSA and complexed PSA were similar.
Conclusions
The rapid decline of fPSA, iPSA and hK2 after fast induction of castration with degarelix is similar to that reported after prostatectomy and offers a novel, informative method to monitor rapid onset of therapeutic action targeting signaling of the androgen receptor,
Keywords: androgen deprivation therapy, human kallikrein-related peptidase 2, prostate cancer, prostate-specific antigen, tumor markers
Introduction
Prostate-specific antigen (PSA) and kallikrein-related peptidase 2 (hK2) are serine proteases that are produced primarily in the epithelial cells of the prostate gland (1, 2). Production of these biomarkers is controlled by dihydrotestosterone and testosterone. Release of PSA from the prostate results in concentrations in seminal fluid ranging from 0.2 to 5 mg/mL (3), while retrograde release results in PSA concentrations in blood only one millionth as high (4). In blood, PSA is primarily bound in a stable complex with alpha(1)-antichymotrypsin (ACT), a form referred to as complexed PSA (cPSA). Free, non-bound PSA (fPSA) comprises several non-catalytic forms, e.g. single-chain (i.e. intact PSA) zymogen forms or multi-chain forms internally cleaved at Lys145 or Lys146 (i.e. nicked PSA), and a decreased ratio of nicked-to-free PSA is associated with higher risk of prostate cancer (5–7). Several lines of evidence (as reviewed in (8)) also suggest that fPSA and hK2 are more closely related to malignancy than cPSA or total PSA (tPSA).
The mechanism of elimination of fPSA forms, including intact PSA (iPSA), and hK2 (mostly occurring in free, unbound forms in blood (9)), differs from that of cPSA. Because of their small size (roughly 30 kDa), fPSA, iPSA and hK2 can be eliminated via glomerular filtration. In contrast, cPSA’s much larger size (90 kDa) largely precludes glomerular filtration as the major route of elimination. This idea is also supported by experimental data from patients with renal insufficiency undergoing renal transplantation; fPSA and hK2, but not cPSA, decreased rapidly after successful transplantation (10). Consistent with this, analysis of blood samples drawn from organ-specific veins has revealed that the concentration of fPSA, but not cPSA, decreased across the renal circulation, while cPSA was implicated to be lower in the suprahepatic vein than in the infrahepatic vein (11). This has also been used to speculate about whether or not cPSA is eliminated via specific receptor uptake in the liver, although the rate of clearance of cPSA (≤1.0 ng/mL/day) cast some doubts on the efficiency of this mechanism (12). The specific receptors involved in the removal of cPSA have not been established, but were hypothesized to be serpin receptors (13).
Although the benefits of PSA-based screening for prostate cancer are controversial (14), PSA is uniformly accepted as a marker for monitoring treatment (8, 15, 16). Following radical prostatectomy of organ-confined tumors, blood levels of PSA and hK2 become undetectable because the principal source of PSA and hK2 production has been removed. A post-surgery rise in any of these markers (i.e. biochemical recurrence) can thus be attributed to extracapsular or disseminated malignant growth (17, 18). Our prior reports showed that the rapid clearance of fPSA and hK2 was in sharp contrast to the much slower clearance of cPSA after radical prostatectomy studies where the elimination rates were determined by analyzing blood samples collected before and after surgery (12, 18). The levels of cPSA declined in a linear fashion at a rate of less than 1 ng/mL per day, whereas fPSA and hK2 were eliminated at a median half-life of 12 to 18 hours (12, 18). Therefore, analysis of fPSA and hK2 would allow a more rapid and instructive assessment of treatment responses as their post-treatment elimination from blood is much faster than that of cPSA or tPSA. However, a study of patients with metastatic disease receiving medical castration therapy s showed similar and much longer elimination rates for all PSA forms and hK2. After the initiation of the treatment with a GnRH agonist, a minor initial rise in PSA-levels was followed by a slow exponential decrease in the levels of all PSA forms and hK2 at a median “half-life” of 12 to 14 days (19).
The reasons for the differences in elimination rates after radical prostatectomy vs. GnRH agonist treatment are unclear, but one explanation could stem from the fact that GnRH agonists are known to cause an initial ‘flare’ of testosterone levels before the onset of castration, and therefore the shutoff of PSA and hK2 production may be prolonged. Competitive GnRH antagonists are agents of a new class that immediately inhibit luteinizing hormone secretion, resulting in castration without any initial flare reaction (20). After subcutaneous administration of the GnRH antagonist degarelix, most patients reach medical castration within 48 hours (21).
We hypothesized that the fast onset of action of GnRH antagonists may lead to elimination profiles of the various forms of PSA and hK2 that are similar to the profiles seen after radical prostatectomy. Our aim with this study was to investigate the elimination rates of PSA subfractions and hK2 after medical castration by a GnRH antagonist, using a subgroup selected from a multicenter, open-labeled phase II study of degarelix.
Materials and Methods
Compound
Degarelix (Firmagon®) is a linear decapeptide amide containing seven unnatural amino acids (22) approved internationally to treat advanced-stage prostate cancer patients. It is a long-acting competitive GnRH antagonist with a high affinity and selectivity for GnRH receptors. It has high water solubility and low histamine-releasing properties. Degarelix is reconstituted in a mannitol solution prior to subcutaneous administration. It spontaneously forms a gel-like depot when it comes in contact with body fluids, which results in a sustained release of degarelix and a prolonged testosterone suppression (23).
Subject enrollment
Independent ethics committees in the each participating countries approved this study. The criteria for inclusion in the phase II study of degarelix were a histologically proven prostate adenocarcinoma, an ECOG score ≤ 2, a PSA level ≥ 2 ng/mL, a testosterone level >6 nmol/L, and a life expectancy ≥ 6 months. Patients considered candidates for curatively intended radiotherapy or prostatectomy were not included. Patients who had, within the prior 3 months, received testosterone-manipulating drugs or undergone surgical or other hormonal manipulation (i.e. GnRH-agonists/antagonists, anti-androgens, estrogens) were excluded. Also excluded were patients with pathological elevations of alanine aminotransferase and/or bilirubin. To avoid study discontinuation, we excluded patients with severe illnesses not related to prostate cancer, a known hypersensitivity to any component included in degarelix, or a medical history of anaphylactic reactions.
Study cohort
The main study included 177 patients, 24 of which were treated with a dose of 200 mg (40 mg/mL); these 24 constituted the cohort used to study elimination rates. This subgroup was selected because this dose regime appeared to be the most effective in suppressing testosterone below 0.5 ng/mL. (Later it was shown in a larger cohort that a dose of 240 mg (40 mg/mL) resulted in testosterone suppression in a higher proportion of patients, and this dosage was chosen for marketing.) Among these 24 patients, the median age was 74 years (interquartile range, 70–79 years; range, 62–86 years), and the median body mass index was 25.3 kg/m2 (interquartile range, 24.2 to 27.9 kg/m2). The median time elapsed from prostate cancer diagnosis to study enrollment was 41.5 days (range, 14–1392). At enrollment two patients had localized disease, 15 locally advanced, and six metastatic disease, while one was incompletely classified. According to the reported cancer staging, all but one of the selected subjects underwent bone scanning, and six of these patients (26%) were found to have skeletal metastasis (M1). Rectal examinations were carried out on 21 patients at the time of enrollment, and 17 of these patients (81%) were found to have extracapsular tumor extensions. Biopsies evaluated and graded according to Gleason showed a Gleason score of 2–4 in one patient (4%), of 5–6 in six patients (25%), and of 7–10 in 17 patients (71%). Three of the subjects had undergone radical prostatectomy, and one of these three patients had also received adjuvant radiotherapy. All patients were Caucasian.
Measurement of kallikreins
Free and total PSA were determined with the dual-label DELFIA immunofluorometric assay (Prostatus™ PSA Free/Total PSA from Perkin-Elmer Life Sciences Turku, Finland). This assay determines free and complexed PSA in an equimolar fashion, and the cross-reaction for PSA-ACT in the fPSA assay is below 0.2% (24). The lower limit of detection for tPSA is 0.10 ng/ml (coefficient of variation of 5.0% at 2.32 ng/mL) and for fPSA 0.04 ng/mL (coefficient of variation of 5.9% at 0.25 ng/mL). For detection, the 1235 automatic immunoassay system from Perkin-Elmer Life Sciences was used. Levels of cPSA were calculated by subtracting fPSA from tPSA as reported previously (25). The assay for hK2 used further optimized in-house research assay protocols (9) compared to earlier reported versions (26). We used a biotinylated capture monoclonal antibody (MAb; 6H10); this antibody has a 5% cross-reaction to PSA, which is eliminated (≤0.005%) by adding three PSA-blocking MAbs (5H6, 5F7, and 2E9). Finally, Eu-labeled tracer MAb (7G1) was added. The detection limit of the assay is 0.005 ng/ml with assay imprecision values (mean coefficients of variation) ranging from 5.7 % to 11 % for high and low hK2 controls, respectively. An assay based on a unique europium-labeled detection antibody (4D4 or 5C3) that recognizes only iPSA but not PSA that is internally cleaved at Lys145 or Lys146 (i.e. nicked PSA) was reported earlier (7, 27). The detection limit of this assay version is 0.035 ng/ml, with a coefficient of variation of 8.9% as previously reported (6).
Analysis was carried out on blood samples drawn 0, 1, 2, 3, 7, 14, 21, and 28 days following degarelix treatment.
Statistical methods
The pre-dose biomarker levels and percentage change from pre-dose level at various time-points were summarized descriptively. Each patient’s time to 50% reduction in biomarker levels was estimated using linear interpolation between measurements, and was reported descriptively using median and interquartile range.
The median percentage change in biomarker levels from pre-dose levels was plotted over time. To test for differences in elimination rates between markers, we compared the difference in percent change from pretreatment measurement at specific time-points (3, 7, 14, and 28 days posttreatment) using the Wilcoxon matched-pairs signed-ranks test. Post-treatment measurements that were taken in a non-castrate state (testosterone level >0.5 ng/mL) were excluded in all analyses. All statistical analyses were conducted using Stata 9.0 (Stata Corp., College Station, TX, USA).
Results
Testosterone levels were less than the castration cut-off of 0.5 ng/ml at 24 hours after degarelix administration in 22 participants (92%), and in all participants after 72 hours. The median levels of tPSA, cPSA, fPSA, iPSA, and hK2 at baseline were 23.4, 19.2, 3.68, 2.51, and 0.286 ng/mL, respectively (Table 1). At day 28, the respective median biomarker concentrations were 4.31, 3.85, 0.66, 0.25, and 0.054 ng/mL. The median time to 50% reduction in biomarker levels was 8 days for tPSA, 9 days for cPSA, 4 days for fPSA, 3 days for iPSA, and 2 days for hK2 (Table 1). The median percentage change in tPSA, cPSA, fPSA, iPSA, and hK2 from pre-dose level against time is plotted in Figure 1. For all analytes, levels declined in an exponential fashion after degarelix administration.
Table 1.
Summary of biomarker measurements and elimination times.
| No.patients | Total PSA | Complexed PSA (calculated) | Free PSA | Intact PSA | Human kallikrein 2 | |
|---|---|---|---|---|---|---|
| Median Biomarker Level, ng/mL (Interquartile Range) | ||||||
| Pre-dose | 24 | 23.4 (15.8, 59.8) | 19.2 (13, 51.5) | 3.68 (1.91, 8.36) | 2.51 (0.850, 5.87) | 0.286 (0.192, 0.927) |
| Median Percentage of Pre-Dose Level, % (Interquartile Range) | ||||||
| Day 1 | 22 | 96.7 (94.4, 101) | 102 (94.9, 104) | 81.4 (78.2, 88.3) | 77.3 (67.6, 90.1) | 78.2 (65.4, 87.4) |
| Day 3 | 23 | 81.7 (70.6, 86.1) | 85.7 (74, 91.6) | 48.6 (43.9, 57.8) | 44.4 (30.2, 50.0) | 37.3 (31.7, 43.7) |
| Day 7 | 24 | 51.3 (46.5, 62.4) | 51.8 (47.6, 63.9) | 40.0 (25.4, 59.8) | 34.3 (20.6, 43.2) | 28.2 (23.5, 40.2) |
| Day 14 | 23 | 31.2 (20.7, 45.8) | 29.1 (20.9, 44.1) | 28.0 (16.4, 57) | 21.9 (14.8, 36.2) | 21.7 (11.5, 37.1) |
| Day 21 | 22 | 20.2 (13.8, 37.2) | 19.8 (12.5, 35.6) | 30.9 (13.6, 52.2) | 18.2 (9.22, 26.2) | 17.3 (9.55, 31.5) |
| Day 28 | 23 | 15.4 (7.03, 25.9) | 13.8 (7.08, 24.8) | 25.4 (9.29, 38.3) | 12.0 (7.28, 23.6) | 15.4 (7.6, 23.4) |
| Median Time, Days (Interquartile Range) | ||||||
|
| ||||||
| Days to50% drop | 23 | 8 (7, 12) | 9 (7, 12) | 4 (3, 17) | 3 (2, 4) | 2 (2, 4) |
Figure 1.
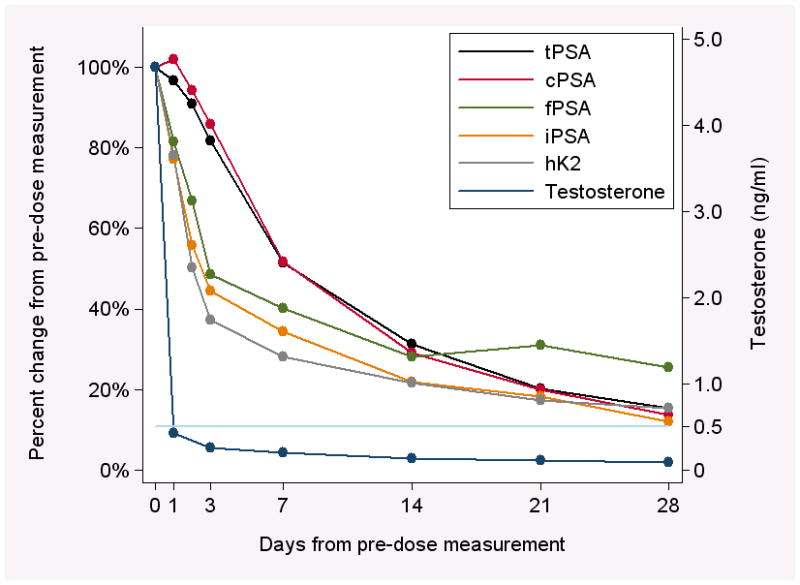
Median percent change in biomarkers over time. Black line: tPSA; red line: cPSA (calculated); green line: fPSA; orange line: iPSA; gray line: hK2. The dark blue line shows median testosterone levels pre-treatment (day 0) and post-treatment at days 1, 3, 7, 14, 21, and 28; the light blue line represents the castration cut-off of 0.5 ng/ml. Confidence intervals are not shown in order to facilitate readability of the figure. There is an apparent rebound in free PSA levels at 21 days, while testosterone levels remained below the castration cut-off. Given the variability associated with these estimates due to the small sample size, we interpret these findings as consistent with these levels continuing to decline or levelling off past 14 days.
At day 3 and day 7, the percentage decline in hK2 from pretreatment levels was significantly greater than that of tPSA (both p<0.001); there were no important differences at day 14 and day 28. We observed similar results for the difference in percentage decline between fPSA and tPSA: the percent decline at day 3 and day 7 was significantly greater than that of tPSA (p<0.001 and 0.014, respectively). The elimination rates of cPSA and tPSA were similar (absolute differences <5% through day 28), while the elimination rates of iPSA were similar to those of fPSA and hK2.
Discussion
We have demonstrated that, after rapid onset of medical castration with degarelix, PSA forms and hK2 decrease in an exponential fashion, with rates of elimination dropping significantly faster for either fPSA, iPSA or hK2 as compared with both cPSA and tPSA. In the two-week period following degarelix administration, the median time to 50% reduction was within 2 to 4 days for fPSA, iPSA and hK2, compared to 8 days for tPSA or cPSA. Our data clearly support the hypothesis that the complexed and uncomplexed forms of prostate kallikreins follow separate pathways of elimination.
The elimination of fPSA, iPSA and hK2 induced by degarelix, a GnRH antagonist, was substantially faster than that reported after treatment with GnRH agonists. This more rapid elimination of uncomplexed biomarkers in our study may result from the more efficient castration induced by the GnRH antagonist than by GnRH agonists. In general, the various forms of PSA and hK2 displayed elimination profiles very similar to those seen after radical prostatectomy.
The elimination rates obtained in this study are unlikely to be importantly affected by variability in the assays, given the modest analytical imprecision of the assays for tPSA, fPSA, intact PSA, and hK2 (coefficients of variation 2–6%). Similarly, the results are unlikely to be importantly affected by biological variation in levels of these proteins. Intra-individual coefficients of variation, whether they be measured on a daily, weekly, or bi-annual basis, have consistently been found to amount to 11–13% or less for tPSA, fPSA, intact PSA, and hK2 (28). Hence, over the shorter time span of this study, intra-individual variation is not likely to not be greater.
Our study demonstrates that uncomplexed forms of prostate kallikreins provide additional information when monitoring the treatment effect of androgen blockade with a GnRH antagonist. Compared to tPSA, hK2 is more closely related to tumor volume (29), high-grade prostate cancer (30), and extracapsular tumor growth (29, 31). Similarly, free and complexed PSA have been shown to be differentially associated with benign and malignant prostate tissue (29, 30). Further, including measurements of iPSA and hK2 are now suggested to importantly improve the prediction of cancer risk at prostate biopsy (5). Currently, treatment effect is monitored by means of serial tPSA determinations. Due to the prolonged elimination kinetics of cPSA, the major component of tPSA, the effect of a given treatment cannot be fully evaluated until approximately 4–6 weeks after initiation. Based on our data, we reason that measurement of free forms of prostate kallikreins would provide the clinician not only with additional information on aggressiveness, but also with faster and more accurate feedback on treatment effect, due to the more rapid clearance from circulation. We note, however, that patients with renal disease have slower elimination rates for fPSA and hK2 (10) due to reduced glomerular filtration.
Conclusions
After rapid onset of medical castration with degarelix, fPSA, iPSA and hK2 are eliminated rapidly, whereas cPSA and tPSA are eliminated more slowly. Therefore, monitoring of fPSA, iPSA and hK2 can, theoretically, allow treatment effect, biochemical recurrence, and malignancies insensitive to hormonal treatment to be evaluated and diagnosed at an earlier phase. Although further studies are needed, fPSA, iPSA and hK2 could provide a more reliable monitoring option for patients undergoing intermittent treatment programs. In theory, this could reduce risks for long-term side effects caused by androgen deprivation treatment, including reduced quality of life and overall survival.
Acknowledgments
Funding
This research was supported by the National Cancer Institute [P50-CA92629; R33 CA 127768-02]; Swedish Cancer Society [3455]; Swedish Research Council [Medicine-20095]; Fundación Federico SA; Ferring Pharmaceuticals A/S, Copenhagen, Denmark; the Sidney Kimmel Center for Prostate and Urologic Cancers; and David H. Koch through the Prostate Cancer Foundation. The funders had no involvement in study design, data collection, data analysis, manuscript preparation, or publication decisions.
We thank Janet Novak of Helix Editing for editing the manuscript. Dr. Novak was paid for her work by MSKCC. We also thank Gun-Britt Eriksson and Kerstin Håkansson for expert assistance with immunoassays.
Abbreviations
- ACT
alpha(1)-antichymotrypsin
- cPSA
complexed prostate-specific antigen
- fPSA
free prostate-specific antigen
- GnRH
gonadotropin-releasing hormone
- hK2
kallikrein-related peptidase 2
- iPSA
intact PSA
- MAb
monoclonal antibody
- PSA
prostate-specific antigen
- tPSA
total PSA
Footnotes
Conflict of Interest Statement
Dr. Hans Lilja holds patents for free PSA, hK2 and intact PSA assays.
References
- 1.Chapdelaine P, Paradis G, Tremblay RR, Dube JY. High level of expression in the prostate of a human glandular kallikrein mRNA related to prostate-specific antigen. FEBS Lett. 1988;236:205–8. doi: 10.1016/0014-5793(88)80315-6. [DOI] [PubMed] [Google Scholar]
- 2.Wang MC, Valenzuela LA, Murphy GP, Chu TM. Purification of a human prostate specific antigen. 1979. J Urol. 2002;167:960–4. doi: 10.1016/s0022-5347(02)80311-1. discussion 4–5. [DOI] [PubMed] [Google Scholar]
- 3.Ahlgren G, Rannevik G, Lilja H. Impaired secretory function of the prostate in men with oligo-asthenozoospermia. J Androl. 1995;16:491–8. [PubMed] [Google Scholar]
- 4.Becker C, Noldus J, Diamandis E, Lilja H. The role of molecular forms of prostate-specific antigen (PSA or hK3) and of human glandular kallikrein 2 (hK2) in the diagnosis and monitoring of prostate cancer and in extra-prostatic disease. Crit Rev Clin Lab Sci. 2001;38:357–99. doi: 10.1080/20014091084236. [DOI] [PubMed] [Google Scholar]
- 5.Vickers A, Cronin A, Roobol M, Savage C, Peltola M, Pettersson K, et al. Reducing unnecessary biopsy during prostate cancer screening using a four-kallikrein panel: an independent replication. J Clin Oncol. 2010;28:2493–8. doi: 10.1200/JCO.2009.24.1968. [DOI] [PMC free article] [PubMed] [Google Scholar]
- 6.Steuber T, Vickers A, Haese A, Kattan MW, Eastham JA, Scardino PT, et al. Free PSA isoforms and intact and cleaved forms of urokinase plasminogen activator receptor in serum improve selection of patients for prostate cancer biopsy. Int J Cancer. 2007;120:1499–504. doi: 10.1002/ijc.22427. [DOI] [PubMed] [Google Scholar]
- 7.Nurmikko P, Pettersson K, Piironen T, Hugosson J, Lilja H. Discrimination of prostate cancer from benign disease by plasma measurement of intact, free prostate-specific antigen lacking an internal cleavage site at Lys145-Lys146. Clin Chem. 2001;47:1415–23. [PubMed] [Google Scholar]
- 8.Lilja H, Ulmert D, Vickers AJ. Prostate-specific antigen and prostate cancer: prediction, detection and monitoring. Nat Rev Cancer. 2008;8:268–78. doi: 10.1038/nrc2351. [DOI] [PubMed] [Google Scholar]
- 9.Vaisanen V, Eriksson S, Ivaska KK, Lilja H, Nurmi M, Pettersson K. Development of sensitive immunoassays for free and total human glandular kallikrein 2. Clin Chem. 2004;50:1607–17. doi: 10.1373/clinchem.2004.035253. [DOI] [PubMed] [Google Scholar]
- 10.Bruun L, Ekberg H, Bjork T, Lilja H, Hoglund P, Christensson A. Rapid elimination by glomerular filtration of free prostate specific antigen and human kallikrein 2 after renal transplantation. J Urol. 2004;171:1432–5. doi: 10.1097/01.ju.0000118580.19344.68. [DOI] [PubMed] [Google Scholar]
- 11.Kilic S, Yalcinkaya S, Guntekin E, Kukul E, Deger N, Sevuk M. Determination of the site of metabolism of total, free, and complexed prostate-specific antigen. Urology. 1998;52:470–3. doi: 10.1016/s0090-4295(98)00208-8. [DOI] [PubMed] [Google Scholar]
- 12.Bjork T, Ljungberg B, Piironen T, Abrahamsson PA, Pettersson K, Cockett AT, et al. Rapid exponential elimination of free prostate-specific antigen contrasts the slow, capacity-limited elimination of PSA complexed to alpha 1-antichymotrypsin from serum. Urology. 1998;51:57–62. doi: 10.1016/s0090-4295(97)00572-4. [DOI] [PubMed] [Google Scholar]
- 13.Pizzo SV, Mast AE, Feldman SR, Salvesen G. In vivo catabolism of alpha 1-antichymotrypsin is mediated by the Serpin receptor which binds alpha 1-proteinase inhibitor, antithrombin III and heparin cofactor II. Biochim Biophys Acta. 1988;967:158–62. doi: 10.1016/0304-4165(88)90005-0. [DOI] [PubMed] [Google Scholar]
- 14.Schröder FH, Hugosson J, Roobol MJ, Tammela TL, Ciatto S, Nelen V, et al. Prostate-cancer mortality at 11 years of follow-up. N Engl J Med. 2012;366:981–90. doi: 10.1056/NEJMoa1113135. [DOI] [PMC free article] [PubMed] [Google Scholar]
- 15.Schroder FH, Hugosson J, Roobol MJ, Tammela TL, Ciatto S, Nelen V, et al. Screening and prostate-cancer mortality in a randomized European study. N Engl J Med. 2009;360:1320–8. doi: 10.1056/NEJMoa0810084. [DOI] [PubMed] [Google Scholar]
- 16.Holmstrom B, Johansson M, Bergh A, Stenman UH, Hallmans G, Stattin P. Prostate specific antigen for early detection of prostate cancer: longitudinal study. BMJ. 2009;339:b3537. doi: 10.1136/bmj.b3537. [DOI] [PMC free article] [PubMed] [Google Scholar]
- 17.Stephenson AJ, Kattan MW, Eastham JA, Dotan ZA, Bianco FJ, Jr, Lilja H, et al. Defining biochemical recurrence of prostate cancer after radical prostatectomy: a proposal for a standardized definition. J Clin Oncol. 2006;24:3973–8. doi: 10.1200/JCO.2005.04.0756. [DOI] [PubMed] [Google Scholar]
- 18.Lilja H, Haese A, Bjork T, Friedrich MG, Piironen T, Pettersson K, et al. Significance and metabolism of complexed and noncomplexed prostate specific antigen forms, and human glandular kallikrein 2 in clinically localized prostate cancer before and after radical prostatectomy. J Urol. 1999;162:2029–34. doi: 10.1016/S0022-5347(05)68093-7. discussion 34–5. [DOI] [PubMed] [Google Scholar]
- 19.Bjork T, Schalken J, Wittjes W, Ljungberg B, Lilja H. Similar rates of exponential decrease in serum concentrations of free prostate-specific antigen (PSA), PSA complexed to alpha-1-antichymotrypsin, and human glandular kallikrein 2 (hK2) in prostate cancer patients treated with GnRH-analogues. Prostate. 2001;47:14–20. doi: 10.1002/pros.1042. [DOI] [PubMed] [Google Scholar]
- 20.Klotz L, Boccon-Gibod L, Shore ND, Andreou C, Persson BE, Cantor P, et al. The efficacy and safety of degarelix: a 12-month, comparative, randomized, open-label, parallel-group phase III study in patients with prostate cancer. BJU Int. 2008;102:1531–8. doi: 10.1111/j.1464-410X.2008.08183.x. [DOI] [PubMed] [Google Scholar]
- 21.Van Poppel H, Tombal B, de la Rosette JJ, Persson BE, Jensen JK, Kold Olesen T. Degarelix: a novel gonadotropin-releasing hormone (GnRH) receptor blocker--results from a 1-yr, multicentre, randomised, phase 2 dosage-finding study in the treatment of prostate cancer. Eur Urol. 2008;54:805–13. doi: 10.1016/j.eururo.2008.04.065. [DOI] [PubMed] [Google Scholar]
- 22.Jiang G, Stalewski J, Galyean R, Dykert J, Schteingart C, Broqua P, et al. GnRH antagonists: a new generation of long acting analogues incorporating p-ureido-phenylalanines at positions 5 and 6. J Med Chem. 2001;44:453–67. doi: 10.1021/jm0003900. [DOI] [PubMed] [Google Scholar]
- 23.Broqua P, Riviere PJ, Conn PM, Rivier JE, Aubert ML, Junien JL. Pharmacological profile of a new, potent, and long-acting gonadotropin-releasing hormone antagonist: degarelix. J Pharmacol Exp Ther. 2002;301:95–102. doi: 10.1124/jpet.301.1.95. [DOI] [PubMed] [Google Scholar]
- 24.Piironen T, Lovgren J, Karp M, Eerola R, Lundwall A, Dowell B, et al. Immunofluorometric assay for sensitive and specific measurement of human prostatic glandular kallikrein (hK2) in serum. Clin Chem. 1996;42:1034–41. [PubMed] [Google Scholar]
- 25.Lilja H, Ulmert D, Bjork T, Becker C, Serio AM, Nilsson JA, et al. Long-term prediction of prostate cancer up to 25 years before diagnosis of prostate cancer using prostate kallikreins measured at age 44 to 50 years. J Clin Oncol. 2007;25:431–6. doi: 10.1200/JCO.2006.06.9351. [DOI] [PubMed] [Google Scholar]
- 26.Becker C, Piironen T, Kiviniemi J, Lilja H, Pettersson K. Sensitive and specific immunodetection of human glandular kallikrein 2 in serum. Clin Chem. 2000;46:198–206. [PubMed] [Google Scholar]
- 27.Nurmikko P, Vaisanen V, Piironen T, Lindgren S, Lilja H, Pettersson K. Production and characterization of novel anti-prostate-specific antigen (PSA) monoclonal antibodies that do not detect internally cleaved Lys145-Lys146 inactive PSA. Clin Chem. 2000;46:1610–8. [PubMed] [Google Scholar]
- 28.Christensson A, Bruun L, Björk T, Cronin AM, Vickers AJ, Savage CJ, et al. Intra-individual short-term variability of prostate-specific antigen and other kallikrein markers in a serial collection of blood from men under evaluation for prostate cancer. BJU Int. 2011;107:1769–74. doi: 10.1111/j.1464-410X.2010.09761.x. [DOI] [PMC free article] [PubMed] [Google Scholar]
- 29.Steuber T, Niemela P, Haese A, Pettersson K, Erbersdobler A, Felix Chun KH, et al. Association of free-prostate specific antigen subfractions and human glandular kallikrein 2 with volume of benign and malignant prostatic tissue. Prostate. 2005;63:13–8. doi: 10.1002/pros.20156. [DOI] [PubMed] [Google Scholar]
- 30.Haese A, Graefen M, Steuber T, Becker C, Noldus J, Erbersdobler A, et al. Total and Gleason grade 4/5 cancer volumes are major contributors of human kallikrein 2, whereas free prostate specific antigen is largely contributed by benign gland volume in serum from patients with prostate cancer or benign prostatic biopsies. J Urol. 2003;170:2269–73. doi: 10.1097/01.ju.0000095794.04551.0c. [DOI] [PubMed] [Google Scholar]
- 31.Haese A, Vaisanen V, Lilja H, Kattan MW, Rittenhouse HG, Pettersson K, et al. Comparison of predictive accuracy for pathologically organ confined clinical stage T1c prostate cancer using human glandular kallikrein 2 and prostate specific antigen combined with clinical stage and Gleason grade. J Urol. 2005;173:752–6. doi: 10.1097/01.ju.0000152618.38747.dd. [DOI] [PubMed] [Google Scholar]