Abstract
It has been shown that after a visible stimulus, optical oscillations of nearly all cone photoreceptors can be observed using long coherence length light and in a few cones using short coherence length light. Here, we show that after exposure to a visible stimulus, a short coherence length imaging source reveals light-evoked oscillation signals in a large number of cones. More than 80% of cones in a given retinal area are activated (modulation in the reflectance signal) after stimulation, and the pattern of their activation can be subjectively classified into one of four categories. The application of light-evoked signal detection techniques for in vivo retinal imaging may prove useful for assessing the functional status of cones in normal and diseased retinae.
It is well known that physiological signals from photoreceptors are dynamic in nature [1–3]. Using a variety of imaging techniques, a number of optical signals have been observed and attributed to changes in the photoreceptors [4–10]. Using adaptive optics (AO) imaging to visualize individual cone photoreceptors in the living human retina, such photoreceptor-based optical signals have been observed directly [11–15]. These changes have been attributed to a number of physiological mechanisms, including outer segment disk shedding [12], photopigment bleaching [15], and phototransduction [13]. Recently, a high-speed AO camera [192 frames per second (fps)] was developed to examine the high temporal frequency light-evoked signals of the human cones [13]. The authors observed reflectance oscillations in a majority of cones using a long coherence length imaging source and in a few cones using a short coherence length source. They conclude that these oscillations depend critically on the coherence length of the imaging light source based on a two-surface reflector model (light sources with coherence lengths longer than the length of the cone outer segment (~45 μm) would readily reveal reflectance oscillations, while shorter coherence length sources would be less likely to do so). In contrast to this, we demonstrate modulation in optical reflectance of a majority of cones using an imaging light source with a coherence length shorter than the length of the cone outer segment. Thus, the optical or physiological origin of these cone reflectance changes awaits complete explanation.
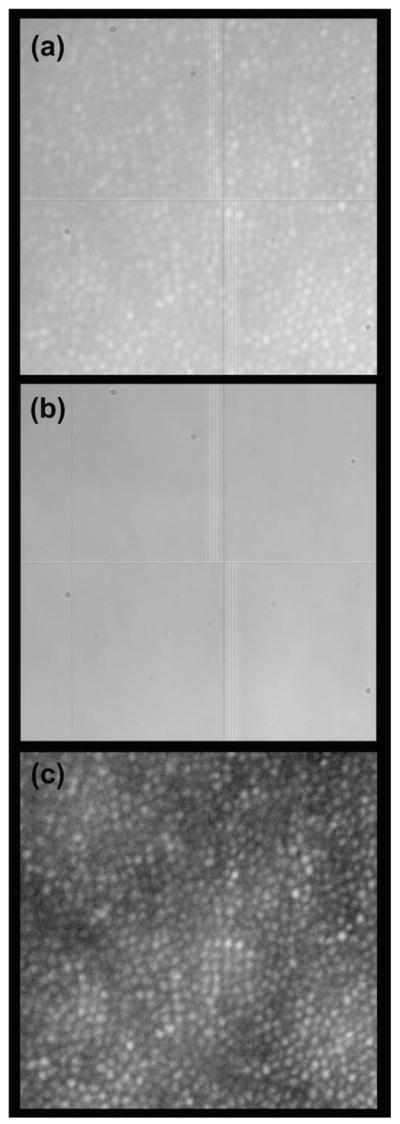
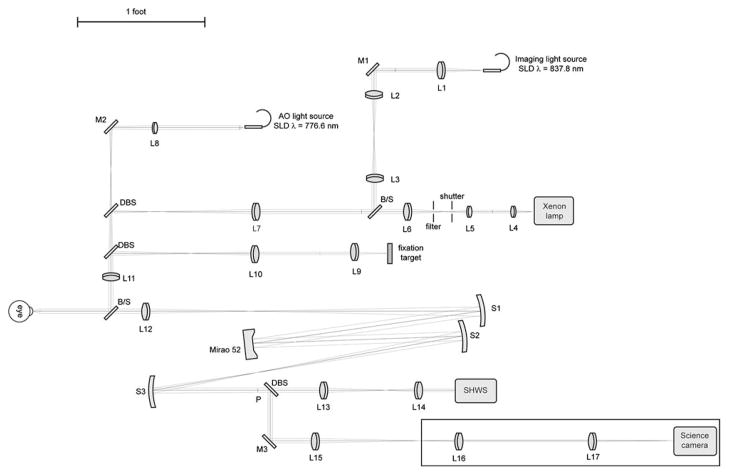
This study was approved by the Children’s Hospital of Wisconsin Institutional Review Board, and informed consent was obtained after explanation of the nature and possible consequences of the study. We used a high-speed AO retina camera (Fig. 1) to resolve the temporal dynamics of individual cone photoreceptors. The AO camera consists of an illumination, AO, and science channels. The illumination channel contains a 776.6 nm superluminescent diode (SLD) (Δλ=19.2 nm) for the AO reference source (Superlum, Ltd., Ireland), a xenon arclamp for the stimulus light source (670 nm interference filter, 40 nm FWHM), and an 837.8 nm SLD (Δλ=14.1 nmimaging light source (Superlum, Ltd., Ireland). The imaging source is used in conjunction with a step index multimode fiber (Fiberguide Industries, Stirling, NJ, USA) to reduce speckle noise [11]. The AO channel corrects the eye’s monochromatic aberrations at 13.3 Hz using a Mirao52 (Image Eyes, Orsay, France) deformable mirror and Shack–Hartmann wavefront sensor. A back-illuminated scientific-grade 12 bit CCD Cam1M100-SFT (Sarnoff Corporation, Princeton, New Jersey, USA) was used to collect images of the cones. Data was collected at 167 fps with 6 ms exposure time. After wavefront correction, an image was taken by illuminating a 1.8° diameter patch of retina with the short temporal coherence length imaging source (15.4 μm at n =1.43, the estimated refractive index of the cone outer segment [16]). Figure 2(a) shows a raw retinal image containing cone structure (object) and the Gaussian beam profile, CCD circuit, and dust (noise). A background correction procedure was developed to correct these artifacts. Figure 2(b) shows a “defocused image,” which includes only noise, and was created by averaging 30 defocused frames. After removing artifacts with flat-field correction [Fig. 2(c)], multiple reflectance images were registered and averaged using custom MATLAB (The Mathworks, Inc., Natick, Massachusetts, USA) software.
Fig. 1.
Schematic diagram of high-speed AO retinal camera. BS, beam splitter; DBS, dichroic beam splitter; SHWS, Shack–Hartmann wavefront sensor; P, pupil plane; L1–L17, achromatic lenses; M1–M3, flat mirrors; S1–S3, spherical mirrors.
Fig. 2.

Processing retinal images from the Medical College of Wisconsin Adaptive Optics Ophthalmoscope. (a) Raw image from the CCD camera (0.5° × 0.5°). (b) Noise image comprised of dust, beam profile, and CCD circuit. (c) Processed retinal image (noise removed, single frame).
We measured light-evoked transient optical signals in two subjects with normal vision. To measure the reflectance changes caused by light stimulation, each subject’s retina was dark adapted for ~20 min before each data set. Videos of the cone photoreceptor mosaic were acquired at 167 Hz for 0.33 s (55 frames) using the 837.8 nm imaging source. After 18 frames, a 670 nm stimulus was presented for 102 ms. In each frame, the reflectance of every cone was measured over a 3×3 pixel area centered on that particular cone (an individual cone is approximately 5 pixels in diameter). The baseline reflectance for a given cone was taken as the average reflectance of the first 18 frames. The normalized reflectance change for a given cone was calculated by subtracting the baseline reflectance from each frame and then dividing this difference by the baseline reflectance. An increased normalized reflectance change would indicate that the reflectance of a given cone has increased in response to the visible stimulus, whereas a decreased normalized reflectance change would indicate that the reflectance of that cone has decreased in response to the visible stimulus.
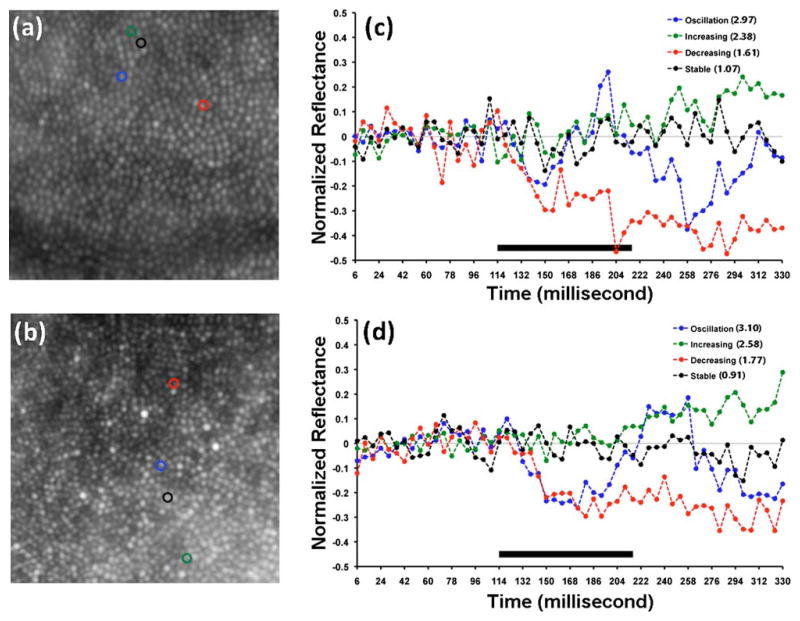
We imaged two female subjects with normal vision and no history of ocular pathology (Subject 1, 26 years and subject 2, 18 years). Shown in Figs. 3(a) and 3(c) are maximum intensity images of the cone mosaic from a registered stack of 55 individual frames. To characterize changes in cone reflectance in response to stimulation with visible light, we analyzed 1157 cones at 1° temporal to the fovea for subject 1 and 985 cones at 2° temporal to the fovea for subject 2. The light-evoked signal of each cone photoreceptor was placed into one of four categories: oscillation, increase (positive), decrease (negative), and no change. The cones that showed oscillation had variable amplitude and period. Shown in Figs. 3(b) and 3(d) are representative plots of cones with reflectance behaviors from each of these four categories. About 82% of the cones were categorized as activated after stimulation with visible light for subject 1 (511 showed oscillation, 44 showed an increase in reflectance, 389 showed a decrease in reflectance, and 213 showed no change). About 87% of the cones were categorized as activated after stimulation with visible light for subject 2 (325 showed oscillation, 102 showed an increase in reflectance, 432 showed a decrease in reflectance, and 126 showed no change). The increase/decrease responses could represent the leading edge of a very low frequency oscillation, though more work is needed to confirm this.
Fig. 3.
(Color online) Visible-light induced changes in cone reflectance. (a),(b) Averaged images of the cone mosaic derived from a registered stack of 55 individual frames. The size of each image is 0.5° × 0.5°. (c),(d) Optical reflectance profiles of cones marked in (a) and (b). RMS ratios for each cone are listed on the plot in the legend. Solid bar indicates duration of visible light stimulus.
To examine the effect of the imaging source on cone reflectance, we collected an additional set of images from subject 2. The images were acquired over 330 ms (55 frames) with no visible stimulus. We compared this to the previously acquired images from the same patch of retina in which a 102 ms visible stimulus was delivered after 18 frames. For each cone, the root mean square (RMS) for the first 18 frames was divided by the RMS for the last 37 frames, yielding the RMS ratio for that cone.
We compared the RMS ratio of individual cones under the two imaging conditions. For the no stimulus image, the average RMS ratio was 1.01, while for the visible stimulus image the average RMS ratio was 1.75. This difference was found to be significant (paired t-test, two-tailed p <0.0001, t =32.757, df =984). This indicates that the stimulus, not the imaging source, is responsible for the observed reflectance changes.
In summary, we demonstrated visible-light-evoked optical reflectance changes of individual cone photoreceptors using a short coherence length imaging source. Most of the cones are activated by visible stimulation and their reflectance changes vary in terms of slope, amplitude, and period. The high-speed functional imaging described here may prove a promising diagnostic tool to examine retinal function in the normal and diseased retina.
Acknowledgments
The authors thank Dr. Alfredo Dubra for image registration software. J. Carroll is the recipient of a Career Development Award from Research to Prevent Blindness. The study was supported by National Institutes of Health (NIH) grants EY001931 and EY017607, an unrestricted departmental grant from Research to Prevent Blindness, Fight for Sight, The E. Matilda Ziegler Foundation for the Blind, RD and Linda Peters Foundation, The Gene and Ruth Posner Foundation, and Hope for Vision.
References
- 1.Schnapf JL, McBurney RN. Nature. 1980;287:239. doi: 10.1038/287239a0. [DOI] [PubMed] [Google Scholar]
- 2.Hood DC, Birch DG. Vision Res. 1995;35:2801. doi: 10.1016/0042-6989(95)00034-w. [DOI] [PubMed] [Google Scholar]
- 3.Harary K, Brown JM, Pinto L. Science. 1978;202:1083. doi: 10.1126/science.102035. [DOI] [PubMed] [Google Scholar]
- 4.Yao XC, George JS. J Biomed Opt. 2006;11:064030. doi: 10.1117/1.2393155. [DOI] [PubMed] [Google Scholar]
- 5.Srinivasan VJ, Wojtkowski M, Fujimoto JG, Duker JS. Opt Lett. 2006;31:2308. doi: 10.1364/ol.31.002308. [DOI] [PubMed] [Google Scholar]
- 6.Pepperberg DR, Kahlert M, Krause A, Hofmann KP. Proc Natl Acad Sci USA. 1988;85:5531. doi: 10.1073/pnas.85.15.5531. [DOI] [PMC free article] [PubMed] [Google Scholar]
- 7.van de Kraats J, Berendschot TT, van Norren D. Vision Res. 1996;36:2229. doi: 10.1016/0042-6989(96)00001-6. [DOI] [PubMed] [Google Scholar]
- 8.Hanazono G, Tsunoda K, Shinoda K, Tsubota K, Miyake Y, Tanifuji M. Invest Ophthalmol Visual Sci. 2007;48:2903. doi: 10.1167/iovs.06-1294. [DOI] [PubMed] [Google Scholar]
- 9.Abramoff MD, Kwon YH, Ts’o D, Soliz P, Zimmerman B, Pokorny J, Kardon R. Invest Ophthalmol Visual Sci. 2006;47:715. doi: 10.1167/iovs.05-0008. [DOI] [PMC free article] [PubMed] [Google Scholar]
- 10.Bizheva K, Pflug R, Hermann B, Považay B, Sattmann H, Qiu P, Anger E, Reitsamer H, Popov S, Taylor JR, Unterhuber A, Ahnelt P, Drexler W. Proc Natl Acad Sci USA. 2006;103:5066. doi: 10.1073/pnas.0506997103. [DOI] [PMC free article] [PubMed] [Google Scholar]
- 11.Rha J, Jonnal RS, Thorn KE, Qu J, Zhang Y, Miller DT. Opt Express. 2006;14:4552. doi: 10.1364/oe.14.004552. [DOI] [PubMed] [Google Scholar]
- 12.Pallikaris A, Williams DR, Hofer H. Invest Ophthalmol Visual Sci. 2003;44:4580. doi: 10.1167/iovs.03-0094. [DOI] [PubMed] [Google Scholar]
- 13.Jonnal RS, Rha J, Zhang Y, Cense B, Gao W, Miller DT. Opt Express. 2007;15:16141. doi: 10.1364/OE.15.016141. [DOI] [PMC free article] [PubMed] [Google Scholar]
- 14.Grieve K, Roorda A. Invest Ophthalmol Visual Sci. 2008;49:713. doi: 10.1167/iovs.07-0837. [DOI] [PubMed] [Google Scholar]
- 15.Roorda A, Williams DR. Nature. 1999;397:520. doi: 10.1038/17383. [DOI] [PubMed] [Google Scholar]
- 16.Snyder AW, Pask C. Vision Res. 1973;13:1115. doi: 10.1016/0042-6989(73)90148-x. [DOI] [PubMed] [Google Scholar]


