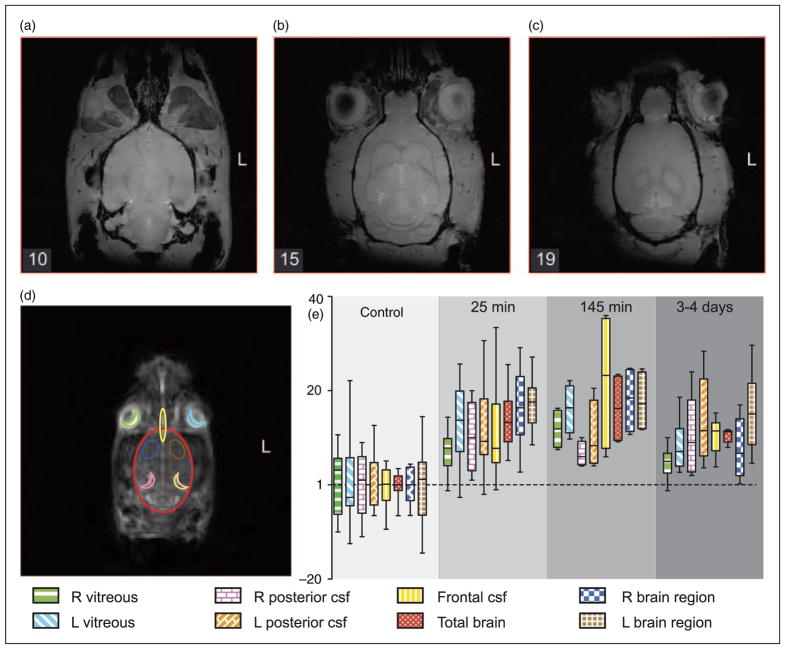
Figure 3.
Rat anatomy and quantitative changes in 23Na MRI after NTG. (a), (b) and (c) are high-resolution (0.133mm×0.133mm×0.4 mm) axial-plane 1H MRI slices of a representative rat head to identify anatomy from the 10th, 15th and 19th slice from base to top of the head. (d) shows an axial 23Na MRI slice with outlines of eight selected ROIs for regional quantification (e), color and fill-coded as in the foot of the legend: vitreous humor (R & L), frontal CSF, frontal brain (R & L), total brain, and posterior CSF (R & L). Plot (e) shows means and standard deviations of the average voxel intensities in eight ROIs. NTG significantly increased sodium, p<0.05, Kruskal–Wallis test, two-tailed.

