Abstract
The distribution of S to sulfate, glucosinolates, glutathione, and the insoluble fraction within oilseed rape (Brassica napus L.) leaves of different ages was investigated during vegetative growth. The concentrations of glutathione and glucosinolates increased from the oldest to the youngest leaves, whereas the opposite was observed for SO42−. The concentration of insoluble S was similar among all of the leaves. At sufficient S supply and in the youngest leaves, 2% of total S was allocated to glutathione, 6% to glucosinolates, 50% to the insoluble fraction, and the remainder accumulated as SO42−. In the middle and oldest leaves, 70% to 90% of total S accumulated as SO42−, whereas glutathione and glucosinolates together accounted for less than 1% of S. When the S supply was withdrawn (minus S), the concentrations of all S-containing compounds, particularly SO42−, decreased in the youngest and middle leaves. Neither glucosinolates nor glutathione were major sources of S during S deficiency. Plants grown on nutrient solution containing minus S and low N were less deficient than plants grown on solution containing minus S and high N. The effect of N was explained by differences in growth rate. The different responses of leaves of different ages to S deficiency have to be taken into account for the development of field diagnostic tests to determine whether plants are S deficient.
In higher plants, S is taken up by the roots as SO42−, transported via the xylem to the leaves, reduced to Cys, and either converted to Met or incorporated into proteins and Cys-containing peptides such as glutathione. The uptake and subsequent distribution of SO42− to the leaves is closely regulated in response to demand. For instance, developing leaves are strong S sinks, but show a net loss of S after full expansion (Sunarpi and Anderson, 1996). Similarly, the uptake of SO42− by the roots is down-regulated when the external S supply is sufficient, but increases in plants during S deficiency (Clarkson and Saker, 1989; Hawkesford et al., 1993). It has been suggested that the signal for down-regulation is either SO42− (Datko and Mudd, 1984) or a reduced-S-containing compound such as glutathione (Herschbach et al., 1995; Lappartient and Touraine, 1996). Both SO42− and glutathione are mobile in the phloem (Rennenberg et al., 1979; Lappartient and Touraine, 1996).
It has been suggested that SO42− stored in the vacuoles of mesophyll cells is only released under conditions of prolonged S stress and that this release is too slow to support new growth (Clarkson et al., 1983; Bell et al., 1995). As a result, the developing leaves are the first ones to show symptoms of S deficiency. When the youngest leaves are S deficient, the major fraction of S is in protein. However, remobilization of S from proteins does not take place under conditions of S starvation unless N is also deficient (Sunarpi and Anderson, 1996, 1997a). Additionally, low N has been shown to promote the export of SO42− from mature leaves (Sunarpi and Anderson, 1997b).
Oilseed rape (Brassica napus L.) is particularly sensitive to S deficiency because it has a high demand for S (Holmes, 1980); for example, oilseed rape produces seeds with a high yield of protein with relatively large quantities of S-containing amino acids (Zhao et al., 1997), and the plants require S for the synthesis of glucosinolates, a group of thioglucoside compounds reported to be part of the plant's defense mechanism against fungi and insects (Chew, 1988). In addition, glucosinolates may play a role as a S storage source, which can be used in the event of S starvation (Schnug and Haneklaus, 1993). It is not yet known if this contribution of S from glucosinolates is sufficient to counter the effect of S starvation, because the concentration in vegetative growth is less than 8% of total S (Fieldsend and Milford, 1994) and decreases during leaf expansion (Porter et al., 1991).
The decrease in atmospheric deposition of S has increased the incidence of S deficiency in oilseed rape (McGrath and Zhao, 1995). Studies on the physiological and molecular effects of S nutrition in oilseed rape will facilitate the prediction of responses to decreased S inputs and may provide useful diagnostic indicators of S status. In this study the distribution of S to glutathione, glucosinolates, SO42−, and insoluble S in leaves of different ages and the contributions of these compounds as a S source under conditions of S deficiency were investigated.
MATERIALS AND METHODS
Plant Material, Growth Conditions, and Experimental Design
Seeds of oilseed rape (Brassica napus L. cv Apex) were sown in pots with moist vermiculite (medium grade) and germinated at a constant temperature of 20°C, 75% RH, and a 16-h light period (280–300 μmol m−2 s−1). After 7 d the seedlings were transferred to a hydroponic system consisting of 40-L tanks (25–40 plants per tank) filled with a continuously aerated nutrient solution containing 3 mm KNO3, 2 mm Ca(NO3)2, 1 mm NH4H2PO4, 50 μm KCl, 25 μm H3BO3, 2 μm MnCl2, 2 μm ZnCl2, 0.5 μm CuCl2, 0.5 μm (NH4)6Mo7O24, and 20 μm NaFeEDTA. The pH of the solution was adjusted to 5.5 with KOH. MgSO4 was added as indicated in the experiments and Mg2+ was maintained at 1 mm in all treatments by the addition of MgCl2 when appropriate.
Two experimental systems were used. In the first, after transfer to the hydroponic system, seedlings were exposed to three different sulfate concentrations (20, 100, and 1000 μm SO42−). The nutrient solution was replaced weekly. Depending on the size, between 4 and 10 plants per treatment were harvested at regular intervals and weighed. Leaf length was determined by measuring the leaf along the main vein from the base to the apex. At each harvest the plants were dissected, and corresponding leaves of plants were pooled together in muslin cloth and immediately frozen in liquid N2. L1 corresponded to the first fully exposed leaf, L2 to the second, etc. The frozen leaves were lyophilized for 72 h and kept under a vacuum at room temperature until further analysis.
In the second experimental system, plants were precultured hydroponically, as described above, for 23 d on nutrient solution containing 1 mm SO42− and 7 mm NO3−. After this preculture, the plants were transferred to nutrient solutions containing: (a) 1 mm SO42− and 7 mm NO3− (plus S, high N); (b) 0 mm SO42− and 7 mm NO3− (minus S, high N); (c) 1 mm SO42− and 250 μm NO3− (plus S, low N); or (d) 0 mm SO42− and 250 μm NO3− (minus S, low N). These nutrient solutions were replaced every 3 d. Three plants per treatment were harvested at d 0 (the day when treatments were started), 2, 3, 6, 8, and 13. Each plant was dissected into the oldest leaves (L1 and L2), the middle leaves (usually L3, L4, L5, L6, and L7, depending on the size of the plant), and the youngest leaves (usually L8 and L9). The three leaf fractions of each plant were frozen separately in liquid N2 and lyophilized for 72 h. The dried leaves were ground into a fine powder and stored under vacuum at room temperature until further analysis.
Measurements
Total S was determined by digesting 50 mg of lyophilized plant material in a mixture of concentrated HNO3 and HClO4 (85:15, v/v). The digested material was resuspended in 5% (v/v) HCl and S determined by inductively coupled plasma-atomic emission spectroscopy (Applied Research Laboratories, Accuris, Ecublens, Switzerland) at 182 nm. Sulfate and nitrate were measured by extracting 20 mg of lyophilized plant material in 20 mL of deionized water at 90°C for 2 h, after which the extract was filtered through filter paper (Whatman no. 42). SO42− and NO3− concentrations in the extracts were determined by ion chromatography (Dionex 2000i/sp) using an AS9SC separation column fitted with an AS9G guard column (Dionex, Sunnyvale, CA). The eluent solution consisted of 1.8 mm Na2CO3, 1.7 mm NaHCO3, and the regenerant of 0.025 n H2SO4. Glutathione was extracted by grinding 10 to 15 mg of lyophilized plant material (with a mortar and pestle and quartz sand) in 2 mL of a solution containing 5% (w/v) 5-sulfosalicylic acid and 6.3 mm diethylenetriaminepenta-acetic acid. Total glutathione (GSH plus one-half GSSG, expressed as GSH equivalents) was determined using the 5,5′-dithiobis(2-nitrobenzoic acid) recycling assay as described by Anderson (1985), with GSSG as a standard. The final concentration of GSH reductase (type III, Sigma) in the cuvette was 0.5 unit mL−1. Glucosinolates were extracted from 50 mg of lyophilized leaf material, and the concentrations of individual compounds were measured by HPLC according to the protocols of Heaney et al. (1986). Insoluble S, representing mainly protein S, was determined by subtracting the concentrations of sulfate, glutathione, and glucosinolates from the concentration of total S. Chlorophyll was measured using a SPAD 502 meter (Minolta, Tokyo, Japan). Analysis of variance was performed on all data.
RESULTS
Effects of External S Supply on Leaf Growth and Concentrations of SO42− and Glutathione
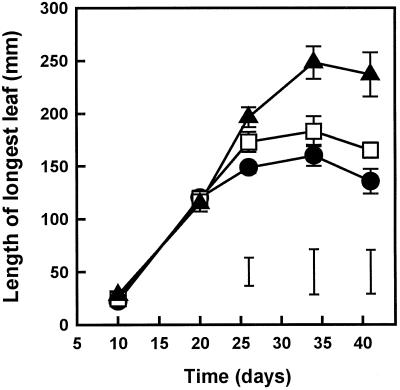
When plants were grown at three different sulfate concentrations, as described for the first experimental system in “Materials and Methods,” there was a profound effect on the growth and appearance of oilseed rape plants. The RGRs of the shoots were 0.15, 0.18, and 0.21 d−1 for plants grown on 20, 100, and 1000 μm sulfate, respectively. The average leaf length increased with increasing SO42− concentration (Fig. 1), as well as the number of leaves developing per plant: at the highest SO42− concentration (1000 μm) two to four more leaves developed per plant compared with the lowest concentration (20 μm) (data not shown). Chlorosis was observed in L6 to L12 in the 20 μm SO42− treatment after 26 d and in the 100 μm SO42− treatment after 34 d. In contrast, plants grown on 1000 μm SO42− remained green during the experiment (data not shown).
Figure 1.
Effect of external S supply on leaf development in oilseed rape. Plants were grown continuously in nutrient solutions containing 20, 100, or 1000 μm SO42−. The effect of increasing SO42− concentrations was similar in all of the leaves, but for clarity only the length of the longest leaf is presented. Data represent the means ± se of four separate plants. The lsd (P < 0.05) for each time point is shown by vertical bars. •, 20 μm SO42−; □, 100 μm SO42−; ▴, 1000 μm SO42−.
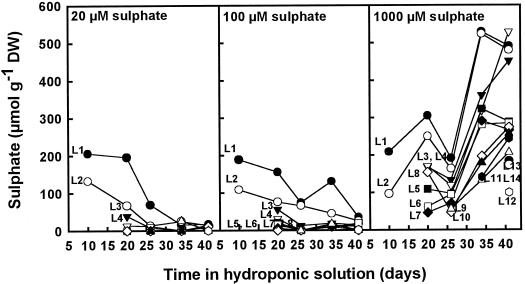
Initially, L1 and L2 contained similar concentrations of sulfate, irrespective of the supplied S concentration (Fig. 2). At the lower S treatments (20 and 100 μm), the SO42− concentration decreased gradually throughout the experiment, and little or no SO42− was observed in the subsequently developing leaves. At the highest S treatment (1000 μm), SO42− accumulated in all of the leaves, but particularly in the older ones. In all treatments, total S concentrations in leaves closely paralleled the SO42− concentrations (data not shown).
Figure 2.
SO42− concentrations in leaves of different ages grown in nutrient solutions containing 20, 100, or 1000 μm SO42− throughout the experimental period. The data shown are a representative example of two different experiments. DW, Dry weight.
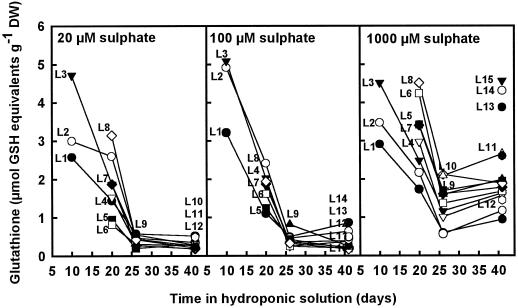
In all of the treatments the concentration of glutathione decreased during the course of the experiment (Fig. 3). This decrease closely paralleled the increase in leaf length and was probably caused by growth dilution. In plants grown on either 20 or 100 μm SO42−, glutathione decreased more rapidly over time, reaching a minimum concentration after 26 d. The concentration of glutathione in the young leaves showed the greatest decrease, and only a low concentration was measured in those leaves.
Figure 3.
Total glutathione concentrations (GSH plus GSSH) in leaves of different ages in nutrient solutions containing 20, 100, or 1000 μm SO42− throughout the experimental period. The data shown are a representative example of two different experiments. DW, Dry weight.
Effects of S and N on Chlorophyll and Growth Rate
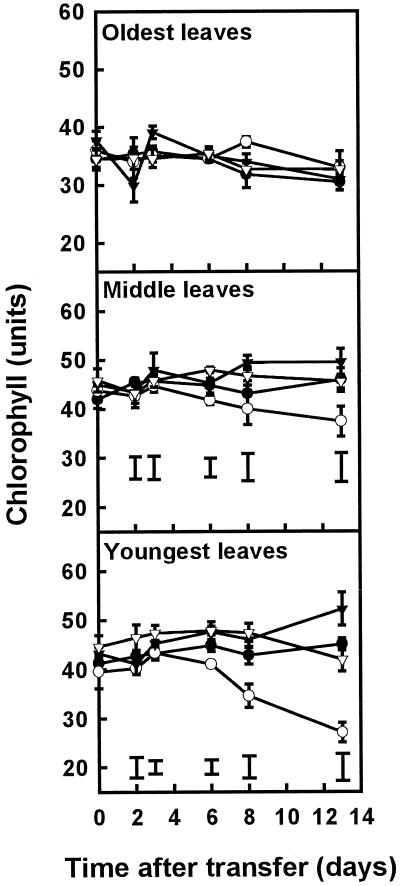
We examined the responses of plants grown for 3 weeks on 1 mm SO42− and 7 mm NO3−, followed by a transfer to nutrient solutions containing plus or minus S in combination with high (7 mm) or low (0.25 mm) NO3− concentrations, as described for the second experimental system in Methods. The chlorophyll readings decreased rapidly in the middle and particularly the youngest leaves of plants grown on solution containing minus S and high N, but not in leaves of plants grown on minus S and low N (Fig. 4). No significant changes in chlorophyll over time or between treatments were observed in the oldest leaves.
Figure 4.
Chlorophyll readings in the oldest, middle, and youngest leaves of plants grown in the presence or absence of SO42− at either high (7 mm) or low (0.25 mm) NO3−. Plants were grown for 3 weeks on 1 mm SO42− and 7 mm NO3− before transfer to the four different treatments at d 0. Data are the means ± se of three separate plant samples. The lsd (P < 0.05) for each time point is shown by vertical bars. There was no significant difference between treatments in the oldest leaves. Open symbols, minus S; closed symbols, plus S; circles, high N; triangles, low N.
The RGRs for the different plant parts are shown in Table I. Little growth was observed in the oldest leaves regardless of the treatment, probably because these leaves were already at full expansion at the start of the experiment. The growth rates of the middle and youngest leaves were much lower in the low- than in the high-N treatment. In the middle leaves, the removal of S did not decrease the growth rate any further in the low-N treatment, but decreased the growth rate by approximately 50% in the high-N treatment.
Table I.
RGRs (d−1) of the oldest, middle, and youngest leaves of oilseed rape plants grown in the presence or absence of SO42− at either high (7 mm) or low (0.25 mm) NO3−
| Treatment | RGR
|
||
|---|---|---|---|
| Oldest | Middle | Youngest | |
| d−1 | |||
| Plus S, high N | 0.008 ± 0.004 | 0.229 ± 0.018 | 0.273 ± 0.019 |
| Plus S, low N | 0.001 ± 0.004 | 0.045 ± 0.008 | 0.041 ± 0.009 |
| Minus S, high N | 0.028 ± 0.006 | 0.100 ± 0.011 | 0.250 ± 0.009 |
| Minus S, low N | 0.034 ± 0.008 | 0.053 ± 0.008 | 0.013 ± 0.010 |
Data represent the means ± se.
Effects of S and N on Glutathione and Glucosinolates
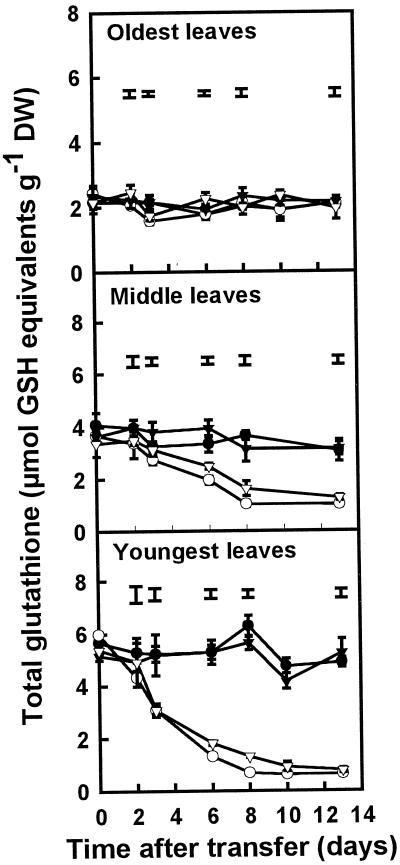
When sulfate was removed from the nutrient solution on d 0, the glutathione concentration decreased rapidly after 2 d in the middle and youngest leaves, but not in the oldest leaves (Fig. 5). In the youngest leaves, this decrease in glutathione concentration was faster in plants grown on high N than in plants grown on low N; the glutathione concentration in plants grown on high N reached a minimum after approximately 8 d, whereas in plants grown on low N the decrease was slower. A similar trend in the decrease of glutathione between plants grown on low and high N after S removal was observed in the middle leaves. The glutathione concentration in the youngest leaves was approximately 2.5 times that in the oldest leaves.
Figure 5.
Total glutathione concentrations (GSH plus GSSG) in the oldest, middle, and youngest leaves of plants grown in the presence or absence of SO42− at either high (7 mm) or low (0.25 mm) NO3−. Plants were grown for 3 weeks on 1 mm SO42− and 7 mm NO3− before transfer to the four different treatments at d 0. Data are the means ± se of three separate plant samples. The lsd (P < 0.05) for each time point is shown by vertical bars. There was no significant difference between treatments in the oldest leaves. Open symbols, minus S; closed symbols, plus S; circles, high N; triangles, low N. DW, Dry weight.
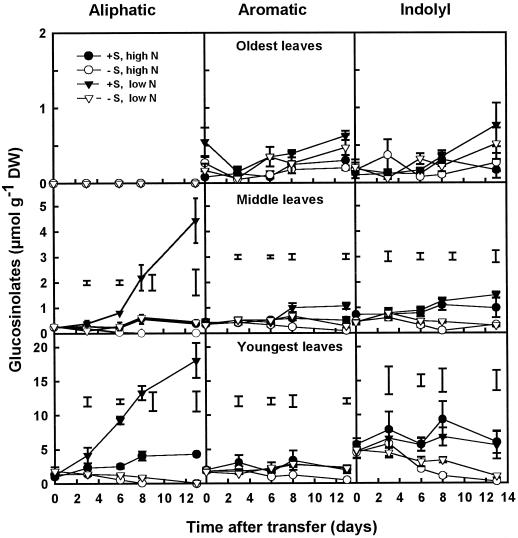
At d 0 in the youngest and middle leaves, the distribution of glucosinolates between the aliphatic, aromatic, and indolyl types was 16%, 23%, and 61%, respectively. The oldest leaves contained only aromatic and indolyl glucosinolates. There was a clear difference in the concentrations of glucosinolates in the different leaf tissues: at d 0, the youngest leaves contained 8.14 ± 0.54 μmol g−1 dry weight (6.4% of total S), whereas the middle and oldest leaves contained 1.12 ± 0.07 and 0.43 ± 0.08 μmol g−1 dry weight (0.6% and 0.1% of total S), respectively. When the external S supply was withdrawn, the aliphatic glucosinolates in the youngest leaves of plants grown on high N decreased at a rate of 0.17 μmol g−1 d−1 (i.e. 12.8% d−1 of the initial concentration), reaching 0 at d 8, whereas the aromatic and indolyl glucosinolates decreased at rates of 0.14 and 0.51 μmol g−1 d−1 (i.e. 7.6 and 11.3% d−1), respectively (Fig. 6). In plants grown on minus S and low N, the rates of decrease in the youngest leaves were 0.11 and 0.22 μmol g−1 d−1 for aliphatic and indolyl glucosinolates, respectively, whereas aromatic glucosinolates were not affected. In plus-S plants the concentration of glucosinolates increased in the youngest leaves of plants grown on low N, which was mainly attributable to a 15-fold increase in the concentration of aliphatic glucosinolates during the experiment. In the middle leaves of minus-S plants grown on high N, the concentrations of the aliphatic and aromatic glucosinolates decreased at rates of 0.035 and 0.033 μmol g−1 d−1 (i.e. 13.5% and 9.4% d−1 of the initial concentration), respectively, whereas no significant change was observed in the concentration of the indolyl glucosinolates. In the middle leaves of minus-S plants grown on low N, no significant changes were observed in the glucosinolate concentration for the duration of the experiment. Like the youngest leaves, in the middle leaves of plus-S plants grown on low N, the concentration of the aliphatic glucosinolates increased almost 20-fold between d 0 and 13. In the oldest leaves, no significant differences were found between the different treatments.
Figure 6.
Glucosinolate concentrations in the oldest, middle, and youngest leaves of plants grown in the presence or absence of SO42− at either high (7 mm) or low (0.25 mm) NO3−. Plants were grown for 3 weeks on 1 mm SO42− and 7 mm NO3− before transfer to the four different treatments at d 0. Data are the means ± se of three separate plant samples. For clarity, the y axes for the oldest, middle, and youngest leaves are presented at different scales. The lsd (P < 0.05) for each time point is shown by vertical bars. There was no significant difference between treatments in the oldest leaves. Open symbols, minus S; closed symbols, plus S; circles, high N; triangles, low N. DW, Dry weight.
Effects of S and N on SO42− and Insoluble S
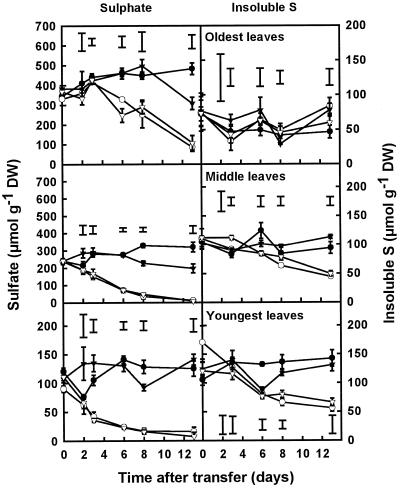
At d 0, SO42− accounted for 83%, 68%, and 42% of total S in the oldest, middle, and youngest leaves, respectively. The SO42− concentration of all of the leaves decreased sharply after the removal of the external S supply (Fig. 7). No difference in the decline of the SO42− concentration between the high- and low-N treatments could be observed in the youngest and middle leaves of plants after S withdrawal; in the youngest leaves, the SO42− concentration decreased at a rate of 7.0 and 7.4 μmol g−1 d−1 between d 2 and 8 in plants grown on high and low N, respectively; in the middle leaves, the SO42− concentration decreased at a rate of 26.0 and 25.3 μmol g−1 d−1, respectively, during the same period. In both the youngest and middle leaves this decrease in SO42− concentration was equivalent to a rate of decrease of approximately 10% d−1 of the initial SO42− concentration. However, the rate of decrease was not constant, and once the SO42− concentration was less than 20% of the initial concentration the rate of decrease was reduced considerably. In the oldest leaves there was initially no significant decline in the SO42− concentration in plants grown on high N, but after d 6 it decreased rapidly at a rate of 34.4 μmol g−1 d−1 (equivalent to 9.3% d−1). In plants grown on low N, the SO42− concentration in the oldest leaves decreased from d 3 onward at a rate of 29.4 μmol g−1 d−1 (7.8% d−1).
Figure 7.
Concentrations of SO42− and insoluble S in the oldest, middle, and youngest leaves of plants grown in the presence or absence of SO42− at either high (7 mm) or low (0.25 mm) NO3−. Plants were grown for 3 weeks on 1 mm SO42− and 7 mm NO3− before transfer to the four different treatments at d 0. Data are the means ± se of three separate plant samples. The lsd (P < 0.05) for each time point is shown by vertical bars. For clarity, the SO42− concentrations of the youngest leaves are presented on a smaller scale. Open symbols, minus S; closed symbols, plus S; circles, high N; triangles, low N. DW, Dry weight.
The concentrations of insoluble S, defined as the difference between the total S concentration and the sum of the concentrations of SO42−, glutathione, and glucosinolates, were similar (approximately 100 μmol g−1 dry weight) at the start of the experiment in the oldest, middle, and youngest leaves, and were less affected by the withdrawal of the external S supply than the SO42− concentration (Fig. 7). In the oldest leaves no significant differences were observed between the four different treatments: the insoluble S concentration remained relatively constant during the course of the experiment. In the middle leaves the insoluble S concentration in the minus-S plants was significantly decreased compared with the control from d 6 onward at a rate of 5.3 and 5.2 μmol g−1 d−1 (5% d−1) for plants grown on high and low N, respectively. In the youngest leaves the insoluble S concentration decreased at a rate of 13.6 μmol g−1 d−1 (12.5% d−1) in plants grown on minus S and high N, but at a rate of 6.1 μmol g−1 d−1 (5% d−1) in plants grown on minus S and low N between d 0 and 8, respectively. By d 13, plants grown on minus S and low N contained 55% of the initial insoluble S concentration, whereas plants grown on high N contained only 33%.
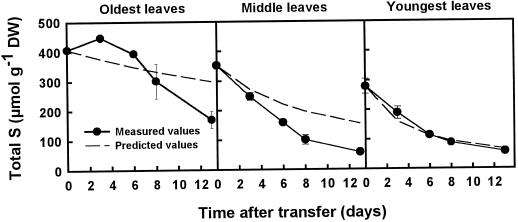
To determine whether S was relocated from old to young leaves, a comparison was made between the total S measurements in plants grown on minus S and high N, and the predicted values for total S for each leaf type based on the growth rate and assuming that no S was transported into or out of each plant part (Fig. 8). The predicted values represent a dilution curve attributable to growth. A measured value higher than the predicted value implies a net gain of S, and vice versa. The measurements of total S in the youngest leaves followed the prediction very closely, indicating no net gain or loss of S. In the middle leaves, the measured total S was consistently lower than the predicted value for total S during the course of the experiment, indicating net export. In the oldest leaves, the measurements of total S were higher than the predicted values up to d 8, indicating net import; however, by d 13 the measured total S in the oldest leaves was lower than the predicted value, indicating net export. It is possible that the exported S from the middle and oldest leaves went to the roots or stems, but this was not determined in the present study. The S budget in the youngest leaves of plants grown on minus S and high N was examined more closely by using similar predictions for the dilution of the concentrations of SO42−, glutathione, glucosinolates, and insoluble S, together with the difference between the measured and predicted values by d 13 (Table II). The data show that the concentration of insoluble S decreased more slowly than predicted, whereas the concentrations of SO42−, glutathione, and glucosinolates decreased faster than predicted. A comparison of the data in Table II with those in Figure 8 suggests that the net gain of insoluble S in the youngest leaves comes from an internal redistribution of different S pools, specifically the conversion of soluble pools of S to insoluble S.
Figure 8.
Concentrations of total S in the oldest, middle, and youngest leaves of plants grown in the absence of S and at high (7 mm) NO3− compared with the predicted values for each leaf type. Predictions were based on the growth rate, assuming that no S was transported into or out of each plant part, and therefore predicted values represent a dilution curve attributable to growth. Closed circles, Measured values; dashed lines, predicted values. DW, Dry weight.
Table II.
Comparison between measured and predicted values of S-containing compounds in the youngest leaves of plants grown at high (7 mm) NO3− for 13 d after removal of the S supply
| Values | Insoluble S | SO42− | Glutathione | Glucosinolates |
|---|---|---|---|---|
| μmol g−1 dry wt | ||||
| Measured | 56.1 | 0 | 0.56 | 1.37 |
| Predicted | 40.0 | 21.3 | 1.40 | 3.61 |
| Difference | +16.1 | −21.3 | −0.84 | −2.23 |
DISCUSSION
The results obtained showed a clear difference in the distribution of S between leaves of different ages. At sufficient S supply, approximately 50% of total S in the youngest leaves was incorporated into insoluble S, 2% into glutathione, 6% into glucosinolates, and 42% accumulated as SO42−. In contrast, in the middle and oldest leaves, 70% to 90% of S accumulated as SO42−, whereas glutathione and glucosinolates together accounted for less than 1% of total S. It has been reported that in soybean plants, SO42− in the transpiration stream was predominantly delivered to developing leaves, despite the fact that mature and young leaves transpired at an equal rate (Smith and Lang, 1988). These results were explained by a very efficient xylem-to-phloem transfer before any SO42− delivered to mature leaves could mix with the intracellular SO42− pool in the mesophyll cells and become immobilized. In oilseed rape plants SO42− accumulated mainly in the mature leaves, even for days after the S supply was withdrawn. This indicated that the xylem-to-phloem transfer of SO42− was not completely effective and could contribute to the high S demand of oilseed rape plants.
When the external S supply was removed, the youngest leaves were able to convert SO42−, glutathione, and glucosinolates to insoluble S. SO42− was the most important net contributor of S; the contributions by glutathione and glucosinolates were almost negligible in comparison. These results were in contrast with the suggestion that glucosinolates play a vital role as a S source in the event of S deficiency (Schnug and Haneklaus, 1993), but were in agreement with the results obtained from several oilseed rape varieties grown in the field showing that glucosinolates in vegetative tissues accounted for only 2% to 8% of total S (Fieldsend and Milford, 1994).
Little is known about the regulatory aspects of the remobilization of S from mature leaves. It has been proposed that glutathione acts as a regulatory signal to decrease the SO42− uptake in the roots (Rennenberg et al., 1989; Lappartient and Touraine, 1996), but it is unknown whether it also acts as a signal for the leaf-to-leaf translocation of S. Export of S from the oldest leaves was observed after 6 d of S starvation, predominantly as SO42− (Figs. 7 and 8), but during that period no changes in the glutathione concentration were observed (Fig. 5). It may have been possible that S from these leaves was exported as glutathione, as suggested by Rennenberg (1984), with the glutathione pool being replenished at a constant level using the SO42− pool. However, no increases in S were observed in the middle and youngest leaves, although it was unknown whether S increased in the roots or stems. Furthermore, in soybean plants exposed to 35S more than 90% of S transported out of the mature leaves was recovered as SO42−, and the export of glutathione from mature leaves was concluded to be quantitatively negligible (Smith and Lang, 1988).
The occurrence of S deficiency was not determined by the external S concentration alone, but also by the external N concentration. Previously, it has been suggested that S stress is reduced in plants grown on low N, because N stress promotes an increase in the redistribution of SO42− from older leaves (Sunarpi and Anderson, 1997a) and stimulates the hydrolysis of proteins and the subsequent export of insoluble S (Sunarpi and Anderson, 1997b). In the present study there was no evidence for the export of insoluble S from the oldest leaves during the experiment, or for a faster rate of SO42− export in plants grown on low N compared with plants grown on high N. Instead, plants grown on minus S and low N showed less S-deficiency stress symptoms, as measured by chlorophyll, because of the reduced growth rate; high-N plants grew faster and therefore had an increased demand for S, which was reflected by a faster decrease in the concentration of insoluble S compared with the youngest leaves of plants also grown on minus S but with low N. At low N and minus S the internal concentrations of S and N were more balanced. This balance between N and S is closely regulated and has been reported for several plant species (Friedrich and Schrader, 1978; Barney and Bush, 1985; Karmoker et al., 1991). The importance of the balance between N and S is also shown in plants grown on plus S and low N. In these plants the surplus of S resulted in the accumulation of aliphatic glucosinolates, which contain two S atoms for one N atom.
In summary, we conclude that neither glucosinolates nor glutathione were the major sources of S during S deficiency in oilseed rape, and that SO42− was by far the most important source. The increased S-deficiency symptoms at a high external N concentration compared with a low N concentration were explained by higher growth rates of the youngest and middle leaves, rather than by differences in the export of SO42− or in the remobilization of insoluble S in the old leaves. Finally, the results reported here show that the various S pools in different leaves responded differently to S deficiency. These differences have to be taken into account for the development of field diagnostic tests to determine whether plants are S-deficient.
ACKNOWLEDGMENTS
The authors thank Mr. Adrian Crosland for conducting the total-S measurements using inductively coupled plasma-atomic emission spectroscopy, and Mr. Guy Kiddle for measuring glucosinolates.
Abbreviation:
- RGR
relative growth rate
Footnotes
This research was supported by the Home-Grown Cereals Authority (grant no. 015/1/96/OS08/1/96). IACR receives grant-aided support from the Biotechnology and Biological Science Research Council of the United Kingdom.
LITERATURE CITED
- Anderson ME. Tissue glutathione. In: Greenwald RA, editor. Handbook of Methods for Oxygen Radical Research. Boca Raton, FL: CRC Press; 1985. pp. 317–323. [Google Scholar]
- Barney PE, Bush LP. Interaction of nitrate and sulfate reduction in tobacco. I. Influence of availability of nitrate and sulfate. J Plant Nutr. 1985;8:505–515. [Google Scholar]
- Bell CI, Clarkson DT, Cram WJ. Sulfate supply and its regulation of transport in roots of a tropical legume Macroptilium atropurpureum cv. Siratro. J Exp Bot. 1995;46:65–71. [Google Scholar]
- Chew FS. Biological effects of glucosinolates. In: Cutler HG, editor. Biologically Active Natural Products: Potential Use in Agriculture. Washington, DC: American Chemical Society; 1988. pp. 155–181. [Google Scholar]
- Clarkson DT, Saker LR. Sulfate influx in wheat and barley roots becomes more sensitive to specific protein-binding reagents when plants are sulfate-deficient. Planta. 1989;178:249–257. doi: 10.1007/BF00393201. [DOI] [PubMed] [Google Scholar]
- Clarkson DT, Smith FW, van den Berg PJ. Regulation of sulfate transport in a tropical legume, Macroptilium atropurpureum, cv. Siratro. J Exp Bot. 1983;34:1463–1483. [Google Scholar]
- Datko AH, Mudd SH. Sulfate uptake and its regulation in Lemna paucicostata Hegelm. 6746. Plant Physiol. 1984;75:466–473. doi: 10.1104/pp.75.2.466. [DOI] [PMC free article] [PubMed] [Google Scholar]
- Fieldsend J, Milford GFJ. Changes in glucosinolates during crop development in single- and double-low genotypes of winter oilseed rape (Brassica napus). I. Production and distribution in vegetative tissues and developing pods during development and potential role in the recycling of sulfur within the crop. Ann Appl Biol. 1994;124:531–542. [Google Scholar]
- Friedrich JW, Schrader LE. Sulfur deprivation and nitrogen metabolism in maize seedlings. Plant Physiol. 1978;61:900–903. doi: 10.1104/pp.61.6.900. [DOI] [PMC free article] [PubMed] [Google Scholar]
- Hawkesford MJ, Davidian J-C, Grignon C. Sulfate/proton cotransport in plasma-membrane vesicles isolated from roots of Brassica napus L.: increased transport in membranes isolated from sulfur-starved plants. Planta. 1993;190:297–304. [Google Scholar]
- Heaney RK, Spinks RK, Hanley AB, Fenwick GR (1986) Analysis of Glucosinolates in Rapeseed. Technical bulletin. AFRC Food Research Institute, Norwich, UK
- Herschbach C, de Kok LJ, Rennenberg H. Net uptake of sulfate and its transport to the shoot in tobacco plants fumigated with H2S or SO2. Plant Soil. 1995;175:75–84. [Google Scholar]
- Holmes MRJ (1980) Nutrition of the Oilseed Rape Crop. Applied Science Publishers, London
- Karmoker JL, Clarkson DT, Saker LR, Rooney JM, Purves JV. Sulfate deprivation depresses the transport of nitrogen to the xylem and the hydraulic conductivity of barley (Hordeum vulgare L.) roots. Planta. 1991;185:269–278. doi: 10.1007/BF00194070. [DOI] [PubMed] [Google Scholar]
- Lappartient AG, Touraine B. Demand-driven control of root ATP sulfurylase activity and SO42− uptake in intact canola. Plant Physiol. 1996;111:147–157. doi: 10.1104/pp.111.1.147. [DOI] [PMC free article] [PubMed] [Google Scholar]
- McGrath SP, Zhao FJ. Sulphur uptake, yield responses and interactions between nitrogen and sulphur in winter oilseed rape (Brassicanapus) J Agric Sci. 1995;126:53–62. [Google Scholar]
- Porter AJR, Morton AM, Kiddle G, Doughty KJ, Wallsgrove RM. Variation in the glucosinolate content of oilseed rape (Brassica napus L.). I. Effect of leaf age and position. Ann Appl Biol. 1991;118:461–467. [Google Scholar]
- Rennenberg H. The fate of excess sulfur in higher plants. Annu Rev Plant Physiol. 1984;35:121–153. [Google Scholar]
- Rennenberg H, Kemper O, Thoene B. Recovery of sulfate transport into heterotrophic tobacco cells from inhibition by reduced glutathione. Physiol Plant. 1989;76:271–276. [Google Scholar]
- Rennenberg H, Schmitz K, Bergmann L. Long distance transport of sulfur in Nicotiana tabacum. Planta. 1979;176:68–74. doi: 10.1007/BF00384591. [DOI] [PubMed] [Google Scholar]
- Schnug E, Haneklaus S. Physiological backgrounds of different sulfur utilisation in Brassica napus varieties. Aspects Appl Biol. 1993;34:235–242. [Google Scholar]
- Smith IK, Lang AL. Translocation of sulfate in soybean (Glycine max L. Merr) Plant Physiol. 1988;86:798–802. doi: 10.1104/pp.86.3.798. [DOI] [PMC free article] [PubMed] [Google Scholar]
- Sunarpi, Anderson JW. Distribution and redistribution of sulfur supplied as [35S]sulfate to roots during vegetative growth of soybean. Plant Physiol. 1996;110:1151–1157. doi: 10.1104/pp.110.4.1151. [DOI] [PMC free article] [PubMed] [Google Scholar]
- Sunarpi, Anderson JW. Effect of nitrogen nutrition on remobilization of protein sulfur in the leaves of vegetative soybean and associated changes in soluble sulfur metabolites. Plant Physiol. 1997a;115:1671–1680. doi: 10.1104/pp.115.4.1671. [DOI] [PMC free article] [PubMed] [Google Scholar]
- Sunarpi, Anderson JW. Effect of nitrogen nutrition on the export of sulfur from leaves in soybean. Plant Soil. 1997b;188:177–187. [Google Scholar]
- Zhao FJ, Bilsborrow PE, Evans EJ, McGrath SP. Nitrogen to sulfur ratio in rapeseed and in rapeseed protein and its use in diagnosing sulfur deficiency. J Plant Nutr. 1997;20:549–558. [Google Scholar]


