Abstract
Six amino acids with pIs that ranged from 3.2 to 9.7 were used as ampholytes to establish a pH gradient in capillary isoelectric focusing. This amino acid-based capillary isoelectric focusing (cIEF) was coupled with ESI-MS/MS using an electrokinetically pumped sheath-flow interface for peptide analysis. Amino acid-based isoelectric focusing generates a two-order of magnitude lower background signal than commercial ampholytes in the important m/z range of 300–1800. Good focusing was achieved for insulin receptor, which produced ~10-s peak width. For 0.1 mg/mL bovine serum albumin (BSA) digests, 24 ± 1 peptides (sequence coverage 47 ± 4 %) were identified in triplicate analysis. As expected, the BSA peptides were separated according to their pI. The concentration detection limit for the BSA digests is 7 nM and the mass detection limit is 7 fmole. A solution of six bovine protein tryptic digests spanning 5 orders of magnitude in concentration was analyzed by amino acid based cIEF-ESI-MS/MS. Five proteins with a concentration range spanning 4 orders of magnitude were identified in triplicate runs. Using amino acid based cIEF-ESI-MS/MS, 112 protein groups and 303 unique peptides were identified in triplicate runs of a RAW 264.7 cell homogenate protein digest. In comparison with ampholyte based cIEF-ESI-MS/MS, amino acid based cIEF-ESI-MS/MS produces higher resolution of five acidic peptides, much cleaner mass spectra, and higher protein spectral counts.
1. Introduction
Capillary isoelectric focusing (cIEF), in which ampholytes are used to establish a pH gradient, has been used for protein and peptide separations and prefractionation [1–14]. Direct coupling of cIEF to electrospray ionization-mass spectrometry (ESI-MS) suffers from a large background signal generated by commercial ampholytes [15]. These ampholytes have similar molecular weight as tryptic peptides, are ionized efficiently in ESI-MS, and compete with peptides during tandem mass spectrometry analysis, interfering with peptide identifications.
Efforts have been made to minimize the interference of ampholytes during ESI-MS [16–24]. Most simply, the ampholyte concentration is decreased to 1% or less, and the m/z scan range is usually from 700–2000 to reduce the background produced by commercial ampholytes [16–21]. As an example, Kuroda et al. [22] decreased the concentration of ampholytes to 1% to minimize the interference of the ampholytes for absolute quantification of standard peptides and proteins. The detection limit of this system for a standard peptide was 0.22 μM, likely due to interference by the ampholytes during analysis.
Van der Greef and colleagues reported cIEF-ESI-MS of complex peptide mixtures and the periplasmic protein digest from E. coli in the absence of carrier ampholytes [23, 24]. In this experiment, the peptides themselves acted as ampholytes. This autofocusing cIEF-ESI-MS required high sample concentration to form the pH gradient. Low concentration samples are not compatible with this technology.
Amino acids are amphiproteric molecules and were used as ampholytes by Caspers and Chrambach for the focusing of BSA with staining detection [25]. Although the amino acids do not produce as uniform a pH gradient as commercial ampholytes, they have low molecular weight and will not interfere with tandem mass spectrometric analysis of peptides. In this paper, we employ amino acids as ampholytes for capillary isoelectric focusing with ESI-MS/MS detection.
2. Experimental
2.1 Chemicals and Materials
All reagents were purchased from Sigma Aldrich Co. (St. Louis, MO, USA) unless otherwise stated. Linear polyacrylamide (LPA)-coated fused-silica capillaries (50 μm i.d., 150 μm o.d.) were purchased from Polymicro Technologies (Phoenix, AZ, USA). Ampholytes (Pharmalytes 3–10) were purchased from GE Healthcare (Piscataway, NJ, USA). Formic acid (FA) was purchased from Fisher Scientific (Pittsburgh, PA, USA). Water was deionized by a Nano Pure system from Thermo scientific (Marietta, OH, USA). The six bovine protein tryptic digest exponential molar mix was purchased from Bruker-Michrom Inc. (Auburn, CA, USA). RAW 264.7 (mouse monocyte/macrophase) cell line was obtained from ATCC (Manassas, VA USA).
2.2 Preparation of amino acids ampholyte solution
Glutamate (5 mg), asparagine (5 mg), glycine (5 mg), proline (20 mg), histidine (20 mg), and lysine (20 mg) were dissolved in 10 mL water and stored at 4°C for use.
2.3 Sample preparation
Bovine serum albumin (BSA, 0.5 mg/mL) dissolved in 100 mM ammonium bicarbonate (pH 8.0) was denatured at 90 °C for 10 min, followed by reduction with DTT (8 mM) at 65 °C for 1 h and alkylation with IAA (20 mM) at room temperature for 30 min in the dark. Then digestion was performed by incubating the proteins for 12 h at 37 °C with trypsin at a trypsin/protein ratio of 1/30 (w/w).
Protein digests were lyophilized using a Speed Vac (Thermo Fisher, Dubuque IA) and then dissolved in the amino acid solution for cIEF-ESI-MS/MS analysis.
The six bovine protein tryptic digest exponential molar mix was first dissolved in 20 μL 0.1% formic acid, and desalted by C18 ziptip (Millipore, Billerica, MA). Then the digests were lyophilized in Speed Vac. The dried digests were dissolved in 20 μL amino acids solution for cIEF-ESI-MS/MS analysis.
RAW 264.7 cells were cultured in a T75 flask at 37 °C and 5% CO2 in DMEM with L-glutamine and 10% FBS. The flask was washed with cold PBS buffer twice. Then, 3 mL mammalian cell-PE LB™ buffer (pH 7.5) supplemented with complete protease inhibitor was added to the flask, and the flask was shaken gently for 10 min on ice. The cell lysate was transferred to a 1.5 mL centrifuge tube and incubated on ice for 15 min. Subsequently, the cell lysate was centrifuged at 18,000 g for 15 min, and the supernatant was collected for measurement of protein concentration with the BCA method. After that, 200 μL cell lysate (~200 μg proteins) was denatured at 90 °C for 20 min, followed by reduction and alkylation process with DTT and IAA (same condition with BSA). Then, cold acetone (1 mL) was added to the protein solution and incubated at −20 °C for 12 h, followed by centrifugation at 18,000 g for 15 min. The protein pellet was washed with cold acetone again, and dried at room temperature. Finally, the protein pellet was dissolved in 400 μL 1 M urea and 100 mM ammonium bicarbonate buffer (pH 8.0) and digested by incubating the proteins for 12 h at 37 °C with trypsin at a trypsin/protein ratio of 1/30 (w/w). Protein digests were desalted by C18 trap column and lyophilized in Speed Vac. The dried digests were dissolved in amino acids solution for cIEF-ESI-MS/MS analysis.
2.4 cIEF-ESI-MS/MS
A commercial linear polyacrylamide coated capillary (50 μm i.d., 50 cm long) was used for the cIEF separation. The anode end of the capillary was placed in formic acid (0.1%, pH 2.5), and the cathode end was placed in 0.3% ammonium hydroxide (pH 11). The capillary was filled with sample prepared in the six-amino acid mixture by purging the solution through the capillary at 2 psi for 3 min. The total injection volume was about 1μL. Focusing voltage was applied at 400 V/cm for 10 min. After focusing, the cathode end of the capillary was inserted into the emitter of the electrospray interface [26–28] and chemical mobilization was performed with the sheath flow buffer (50% methanol, 0.1% formic acid). The electric field was kept at 330 V/cm during mobilization.
2.5 Data acquisition and processing
All mass spectrometric experiments were performed using a LTQ-Orbitrap Velos instrument (Thermo Fisher Scientific). Full MS scans for peptides analysis were acquired over a 395–1800 m/z range with resolution of 60,000 (at 400 m/z). Twelve most intense peaks with charge state ≥2 were selected for sequencing and fragment in the ion trap with normalized collision energy of 35%, activation q = 0.25, activation time of 10 ms, and one microscan. Peaks selected for fragmentation more than once within 45 s were excluded from selection for 45 s. For amino acids and insulin receptor analysis, the MS scan range was 70–1000 m/z.
For standard protein samples, database searching of the RAW files was performed in Proteome Discoverer 1.2 with the SEQUEST search engine against ipi.bovin.v3.68.fasta. Peptides identified with confidence value as “high” were considered as positive identification.
For the RAW 264.7 cell sample, the RAW files obtained from mass spectrometer were first transferred to .mgf files. Database searching of mgf files was performed with the MASCOT search engine against IPI_mouse_v3.85 database. Trans-Proteomic Pipeline (TPP) 4.4 was used to filter the database searching results with both peptide probability and protein probability higher than 0.9.
3. Results and discussion
3.1 pH gradient formed in amino acid based CIEF
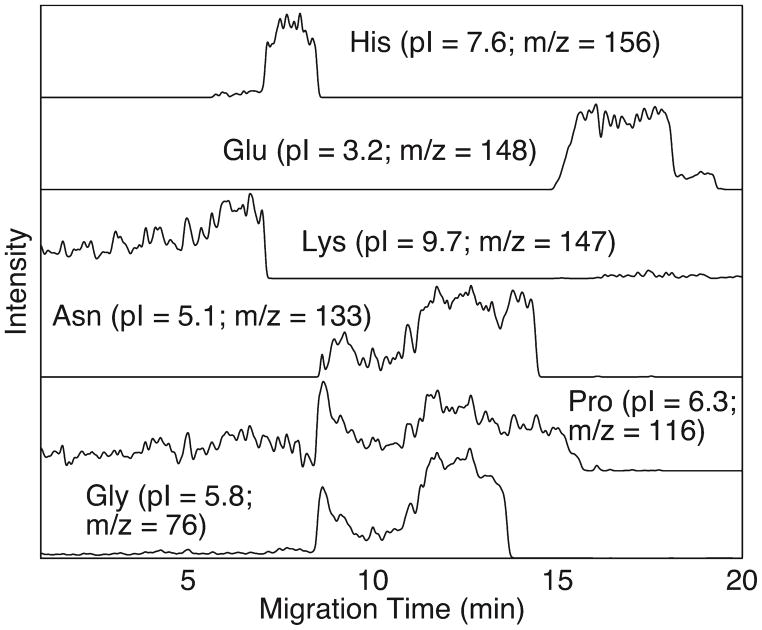
The mixture of six amino acids (Table 1) was injected into the capillary and then focused. After focusing, chemical mobilization was used to transport the amino acids to the mass spectrometer. Figure 1 presents the six amino acids’ migration profiles. Amino acids migrated from higher pI to lower pI, which is expected for positive polarity mobilization. The high concentration of the amino acids results in good buffering capacity. The amino acids also produce wide focused zones that overlap to produce a pH gradient [25]. Asparagine and glycine have similar pI; it should be possible to eliminate one of those amino acids in future experiments.
Table 1.
Information for the six amino acids used as ampholytes in cIEF
| Amino Acid | Lysine(Lys) | Histidine(His) | Proline(Pro) | Glycine(Gly) | Asparagine(Asn) | Glutamate(Glu) |
|---|---|---|---|---|---|---|
| Mw. | 146.11 | 155.08 | 115.07 | 75.04 | 132.06 | 147.06 |
| pI | 9.74 | 7.59 | 6.30 | 5.97 | 5.07 | 3.22 |
| Concentration (mg/mL) | 2 | 0.5 | 2 | 0.5 | 2 | 0.5 |
Figure 1.
Migration profiles of six amino acids.
3.2 The focusing performance of amino acid based cIEF
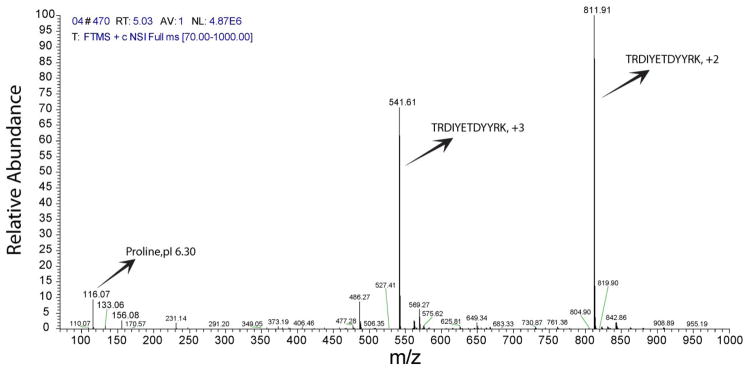
Insulin receptor peptide (1142–1153) (pI 5.79, sequence TRDIYETDYYRK) was used to test the focusing performance of amino acid based cIEF. First, the amino acid solution was used to prepare a 0.05 mg/mL peptide solution, which was used to fill the capillary (1 μL). After focusing, the peptide was mobilized by changing the catholyte to the sheath flow buffer. The peak width of the peptide was 10 s or less in triplicate runs (Figure S-1, supporting information I). Figure 2 shows the mass spectrum of insulin receptor. Proline, asparagine, and histidine co-migrate with the peptide; proline was the main co-migrating amino acid. This co-migration is expected because the pI of the peptide (5.79) matches the pH range of proline.
Figure 2.
Spectrum of insulin receptor in mass range 70–1000 m/z.
3.3 Background signal
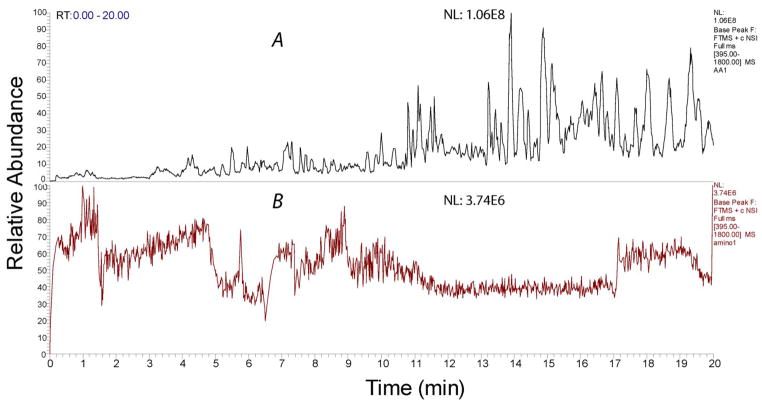
Both ampholytes (0.4% v/v) blank and amino acids solution blank were analyzed by cIEF-ESI-MS using a MS scan range of 395–1800. Figure 3 shows the base peak both from 0.4% (w/v) ampholytes (Figure 3a) and amino acids (Figure 3b). Ampholytes produce a complex background signal that complicates peptide analysis. In contrast, the background signal intensity generated by the amino acids was a factor of 30 lower than that generated by the ampholytes (Table S-1, supporting information I).
Figure 3.
Base peak spectra of 0.4% ampholytes blank (A) and amino acids blank (B)
3.4 Analysis of BSA digests
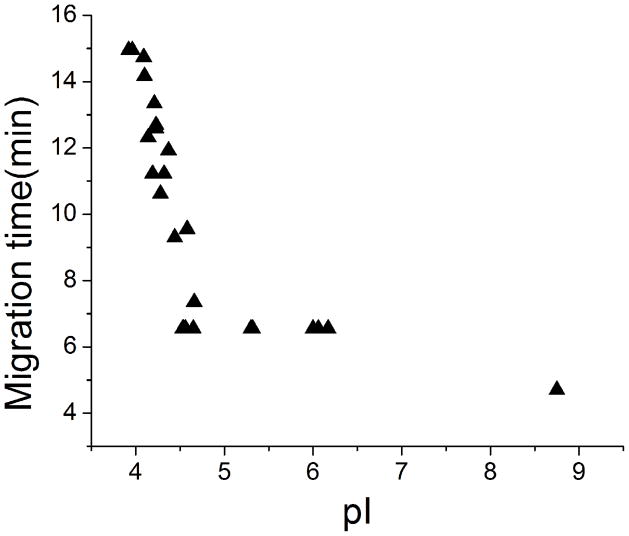
BSA digests (0.1mg/mL) were used to evaluate the separation performance of amino acid based cIEF-ESI-MS/MS system. 24 ± 1 peptides (sequence coverage 47 ± 4 %) were identified in triplicate analysis. Figure 4 shows the relationship between observed migration time and the predicted isoelectric point for the BSA tryptic peptides. cIEF provides excellent resolution of acidic peptides, whereas neutral and basic peptides migrate in a very narrow window. The migration time plot is similar to that generated using 0.4% ampholytes (data not shown). The identification limit was also investigated. BSA digests with concentration as low as 0.0005 mg/mL (7 nM, 7 fmole injection amount) were analyzed; one peptide (HLVDEPQNLIK, m/z 653.3556) can be consistently identified (MS2 spectrum is shown in S-Figure 2), which is lower than that obtained from 0.4% ampholyte cIEF-MS/MS (>0.001 mg/mL, 14 nM, 14 fmole injection amount), Table S-1 in supporting material I.
Figure 4.
Observed migration time versus calculated pI value of identified peptides from the BSA digests with amino acid based cIEF-ESI-MS/MS system. The calculated pI values of peptides were obtained from Proteome Discoverer, and the migration time was obtained from the extracted peptide spectra with Xcalibur.
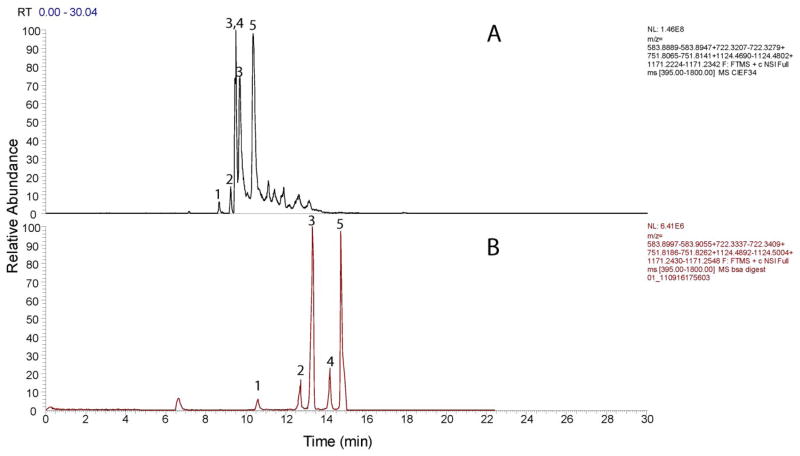
BSA digests (0.1 mg/mL) were also analyzed using conventional ampholyte-based cIEF-ESI-MS/MS in which the concentration of ampholytes was decreased to 0.4% to minimize their interference. 25 ± 4 peptides (sequence coverage 44 ± 6 %) were identified in triplicate analysis, which is comparable with the amino acid based cIEF-ESI-MS/MS. Five acidic peptides with small pI difference were selected from the spectra. Figure 5 shows the extracted ion electropherograms from ampholytes based cIEF-ESI-MS/MS (A) and amino acid based cIEF-ESI-MS/MS (B). For these 5 peptides, baseline separation of peaks can be obtained from amino acid based cIEF. However, peak 3, 4 and 5 cannot be separated baseline with 0.4% ampholyte cIEF. For peptides 1 and 2, the resolution from amino acid and ampholytes based cIEF are 6.8 and 3.5 respectively. Surprisingly, the amino acid based cIEF produces higher resolution than 0.4% ampholyte cIEF. Furthermore, due to the lower molecular weight of amino acids, the mass spectra of these 5 peptides from amino acid based cIEF-ESI-MS/MS are much cleaner than from 0.4% ampholytes based cIEF-ESI-MS/MS (spectra are shown in S-Figure 3), which is quite valuable for peptide identification. In addition, after database searching, the average spectra counts of BSA using amino acid cIEF (74) was nearly twice as high as that produced by 0.4% ampholytes based cIEF (43).
Figure 5.
Selected ions electropherograms of BSA digests from 0.4% Ampholytes based cIEF-ESI-MS/MS (A) and amino acid based cIEF-ESI-MS/MS (B)
1, SHcIAEVEKDAIPENLPPLTADFAEDKDVcK (calculated pI 4.28);
2, EccHGDLLEcADDRADLAK (calculated pI 4.23);
3, YIcDNQDTISSK (calculated pI 4.21);
4, EccHGDLLEcADDR (calculated pI 4.10);
5, EYEATLEEccAK (calculated pI 4.09).
3.5 Analysis of six bovine protein tryptic digests exponential molar mix
A commercial mixture of the tryptic digest of six bovine proteins with five orders of magnitude range in concentration was analyzed by amino acid based cIEF-ESI/MS/MS, table 2. Five proteins were identified in triplicate runs. Carbonic anhydrase and glutamate dehydrogenase can be identified at least in two runs. Three other proteins, including the low abundance alpha casein, were identified in the triplicate runs. The amino acid based cIEF-ESI-MS/MS system identified proteins that range over four orders of magnitude in concentration.
Table 2.
Identification of six bovine protein tryptic digests exponential molar mix by amino acid based CIEF-ESI-MS/MS
| Protein | Qty(fmol) in 20 μL | Injection amount(fmol) (1μL) | Run1 | Run2 | Run3 | Number of identified peptide (Combined) |
|---|---|---|---|---|---|---|
| Beta Lactoglobulin | 500,000 | 25,000 | √ | √ | √ | 9 |
| Lactoperoxidase | 50,000 | 2,500 | √ | √ | √ | 4 |
| Carbonic Anhydrase | 5,000 | 250 | × | √ | √ | 1 |
| Glutamate Dehydrogenase | 500 | 25 | √ | √ | × | 1 |
| Alpha Casein | 50 | 2.5 | √ | √ | √ | 1 |
| Serum Albumin | 5 | 0.25 | × | × | × | 0 |
3.6 Analysis of RAW 264.7 cell extracted proteins
A tryptic digest produced from the RAW 264.7 cell line was analyzed by amino acid based cIEF-ESI-MS/MS. In triplicate runs, 112 protein groups and 303 peptides were identified with both peptide and protein confidence higher than 0.9.
Supplementary Material
Acknowledgments
This work was supported by a grant from the National Institutes of Health (R01 RR031475).
Footnotes
Publisher's Disclaimer: This is a PDF file of an unedited manuscript that has been accepted for publication. As a service to our customers we are providing this early version of the manuscript. The manuscript will undergo copyediting, typesetting, and review of the resulting proof before it is published in its final citable form. Please note that during the production process errors may be discovered which could affect the content, and all legal disclaimers that apply to the journal pertain.
References
- 1.Hjertén S, Elenbring K, Kilar F, Liao JL, Chen AJ, Siebert CJ, Zhu MD. J Chromatogr. 1987;403:47–61. doi: 10.1016/s0021-9673(00)96340-4. [DOI] [PubMed] [Google Scholar]
- 2.Ramsay LM, Dickerson JA, Dada OO, Dovichi NJ. Anal Chem. 2009;81:1741–1746. doi: 10.1021/ac8025948. [DOI] [PMC free article] [PubMed] [Google Scholar]
- 3.Dada OO, Ramsay LM, Dickerson JA, Cermak N, Jiang R, Zhu C, Dovichi NJ. Anal Bioanal Chem. 2010;397:3305–3310. doi: 10.1007/s00216-010-3595-x. [DOI] [PMC free article] [PubMed] [Google Scholar]
- 4.Somma A, Ferranti P, Addeo F, Mauriello R, Chianese L. J Chromatogr A. 2008;1192:294–300. doi: 10.1016/j.chroma.2008.03.051. [DOI] [PubMed] [Google Scholar]
- 5.Silvertand LHH, Toranõ JS, de Jong G, van Bennekom WP. Electrophoresis. 2009;30:1828–1835. doi: 10.1002/elps.200800740. [DOI] [PubMed] [Google Scholar]
- 6.Cheng C, Lu JJ, Wang X, Roberts J, Liu S. Electrophoresis. 2010;31:2614–2621. doi: 10.1002/elps.201000085. [DOI] [PMC free article] [PubMed] [Google Scholar]
- 7.Zhang Z, Wang J, Hui L, Li L. J Chromatogr A. 2011;1218:5336–5343. doi: 10.1016/j.chroma.2011.05.072. [DOI] [PMC free article] [PubMed] [Google Scholar]
- 8.Shen Y, Berger SJ, Anderson GA, Smith RD. Anal Chem. 2000;72:2154–2159. doi: 10.1021/ac991367t. [DOI] [PubMed] [Google Scholar]
- 9.Guo T, Rudnick PA, Wang W, Lee CS, DeVoe DL, Balgley BM. J Proteome Res. 2006;5:1469–1478. doi: 10.1021/pr060065m. [DOI] [PubMed] [Google Scholar]
- 10.Dai L, Li C, Shedden KA, Misek DE, Lubman DM. Electrophoresis. 2009;30:1119–1131. doi: 10.1002/elps.200800505. [DOI] [PMC free article] [PubMed] [Google Scholar]
- 11.Wang W, Guo T, Song T, Lee CS, Balgley BM. Proteomics. 2007;7:1178–1187. doi: 10.1002/pmic.200600722. [DOI] [PubMed] [Google Scholar]
- 12.Wang Y, Rudnick PA, Evans EL, Li J, Zhuang Z, DeVoe DL, Lee CS, Balgley BM. Anal Chem. 2005;77:6549–6556. doi: 10.1021/ac050491b. [DOI] [PubMed] [Google Scholar]
- 13.Zhou F, Johnston MV. Anal Chem. 2004;76:2734–2740. doi: 10.1021/ac035446n. [DOI] [PubMed] [Google Scholar]
- 14.Zhou F, Hanson TE, Johnston MV. Anal Chem. 2007;79:7145–7153. doi: 10.1021/ac071147c. [DOI] [PubMed] [Google Scholar]
- 15.Haselberg R, de Jong GJ, Somsen GW. Electrophoresis. 2011;32:66–82. doi: 10.1002/elps.201000364. [DOI] [PubMed] [Google Scholar]
- 16.Yang L, Lee CS, Hofstadler SA, Pasa-Tolic L, Smith RD. Anal Chem. 1998;70:3235–3241. doi: 10.1021/ac980224o. [DOI] [PubMed] [Google Scholar]
- 17.Tang Q, Hamata AK, Lee G. Anal Chem. 1995;67:3515–3519. [Google Scholar]
- 18.Zhong X, Maxwell EJ, Ratnayake C, Mack S, Chen DDY. Anal Chem. 2012;83:8748–8755. doi: 10.1021/ac202130f. [DOI] [PubMed] [Google Scholar]
- 19.Jensen PK, Paša-Tolić L, Peden KK, Anderson GA, Tolić N, Wong K, Smith RD. Electrophoresis. 2000;21:1372–1380. doi: 10.1002/(SICI)1522-2683(20000401)21:7<1372::AID-ELPS1372>3.0.CO;2-Y. [DOI] [PubMed] [Google Scholar]
- 20.Jensen PK, Pasă-Tolić L, Anderson GA, Horner JA, Lipton MS, Bruce JE, Smith RD. Anal Chem. 1999;71:2076–2084. doi: 10.1021/ac990196p. [DOI] [PubMed] [Google Scholar]
- 21.Lecoeur M, Gareil P, Varenne A. J Chromatogr A. 2010;1217:7293–7301. doi: 10.1016/j.chroma.2010.09.043. [DOI] [PubMed] [Google Scholar]
- 22.Kuroda Y, Yukinaga H, Kitano M, Noguchi T, Nemati M, Shibukawa A, Nakagawa T, Matsuzaki KJ. Pharm Biomed Anal. 2005;37:423–428. doi: 10.1016/j.jpba.2004.11.025. [DOI] [PubMed] [Google Scholar]
- 23.Storms HF, van der Heijden R, Tjaden UR, van der Greef J. Electrophoresis. 2004;25:3461–3467. doi: 10.1002/elps.200406087. [DOI] [PubMed] [Google Scholar]
- 24.Storms HF, van der Heijden R, Tjaden UR, van der Greef J. J Chromatogr B. 2005;824:189–200. doi: 10.1016/j.jchromb.2005.07.020. [DOI] [PubMed] [Google Scholar]
- 25.Caspers ML, Chrambach A. Anal Biochem. 1997;81:28–39. doi: 10.1016/0003-2697(77)90595-4. [DOI] [PubMed] [Google Scholar]
- 26.Wojcik R, Dada OO, Sadilek M, Dovichi NJ. Rapid Commun Mass Spectrom. 2010;24:2554–2560. doi: 10.1002/rcm.4672. [DOI] [PubMed] [Google Scholar]
- 27.Wojcik R, Li Y, Maccoss MJ, Dovichi NJ. Talanta. 2012;88:324–9. doi: 10.1016/j.talanta.2011.10.048. [DOI] [PMC free article] [PubMed] [Google Scholar]
- 28.Li Y, Champion MM, Sun L, Champion PA, Wojcik R, Dovichi NJ. Anal Chem. 2012;84:1617–1622. doi: 10.1021/ac202899p. [DOI] [PMC free article] [PubMed] [Google Scholar]
Associated Data
This section collects any data citations, data availability statements, or supplementary materials included in this article.


