Abstract
Purpose
We sought to predict biopsy progression in men on prostate cancer surveillance.
Materials and Methods
A total of 376 men with a median age of 65.5 years (range 45.8 to 79.5) with low risk prostate cancer on surveillance underwent at least 1 followup biopsy after diagnosis. Progression was defined at surveillance biopsy as Gleason pattern 4 or 5, greater than 2 biopsy cores with cancer or greater than 50% involvement of any core with cancer. Proportional hazards analysis was used to evaluate the association between covariates and progression at surveillance biopsy. The Kaplan-Meier method was used to estimate the probability of disease progression.
Results
Of the 376 men 123 (32.7%) had progression a median of 5.6 years (range 0.3 to 8.5) after diagnosis. Percent free PSA and maximum percent core involvement at diagnosis were associated with progression, allowing stratification of the progression risk at initial surveillance biopsy. Cancer presence and PSA density at initial surveillance biopsy were associated with subsequent progression, allowing stratification of the cumulative incidence of progression 3 years after initial surveillance biopsy (cumulative incidence 11.1%, 95% CI 4.7 to 25.2 for negative biopsy and PSAD less than 0.08 ng/ml/cm3 vs 53.6%, 95% CI 38.6 to 70.0 for positive biopsy and PSAD 0.08 ng/ml/cm3 or greater, log rank test p < 0.0001).
Conclusions
Clinical variables at diagnosis and at first surveillance biopsy during followup in an active surveillance program can be used to inform men about the likelihood of an unfavorable prostate biopsy. This information could improve patient and physician acceptance of active surveillance in carefully selected men.
Keywords: prostate, prostatic neoplasms, biopsy, prostate specific antigen, disease progression
Widespread PSA based screening is thought to have contributed to the decrease in prostate cancer mortality.1,2 However, a combination of opportunistic PSA screening and extended pattern biopsies has resulted in over diagnosis and overtreatment in some men with low grade, low stage prostate cancer whose disease would have otherwise remained undetected during their lifetime.3-5 Active surveillance is an approach that could decrease prostate cancer over-treatment.
Active surveillance with selective delayed definitive therapy is the concept of identifying men with disease whose likelihood of progression is low without treatment and intervening only in those with disease progression during followup.6,7 The rationale behind this approach is that most low risk prostate cancer has an indolent course and the slow growth rate allows sufficient time during followup to detect cancers destined to become more aggressive during a window of curability.
A limitation of surveillance is the imperfect prediction of the likelihood of disease progression during followup in an individual. Thus, physicians and patients may be reluctant to embark on a course of surveillance due to fear of losing the window of opportunity for cure. This uncertainty may in part explain the finding that only 10% of patients with low risk prostate cancer choose surveillance.8 Patients and physicians may be less apprehensive about an initial noncurative approach if risk could be stratified before deciding on surveillance and during followup. Thus, we evaluated the risk of an unfavorable biopsy result based on attributes measured at diagnosis and at initial followup biopsy in men in a previously described surveillance program.7
METHODS
Patient Population
From January 1995 to December 2007, 409 men with suspected low volume, low grade prostate cancer were enrolled in a program of expectant management with curative intent (active surveillance). Enrollment criteria were derived from the study by Epstein et al,9 including PSAD 0.15 ng/ml/cm3 or less, clinical stage T1c and favorable characteristics on needle biopsy (Gleason score 6 or less, 2 or fewer cores positive for cancer and 50% or less of any single core with cancer).
Men were monitored by semiannual PSA measurements and annual 12-core prostate biopsy. Of the 409 men enrolled 376 underwent at least 1 surveillance biopsy after diagnostic biopsy. They represent the study population.
A recommendation for curative intervention was triggered if 1 of certain unfavorable pathological features was found on annual (surveillance) biopsy examination, including Gleason score 7 or greater, or any Gleason pattern 4 or 5, greater than 2 cores positive for cancer or greater than 50% of a single core with cancer. An unfavorable surveillance biopsy was the outcome of interest in this analysis and unfavorable biopsy was defined as progression.
Study Variables
Clinical characteristics in all patients were recorded at diagnosis and during followup, including age, PSA, PSAD, percent free PSA, number of cores positive for cancer, maximum percent core involvement with cancer and diagnosis year. Initial surveillance biopsy results were considered negative when biopsy had no evidence of any cancer and positive when biopsy showed evidence of cancer with favorable pathological findings, as defined.
Statistical Analysis
Two analyses were done, including the risk of progression at initial surveillance biopsy based on attributes measured at diagnosis and the risk of progression at the second or subsequent surveillance biopsy based on attributes measured at initial surveillance biopsy. Multivariate Cox proportional hazards regression analysis in eligible men was done using clinical variables at diagnosis and at initial surveillance biopsy. Optimal cutoffs for these variables were chosen using the univariate log rank test comparing low and high values over a range of possible cutoffs with cutoffs previously defined in the literature used when available. The concordance index was used to evaluate the contribution of individual risk factors to predict unfavorable biopsy. Study variables with a significant association (p <0.05)10 with time to unfavorable initial surveillance biopsy served as criteria to risk stratify patients at diagnosis.
A second multivariate Cox regression analysis of eligible men with at least 2 surveillance biopsies was done using clinical variables available at initial surveillance biopsy. Evidence of progression on biopsy after the initial surveillance biopsy was considered an event in this analysis. Study variables with a significant association (p <0.05) with time to unfavorable biopsy during the remaining followup served as criteria to risk stratify patients at initial surveillance biopsy. Tests for nonproportional hazards using Schoenfeld residuals11 and visual inspection resulted in nonsignificant findings in all analyses.
The cumulative incidence of disease progression was estimated using the Kaplan-Meier method and comparisons were evaluated based on the log rank test. After stratification at diagnosis based on the risk of progression at initial surveillance biopsy patients without progression were restratified at surveillance biopsy based on information collected at the initial surveillance visit. Risk stratification groups with similar survival curves based on the log rank test were combined into 1 group. Men with only 1 followup visit after the enrollment visit were excluded from analysis of followup biopsy results. Statistical significance was considered at p <0.05.
RESULTS
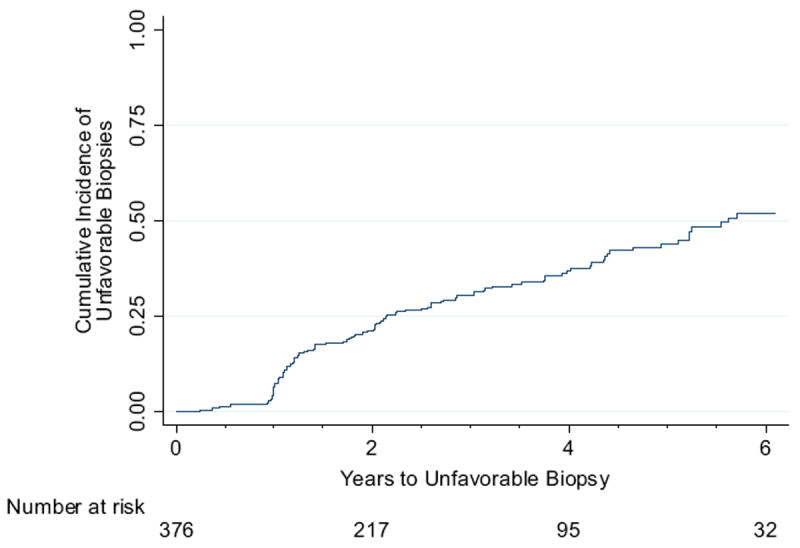
Median followup in the 376 men with at least 1 surveillance biopsy after diagnosis was 2.3 years (range 0.2 to 9.5). Of these men 123 (32.7%) had an unfavorable biopsy (progression) during followup. Median time to progression was 5.6 years (range 0.3 to 8.5) (fig. 1).
Figure 1.

Cumulative incidence of unfavorable biopsy
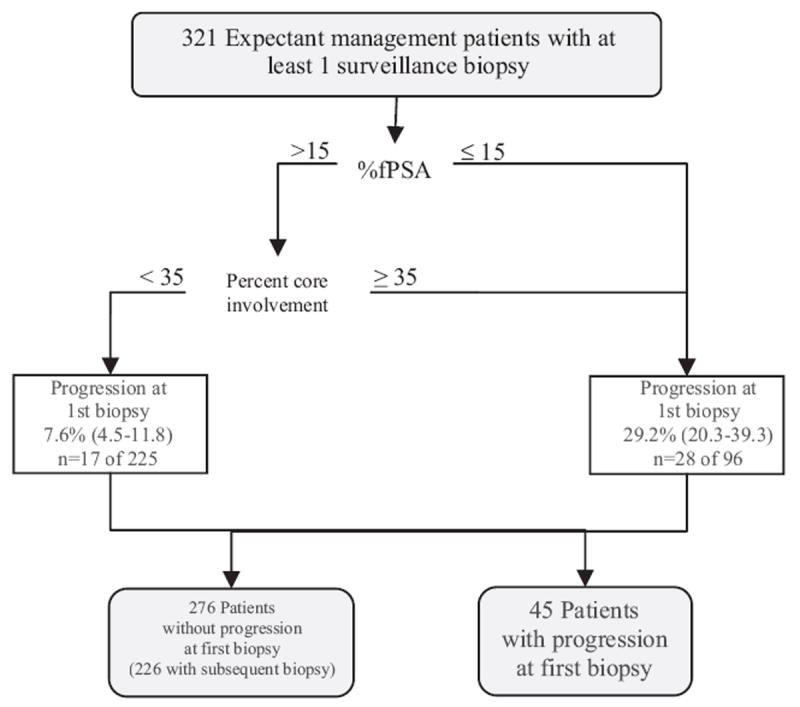
Univariate comparison revealed significant differences in age, PSA, percent fPSA, PSAD, number of cores positive for cancer and maximum percent core involvement with cancer at diagnosis in patients with vs without progression. Univariate Cox proportional hazards analysis of clinical variables at diagnosis showed significant associations between time to unfavorable initial surveillance biopsy, and age, PSAD, maximum percent core involvement with cancer and percent fPSA. On multivariate analysis only maximum percent core involvement 35% or greater and percent fPSA 15% or less were statistically significant independent risk factors. Patients were categorized into 4 groups based on these 2 characteristics, including maximum percent core involvement less than 35% vs 35% or greater and percent fPSA greater than 15% vs 15% or less. Those with only 1 high risk factor (percent fPSA 15% or less, or maximum percent core involvement 35% or greater) were at significantly higher risk than those with no high risk factors but not at significantly different risk from each other and were combined into 1 group. Because only 3 patients had the 2 high risk factors, this group showed no statistically significant difference in risk vs any of the other groups (log rank test p >0.05) and were combined with the group of patients with only 1 high risk factor. Of the patients 225 (7.6%, 95% CI 4.5 to 11.8) with percent fPSA greater than 15 plus maximum percent core involvement less than 35% had evidence of progression at initial surveillance biopsy vs 96 (29.2%, 95% CI 20.3 to 39.3) with percent fPSA 15% or less, or maximum percent core involvement 35% or greater.
Cox proportional hazards analysis of clinical variables determined at initial surveillance biopsy revealed significant univariate associations between time to unfavorable biopsy during all subsequent followup, and age, PSA, PSAD, maximum percent core involvement with cancer, percent fPSA and absent cancer at initial surveillance biopsy. These variables were entered into 2 alternative multivariate proportional hazards models that differed only in whether the biopsy result at the initial surveillance visit was represented by the presence vs the absence of cancer, or by a maximum percent core involvement with cancer of 5% or greater vs less than 5%. The concordance index was used to compare these 2 multivariate models. The concordance index was slightly higher in the multivariate model including absent cancer at initial surveillance biopsy than in the model including maximum percent core involvement greater or less than 5% (0.726 vs 0.714). In these 2 models the only other statistically significant predictor was PSAD 0.08 or greater vs less than 0.08 ng/ml/cm3 (see table).
Table.
Cox proportional hazards regression models of prostate cancer progression risk during followup using patient characteristics available at surveillance biopsy 1
| Variables* | No. Progression/No. Subgroup Pts | Univariate
|
Multivariate 1
|
Multivariate 2
|
|||
|---|---|---|---|---|---|---|---|
| Adjusted HR (95% CI) | p Value | HR (95% CI) | p Value | HR (95% CI) | p Value | ||
| Age at biopsy: | 0.006 | 0.173 | 0.109 | ||||
| Less than 70 | 55/220 | 1 (referent) | 1 (referent) | 1 (referent) | |||
| 70 or Greater | 18/47 | 2.1 (1.3, 3.7) | 1.6 (0.8, 3.0) | 1.7 (0.9, 3.2) | |||
| PSA at biopsy (ng/ml): | 0.013 | 0.369 | 0.305 | ||||
| Less than 3.0 | 11/81 | 1 (referent) | 1 (referent) | 1 (referent) | |||
| 3.0 or Greater | 62/186 | 2.3 (1.2, 4.3) | 1.5 (0.6, 3.5) | 1.6 (0.7, 3.6) | |||
| PSA density (ng/ml/cm3): | <0.001 | 0.016 | 0.040 | ||||
| Less than 0.08 | 24/135 | 1 (referent) | 1 (referent) | 1 (referent) | |||
| 0.08 or Greater | 46/114 | 2.5 (1.5, 4.1) | 2.2 (1.2, 4.2) | 1.9 (1.0, 3.5) | |||
| % PSA at diagnosis: | 0.040 | 0.395 | 0.316 | ||||
| Greater than 15 | 46/190 | 1 (referent) | 1 (referent) | 1 (referent) | |||
| 15 or Less | 20/52 | 1.7 (1.0, 2.9) | 1.3 (0.7, 2.3) | 1.3 (0.8, 2.3) | |||
| Max % core Ca involvement: | <0.001 | <0.001 | |||||
| Less than 5 | 42/212 | 1 (referent) | 1 (referent) | ||||
| 5 or Greater | 31/54 | 3.7 (2.3, 5.8) | 3.4 (2.1, 5.7) | ||||
| Initial surveillance biopsy result: | <0.001 | <0.001 | |||||
| Neg | 21/152 | 1 (referent) | 1 (referent) | ||||
| Pos | 52/115 | 3.8 (2.3, 6.2) | 3.5 (2.0, 6.0) | ||||
In 226 men with at least 2 followup biopsies after the diagnostic biopsy, including 64 with and 162 without unfavorable biopsy result at the first surveillance biopsy, with followup defined as the date of initial surveillance biopsy to the date of unfavorable biopsy or the last favorable biopsy in censored patients, and with censoring of those who were lost to followup, withdrew or had died by the last biopsy date.
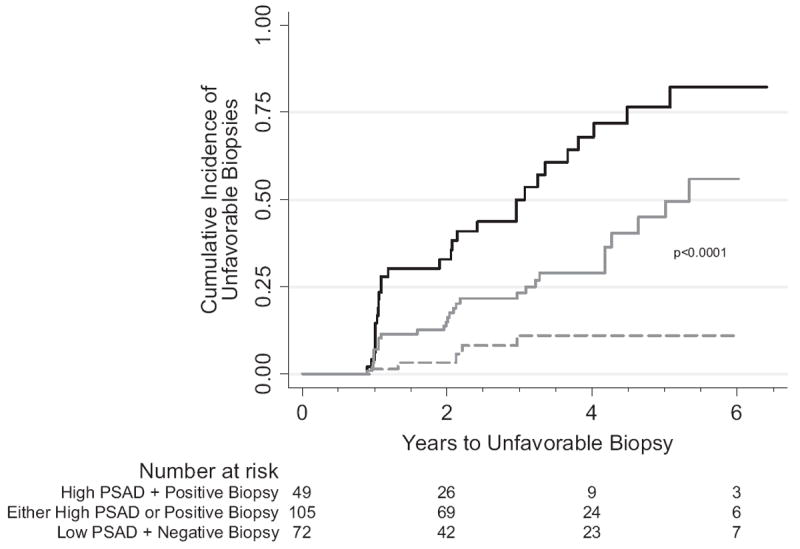
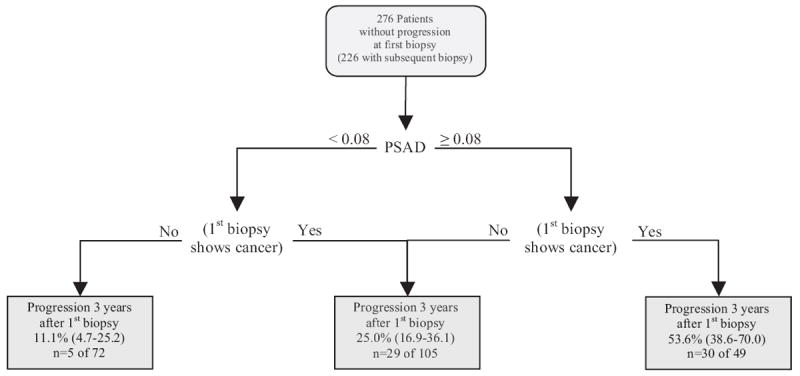
Patients were categorized into 4 groups based on initial surveillance biopsy results (negative vs positive) and PSAD (less than 0.08 vs 0.08 ng/ml/cm3 or greater). Two groups (negative biopsy plus PSAD 0.08 ng/ml/cm3 or greater and positive biopsy plus PSAD less than 0.08 ng/ml/cm3) were at similar risk by the log rank test and were combined into 1 intermediate risk group. The other 2 groups (negative biopsy plus PSAD less than 0.08 ng/ml/cm3, and positive biopsy plus PSAD 0.08 ng/ml/cm3 or greater) were at risks that significantly differed from each other (log rank test p <0.05, fig. 2) and from the intermediate risk group. Thus, these 2 groups were classified as at low and high risk, respectively. In the 3 groups the 3-year probability of cancer progression after initial surveillance biopsy was a cumulative incidence of 11.1% (95% CI 4.7 to 25.2) in the 72 men with negative biopsy plus PSAD less than 0.08 ng/ml/cm3, a cumulative incidence of 25.0% (95% CI 16.9 to 36.1) in the 105 with negative biopsy plus PSAD 0.08 ng/ml/cm3 or greater, or positive biopsy plus PSAD less than 0.08 ng/ml/cm3, and a cumulative incidence of 53.6% (95% CI 38.6 to 70.0) in the 49 with positive biopsy plus PSAD 0.08 ng/ml/cm3 or greater (log rank test p <0.0001).
Figure 2.

Unfavorable biopsy unadjusted Kaplan-Meier cumulative event curves in patients at low—low PSAD (less than 0.08 ng/ml/cm3) plus negative biopsy (dashed curve), intermediate—high PSAD or positive biopsy (solid gray curve) and high—high PSAD (0.08 ng/ml/cm3 or greater) plus positive biopsy (solid black curve) risk based on biopsy results and PSAD at initial surveillance visit (high vs intermediate vs low risk log rank test p <0.0001).
Figures 3 and 4 show our risk stratification. Initially percent fPSA and maximum percent core involvement at diagnosis were used to risk stratify patients based on the likelihood of unfavorable biopsy at the initial surveillance visit (fig. 3). At the initial surveillance visit at a median 0.7 years (range 0.1 to 4.8) after diagnosis PSAD and biopsy results augmented our predictive ability in cases without progression at the initial surveillance biopsy. All patients without progression at the initial surveillance biopsy were restratified based on the likelihood of unfavorable biopsy after the initial surveillance visit (fig. 4).
Figure 3.

Cumulative incidence of unfavorable biopsy (progression) (white boxes) at initial surveillance biopsy based on percent fPSA (greater than 15% vs 15% or less) and maximum percent core involvement with cancer (less than 35% vs 35% or greater) at diagnosis. n, total number of events at any time during followup in total number of patients at start of followup. Values in parentheses represent 95% CI.
Figure 4.

Cumulative incidence of unfavorable biopsy (progression) (gray boxes) 3 years after initial surveillance biopsy in men without unfavorable biopsy at initial surveillance biopsy was based on initial surveillance biopsy results (negative vs positive for cancer if favorable pathological findings) and PSAD (less than 0.08 vs 0.08 ng/ml/cm3 or greater). n, total number of events at any time during followup in total number of patients at start of followup. Values in parentheses represent 95% CI.
DISCUSSION
We combined clinical variables at prostate cancer diagnosis with data gathered during followup in an active surveillance program to improve prediction of an unfavorable followup prostate biopsy at initial surveillance biopsy and 3 years afterward. We created risk stratification for an unfavorable prostate biopsy at the initial surveillance visit based on information available at diagnosis (percent fPSA and maximum percent of core involved with cancer) and then further risk stratified for a future unfavorable surveillance biopsy based on PSAD and biopsy results at the initial surveillance visit.
It is generally accepted that the ideal candidate for active surveillance who is least likely to experience progression without treatment has low risk prostate cancer (stage T1c to T2a, PSA 10 ng/ml or less and Gleason score 6 or less).12 Younger age at entry,13,14 higher baseline PSA15,16 and increasing PSA with followup,6,13,14,17 higher clinical stage at baseline,6 baseline biopsy criteria (higher Gleason score and a higher percent of positive cores)13,16 and repeat biopsy results15,18 are associated with the risk of intervention in prostate cancer surveillance programs. Our approach to selecting men for prostate cancer surveillance may be more conservative than that of others. We use strict enrollment criteria9 that in effect select candidates from the larger pool of those with low risk cancer and exclude those with palpable disease (T2a or above) and higher volume on biopsy (greater than 2 cores or greater than 50% involvement of any core). Also, our trigger for intervention is based on annual surveillance prostate biopsy findings and not PSA kinetics because we found extensive overlap in PSA kinetics between those with and without progression.7
Despite favorable outcomes with active surveillance protocols19 around 90% of men with low risk prostate cancer undergo some form of active treatment after prostate cancer diagnosis.8 Given the findings of a randomized trial comparing surgery to watchful waiting in men with nonscreen detected cancers that showed a 0.1% difference in prostate cancer specific death after 12 years in those older than 65 years, it seems likely that surveillance is an underused strategy today.20 This is particularly relevant since almost half of the cancers detected today have low risk features21 and average age at diagnosis is greater than 65 years.
There may be numerous obstacles to acceptance of surveillance as a rational treatment option in men with low risk cancer, including concerns of missing an opportunity for cure, the litigious health care environment in the United States, established practice patterns and monetary motivations. To the extent that uncertainty about the risk of disease progression may have a role in discouraging men from pursuing a surveillance strategy, stratification of men into risk groups could allay some of these concerns and possibly increase acceptance of surveillance as a management option. For example, a man with high percent fPSA and a low maximum percent core involvement with cancer who elects surveillance may be reassured to know that his risk of progression at the first surveillance biopsy is only 7.6% (fig. 3). One year later the same man may have a different view of continuing with surveillance depending on the results of the first surveillance biopsy and PSAD, which can further stratify his risk as 11% or 54% (fig. 4).
Our study has some important limitations. 1) Our definition of progression (unfavorable biopsy) may be an imperfect proxy for the true biological potential of a tumor and an unfavorable biopsy could reflect disease that was missed at diagnosis and not true disease progression. 2) Our study population was highly selected based on strict criteria that would limit the generalizability of our results to men with low risk cancer who may not meet our criteria for surveillance. 3) We have little information on patients before study entry. Thus, we assumed that they entered the study at the same point during the course of the cancer. 4) Our risk strata are based on optimal cutoffs and, thus, are subject to over fitting. Validation of these cutoffs is needed in an independent sample. 5) There could be other clinical parameters, eg mm cancer involvement in a biopsy core, that may be as or more predictive of progression that we did not evaluate.
CONCLUSIONS
Briefly, in men with low risk prostate cancer who are carefully selected for active surveillance it is possible to reclassify risk based on clinical features at diagnosis with further risk stratification based on the results of surveillance biopsy. This information could be used to counsel men who are considering active surveillance for newly diagnosed prostate cancer and reassure them or encourage curative intervention, depending on their risk aversion, after surveillance biopsy.
Acknowledgments
Drs. Marie Diener-West, Mei-Cheng Wang and Richard Thompson provided statistical advice.
Supported by The Johns Hopkins Predoctoral Clinical Research Training Program Grant 5T32RR-023253 from the National Center for Research Resources, Bethesda, Maryland (KT).
Study received institutional review board approval.
Abbreviations and Acronyms
- fPSA
free PSA
- PSA
prostate specific antigen
- PSAD
PSA density
References
- 1.Etzioni R, Tsodikov A, Mariotto A, et al. Quantifying the role of PSA screening in the US prostate cancer mortality decline. Cancer Causes Control. 2008;19:175. doi: 10.1007/s10552-007-9083-8. [DOI] [PMC free article] [PubMed] [Google Scholar]
- 2.Schröder FH, Hugosson J, Roobol MJ, et al. Screening and prostate-cancer mortality in a randomized European study. N Engl J Med. 2009;360:1320. doi: 10.1056/NEJMoa0810084. [DOI] [PubMed] [Google Scholar]
- 3.Etzioni R, Penson DF, Legler JM, et al. Overdiagnosis due to prostate-specific antigen screening: lessons from U.S. prostate cancer incidence trends. J Natl Cancer Inst. 2002;94:981. doi: 10.1093/jnci/94.13.981. [DOI] [PubMed] [Google Scholar]
- 4.Draisma G, Boer R, Otto SJ, et al. Lead times and overdetection due to prostate-specific antigen screening: estimates from the European Randomized Study of Screening for Prostate Cancer. J NatlCancer Inst. 2003;95:868. doi: 10.1093/jnci/95.12.868. [DOI] [PubMed] [Google Scholar]
- 5.Telesca D, Etzioni R, Gulati R. Estimating lead time and overdiagnosis associated with PSA screening from prostate cancer incidence trends. Biometrics. 2008;64:10. doi: 10.1111/j.1541-0420.2007.00825.x. [DOI] [PubMed] [Google Scholar]
- 6.Klotz L. Active surveillance for prostate cancer: for whom? J Clin Oncol. 2005;23:8165. doi: 10.1200/JCO.2005.03.3134. [DOI] [PubMed] [Google Scholar]
- 7.Carter HB, Kettermann A, Warlick C, et al. Expectant management of prostate cancer with curative intent: an update of the Johns Hopkins experience. J Urol. 2007;178:2359. doi: 10.1016/j.juro.2007.08.039. [DOI] [PMC free article] [PubMed] [Google Scholar]
- 8.Cooperberg MR, Broering JM, Kantoff PW, et al. Contemporary trends in low risk prostate cancer: risk assessment and treatment. J Urol. 2007;178:S14. doi: 10.1016/j.juro.2007.03.135. [DOI] [PMC free article] [PubMed] [Google Scholar]
- 9.Epstein JI, Walsh PC, Carmichael M, et al. Pathologic and clinical findings to predict tumor extent of nonpalpable (stage T1c) prostate cancer. JAMA. 1994;271:368. [PubMed] [Google Scholar]
- 10.Maldonado G, Greenland S. Simulation study of confounder-selection strategies. Am J Epidemiol. 1993;138:923. doi: 10.1093/oxfordjournals.aje.a116813. [DOI] [PubMed] [Google Scholar]
- 11.Schoenfeld D. Chi-squared goodness-of-fit tests for the proportional hazards regression model. Biometrika. 1980;67:145. [Google Scholar]
- 12.D’amico AV, Whittington R, Malkowicz SB, et al. Predicting prostate specific antigen outcome pre-operatively in the prostate specific antigen era. J Urol. 2001;166:2185. [PubMed] [Google Scholar]
- 13.el-Geneidy M, Garzotto M, Panagiotou I, et al. Delayed therapy with curative intent in a contemporary prostate cancer watchful-waiting cohort. BJU Int. 2004;93:510. doi: 10.1111/j.1464-410x.2003.04669.x. [DOI] [PubMed] [Google Scholar]
- 14.Carter CA, Donahue T, Sun L, et al. Temporarily deferred therapy (watchful waiting) for men younger than 70 years and with low-risk localized prostate cancer in the prostate specific antigen era. J Clin Oncol. 2003;21:4001. doi: 10.1200/JCO.2003.04.092. [DOI] [PubMed] [Google Scholar]
- 15.Patel MI, DeConcini DT, Lopez-Corona E, et al. An analysis of men with clinically localized prostate cancer who deferred definitive therapy. J Urol. 2004;171:1520. doi: 10.1097/01.ju.0000118224.54949.78. [DOI] [PubMed] [Google Scholar]
- 16.Eastham JA, Kattan MW, Fearn P, et al. Local progression among men with conservatively treated localized prostate cancer: results from the Transatlantic Prostate Group. Transatlantic Prostate Group. Eur Urol. 2008;53:347. doi: 10.1016/j.eururo.2007.05.015. [DOI] [PMC free article] [PubMed] [Google Scholar]
- 17.Khatami A, Aus G, Damber JE, et al. PSA doubling time predicts the outcome after active surveillance in screening-detected prostate cancer: results from the European Randomised Study of Screening for Prostate Cancer, Sweden Section. Int J Cancer. 2006;120:170. doi: 10.1002/ijc.22161. [DOI] [PubMed] [Google Scholar]
- 18.Al Otaibi M, Ross P, Fahmy N, et al. Role of repeated biopsy of the prostate in predicting disease progression in patients with prostate cancer on active surveillance. Cancer. 2008;113:286. doi: 10.1002/cncr.23575. [DOI] [PubMed] [Google Scholar]
- 19.Dall’era MA, Cooperberg MR, Chan JM, et al. Active surveillance for early-stage prostate cancer: review of the current literature. Cancer. 2008;112:1650. doi: 10.1002/cncr.23373. [DOI] [PubMed] [Google Scholar]
- 20.Barocas DA, Cowan JE, Smith JA, Jr, et al. CaPSURE Investigators. What percentage of patients with newly diagnosed carcinoma of the prostate are candidates for surveillance? An analysis of the CaPSURE™ database. J Urol. 2008;180:1330. doi: 10.1016/j.juro.2008.06.019. [DOI] [PubMed] [Google Scholar]
- 21.Cooperberg MR, Moul JW, Carroll PR. The changing face of prostate cancer. J Clin Oncol. 2005;23:8146. doi: 10.1200/JCO.2005.02.9751. [DOI] [PubMed] [Google Scholar]


