Abstract
Care of patients with Type 1 diabetes (T1D) has changed during the last 30 years. Tools to control glycemia have improved and it was demonstrated that improvement in glycemic control diminished the risk of late diabetic complications, including nephropathy. Moreover, in patients with impaired renal function, aggressive treatment of hypertension and reno-protective blockade of the renin-angiotensin system were shown to postpone end-stage renal disease (ESRD), albeit for a short while. Despite these achievements, the incidence of ESRD due to T1D in the US population has not decreased but rather has increased over the last 20 years, although it now occurs at slightly older ages.
This state of affairs is a call to action. This should begin with adopting a new model of diabetic nephropathy in humans. In that model, instead of microalbuminuria or proteinuria, the focus should be on diagnosis and treatment of progressive renal function decline that leads to ESRD. Such a model has received significant support in clinical and epidemiological studies. Investigation of mechanisms of such progressive renal function decline should help in the identification of new therapeutic targets and the development of new interventions. To evaluate these interventions, accurate diagnostic algorithms are needed so T1D patients will be stratified according to time to onset to ESRD. Consistent with concepts of personalized medicine, the new interventions should be tailored to and evaluated in patients predicted to have rapid, moderate or even slow progression to ESRD.
Efforts to Prevent and Treat Diabetic Nephropathy in T1D
Over the last 30 years, significant progress has been made in understanding the pathogenesis of diabetic nephropathy. Recent reviews provide excellent summaries of that body of knowledge (1–3). Paralleling the basic research investigations, observational studies have been conducted to identify risk factors for diabetic nephropathy, as well as clinical trials to prevent or postpone the occurrence of various manifestations of diabetic nephropathy in humans. The latter two areas are summarized below.
A large body of observational data points to a strong relationship between glycemic control and various manifestations of diabetic nephropathy. Some aspects of these observations were finally confirmed by the results of the DCCT. Patients with intensive insulin treatment achieved better glycemic control and had a lower risk of microalbuminuria and CKD stage 3 than those with traditional treatment and poorer glycemic control (4,5). However, the DCCT could not shed light on whether or not improved glycemic control reduces rate of renal function decline and postpones the onset of ESRD in patients with existing micro- or macroalbuminuria or impaired renal function. Nevertheless, the DCCT findings have been embraced as evidence that by improving glycemia to achieve normal values of HbA1c (or at least below 7.0%) one should be able to prevent complications in T1D including diabetic nephropathy (6). The difficulty with this recommendation is that the majority of patients are unable to achieve this level of glycemic control (7,8). Almost half of the patients with T1D have an HbA1c value above 8.0%, a threshold above which the risk of kidney complication increases exponentially (9).
Evidence has also accumulated that elevated blood pressure plays a role in the development of microalbuminuria and its progression to proteinuria and ESRD (10,11). Clinical trials have demonstrated beneficial effects of antihypertensive treatment on renal as well as non-renal outcomes in patients with diabetes (12,13). This led to the clinical recommendation to treat hypertension aggressively as a means to prevent and postpone early, as well as advanced, diabetic nephropathy (6). As a result of these recommendations, the frequency of treatment with antihypertensive drugs increased in patients with diabetess but blood pressure levels have been reduced only slightly during the last 20 years (7, 14).
Animal studies carried out in 1980s and 1990s fostered the development of a hypothesis that risk of diabetic nephropathy may be reduced by inhibition of the renin-angiotensin system (RAS) (15,16). However, while these therapies postponed the onset of ESRD in T1D patients with proteinuria in the Collaborative Study Group’s captopril trial, albeit for only a short time (17), they did not show a beneficial effect on preventing early nephropathy in the recent RASS clinical trial by Mauer and colleagues (18). Other studies of the effect of RAS-inhibition on early nephropathy were generally of short duration and included urinary albumin excretion only as an outcome measure (19,20).
In contrast, the RASS trial lasted almost 5 years and examined multiple kidney manifestations in patients with T1D and normoalbuminuria. RAS-inhibition not only failed to prevent the development of microalbuminuria, but also failed to mitigate early renal function decline or diminish early morphologic changes in the kidney. The RASS trial not only raised doubts about the effectiveness of RAS-inhibition in modifying natural history of early diabetic nephropathy, it also provided evidence against the existing model of this complication (21). Changes in microalbuminuria were inconsistently associated with renal function decline or with progression of morphological lesions. This “uncoupling” of renal function decline from urinary albumin excretion confirmed the findings observed in the previous studies (22,23).
Risk of End Stage Renal Disease in T1D Is Still High
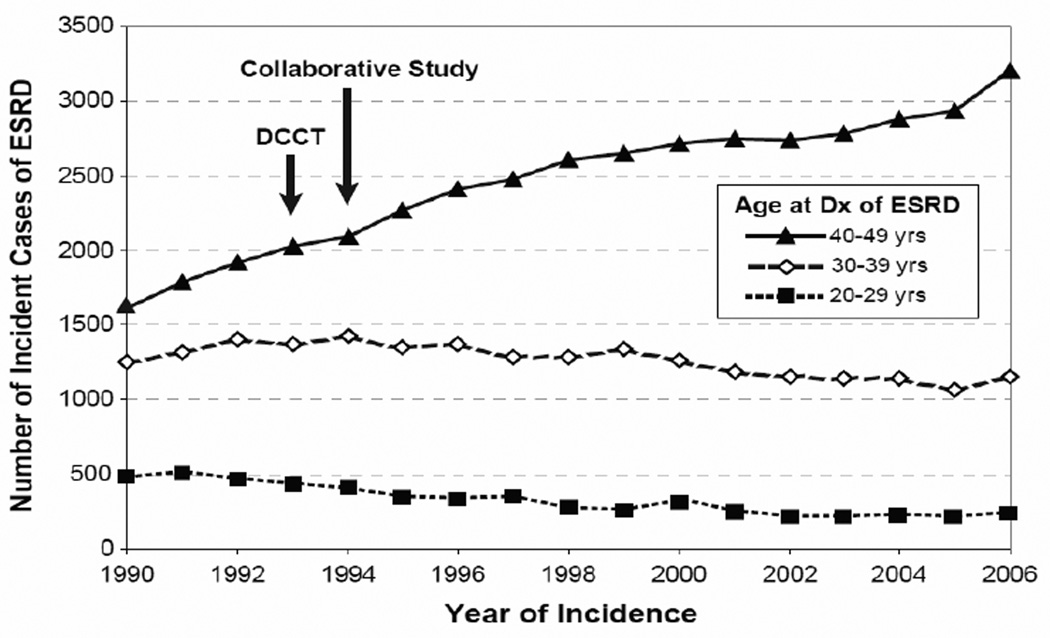
The results of clinical trials such as DCCT or the Collaborative Study Group’s captopril trial were conducted in selected populations and were assumed to be generalizable to the whole population of patients with T1D. If true, wide implementation of these treatments would reduce the risk of ESRD, the ultimate manifestation of diabetic nephropathy in T1D. To investigate that assumption, we obtained the number of incident cases of ESRD attributed to diabetes that were registered by the US Renal Data System (http://www.usrds.org/) between 1990–2006 in the Caucasian US population aged 20–49 years (24). In this population segment, T1D is the predominant diabetes type, and almost the exclusive type, in patients with sufficient duration (at least 15 years) to develop ESRD due to diabetes. The number of incidence cases is plotted in Figure 1 according to calendar time and age at onset of ESRD.
Figure 1.
Number of incident cases of ESRD in the US Caucasian population attributed to T1D according to calendar time and age at ESRD onset. Arrows indicate publication of the DCCT and the Collaborative Study. Because data on the number of patients with T1D duration >15 years (and therefore at risk of ESRD) in the US population are not available, an incidence rate was not computed. (Reproduce from ref. #24)
In this population, incident cases of ESRD attributed to diabetes numbered 3359 in 1990; 3972 in 1995; 4287 in 2000; and 4600 in 2006, an increase of about 9% per year. The age distribution changed. While cases aged 20–29 or 30–39 years declined slightly, those aged 40–49 years almost doubled. This suggests that while improved care of T1D did not prevent an increased risk of ESRD, it may have postponed its occurrence to an older age/longer duration of T1D.
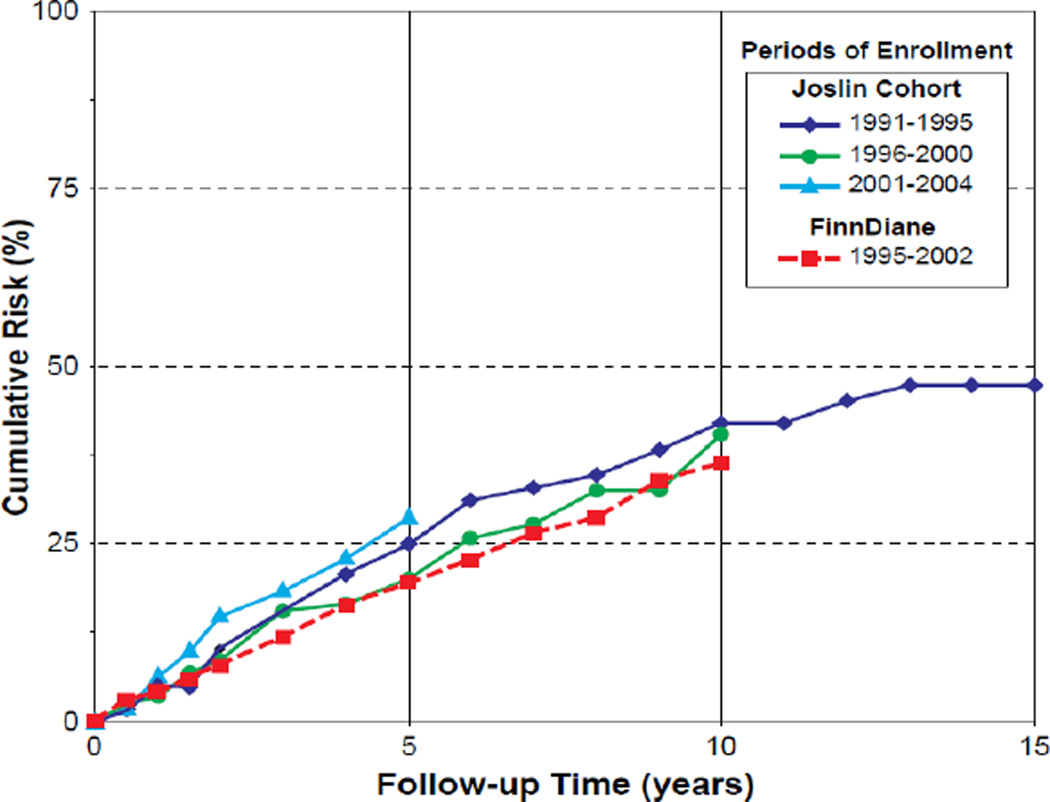
The natural history of proteinuria in T1D and the impact of modern therapies on its progression to ESRD were recently investigated in the cohort of patients attending the Joslin Clinic in Boston and in the nationwide cohort of similar patients in Finland, referred to as FinnDiane cohort (24,25). Long-term observations of these cohorts spotlighted several unexpected findings. First, the majority of patients with proteinuria in both cohorts had poor glycemic control (24,25). Second, the risk of ESRD remained high in the Joslin cohort over nearly two decades and was strikingly similar to that in the FinnDiane cohort (Figure 2). The cumulative risk of ESRD in the Joslin cohort after 5, 10 and 15 years of follow-up was 25%, 40% and 47%, respectively. These risks did not diminish in sub-cohorts recruited in successive 5-year intervals, although prescription of reno-protective therapies and antihypertensive treatment increased from about 50 to 80% in the same sub-cohorts. The cumulative risk in the FinnDiane cohort was almost identical. Third, mortality unrelated to ESRD, which competes with ESRD as the fate for patients with proteinuria, emerged as a relatively minor competitor. In both cohorts, only one death occurred for five new cases of ESRD. After the onset of ESRD, however, mortality was very high despite universal availability of renal replacement therapies in both cohorts.
Figure 2.
Cumulative risk of ESRD according to follow-up time and cohort and according to calendar time of entry into follow-up in the Joslin cohort (Data adapted from ref. #24) and in the FinnDiane cohort (data adapted from ref. #25).
In conclusion, improvements in care of T1D patients over the last 30 years did not reduce their ESRD risk. Although better implementation of the current clinical protocols in the future may slightly improve glycemic control and extend reno-protective therapies to a larger proportion of patients, such gains are unlikely to dramatically reduce risk of ESRD. Prevention or postponement of ESRD in T1D by decades, not just months or couple years, requires replacing the old paradigm of diabetic nephropathy centered on urinary albumin abnormalities to a new model focused on progressive renal function decline, and considering new pathophysiological pathways, so more targeted new therapies can be developed. Also new, more effective ways of evaluating these therapies are needed.
Progressive Renal Function Decline: New paradigm of diabetic nephropathy
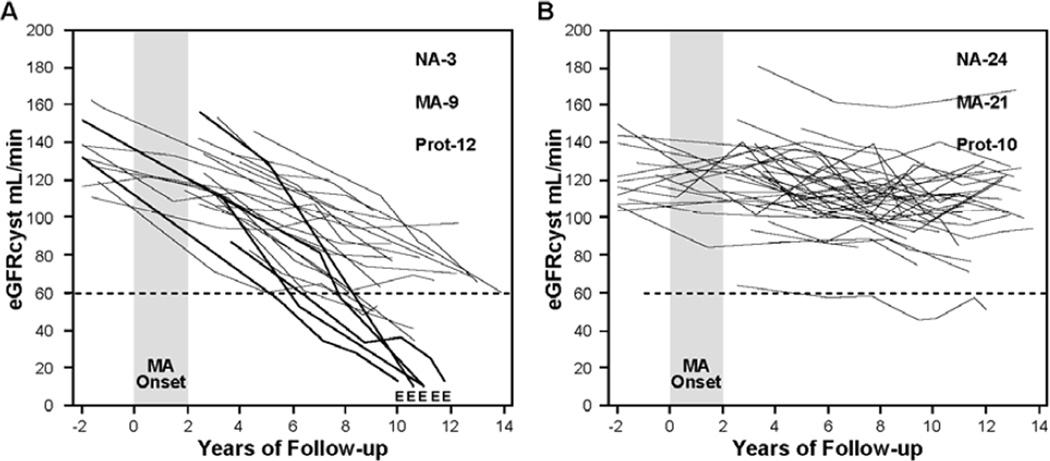
The disease model of diabetic nephropathy articulated in the 1990s perceived it as a continuous process that manifests itself first as microalbuminuria and then progresses to proteinuria, which in turn causes kidney injury and ESRD (21). Research during the last decade, however, has clearly shown that abnormal urinary excretion of albumin and renal function decline are two separable manifestations of diabetic nephropathy, rather than two successive stages of one disease process. Abnormal urinary albumin excretion waxes and wanes (progresses and regresses) under the influence of one set of factors (26), and renal function decline progresses to ESRD under the influence of a different set of factors (23,27). While the two manifestations can progress in parallel, changes in one are not well correlated with changes in the other. This is most likely because the two sets of causal factors overlap but only partially. As a result, some patients have abnormal urinary albumin excretion that progresses, regresses or simply persists, and all the while their renal function remains stable. On the other hand, renal function decline is initiated in a subset of patients with microalbuminuria and proteinuria and it progresses to ESRD regardless of the variation in urinary albumin excretion. Trajectories of renal function changes over long follow-up in patients with T1D and micraolbuminuria or proteinuria are shown in Figure 3 & 4.
Figure 3. Trajectories of renal function changes in patients with T1D and new onset microalbuminuria who were followed for 12 years.
MA onset – 2 year interval during which multiple determinations of ACR became elevated; E – date when ESRD was diagnosed; eGFRcyst – glomerular filtration rate estimated from serial measurements of serum cystatin C. At the end of follow-up numbers of patients with various categories of AER are reported: NA – normoalbuminuria, MA - microalbuminuria, Prot – proteinuria.
Panel A shows patients with early progressive renal function decline (decliners). eGFRcyst slopes in these patients were faster than −3.3% ml/min/year.
Panel B shows patients with stable renal function (non-decliners). eGFRcyst slopes of these patients were slower than −3.3% per/min/year. Figure adapted from reference # 28 and supplemented with unpublished data about patients who developed ESRD.
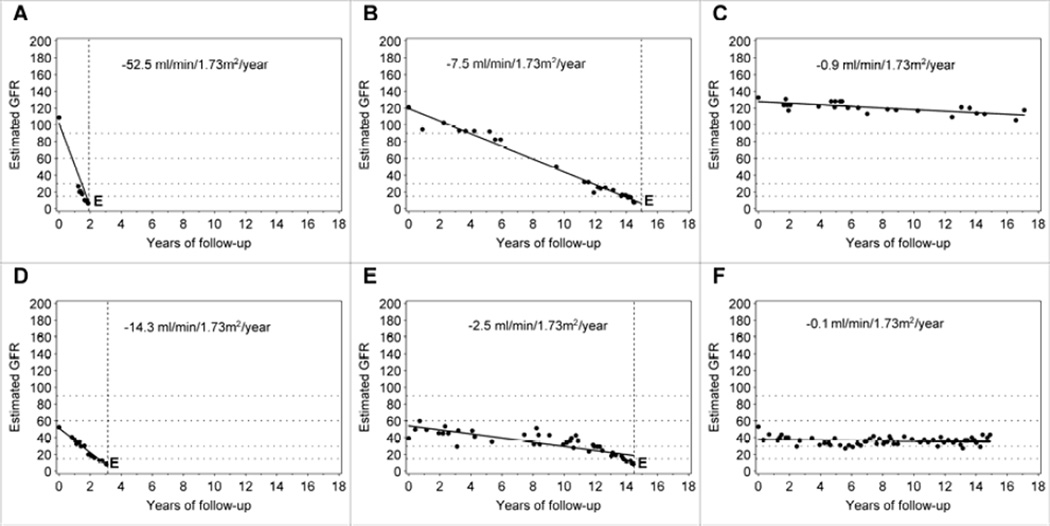
Figure 4. Examples of trajectories of changes in renal function in patients with T1D and proteinuria.
Upper row: For the patient in Panel 4A, eGFR loss was 52.5 ml/min/year and renal function progressed from normal to ESRD within 2 years. For the patient in Panel 4B, eGFR loss was 20 ml/min/year and renal function progressed from normal to ESRD within 6 years. For the patient in panel 4C, eGFR loss was 4ml/min/year, and renal functiont is estimated to progress from normal to ESRD within 20 years.
Lower row: The eGFR loss in this patient represents the median of the distribution of eGFR loss in a large cohort of patients with proteinuria who entered observation with normal renal function and were followed for 5–18 years (Adapted from reference # 29)
The characteristics of renal function variation over time in patients with microalbuminuria was determined by serial measurements of serum cystatin C to estimate GFR (eGFRcyst) are illustrated in Figure 3. In the Joslin cohort of 79 patients with normal renal function and new onset of microalbuminuria, 24 (30%) developed early progressive renal function decline during 10 years of follow up (Figure 3 A) (28). Renal function decline began at the time or soon after the development of microalbuminuria and the significant rate of eGFRcyst decline continued to be constant during the subsequent follow-up. This decline within an individual was linear and could be well represented by a simple regression slope. However, the rates of eGFR loss per year (steepness of the slope) varied widely among individuals. Within 10 years of follow-up, almost half (10 patients) reached CKD stage 3 and in 5 of them the eGFRcyst decline was so rapid that they progressed to ESRD. The rest of the decliners will most likely reach CKD stage 3 during the next 10 years of follow-up assuming their trajectories of eGFR decline remain linear. It is interesting that the distribution of AER during the 2-year interval when new onset microalbuminuria occurred was not different between patients in panel A and B. However, during follow-up, half of the decliners, and only one fifth of non-decliners, developed proteinuria. All patients who progressed to ESRD had proteinuria before they reached CKD stage 3. Panel B illustrates eGFRcyst trajectories in patients with new onset microalbuminuria who had stable renal function during 10 years of follow-up. During this time, almost half of these non-decliners regressed to normoalbuminuria, and the rest had persistent microalbuminuria or even progressed to proteinuria.
We recently examined the trajectories of renal function changes over time using estimated GFR based on serum creatinine (eGFRcreat) in the Joslin cohort of patients with T1D and proteinuria (29). In this cohort, 240 patients entered the study with normal eGFRcreat (above 60 ml/min) and were followed for 5 to 18 years. Slightly less than half of this group had stable renal function during follow-up and most likely will not develop ESRD despite proteinuria poor glycemic control and hypertension. The rest of the group had renal function decline that was faster than 3.5 ml/min/loss/year. Similarly, as in patients with new onset microalbuminuria, the decline within an individual in those with proteinuria was linear and could be well represented in the majority of patients by a simple regression slope. However, the rates of eGFRcreat loss per year (steepness of the slope) varied widely among individuals. The two characteristics of trajectories of eGFRcreat changes are well illustrated in the estimated GFR trajectories of individual subjects in Figure 4. The slopes were linear and the rates of eGFRcreat loss ranged from very rapid (−52.5 ml/min/year, panel A) to moderate (−7.5 ml/min/year, panel B), and to minimal (−0.9 ml/min/year, panel C) in those who entered the study with proteinuria and normal renal function. It is interesting that almost the same distribution of eGFR loss was seen in the Rosolowsky et al. study in patients who entered the follow-up period with CKD3 as in those with normal eGFRcreat as discussed above. The examples of rapid, moderate and non-progressors are shown in Figure 4 in panel D, E and F.
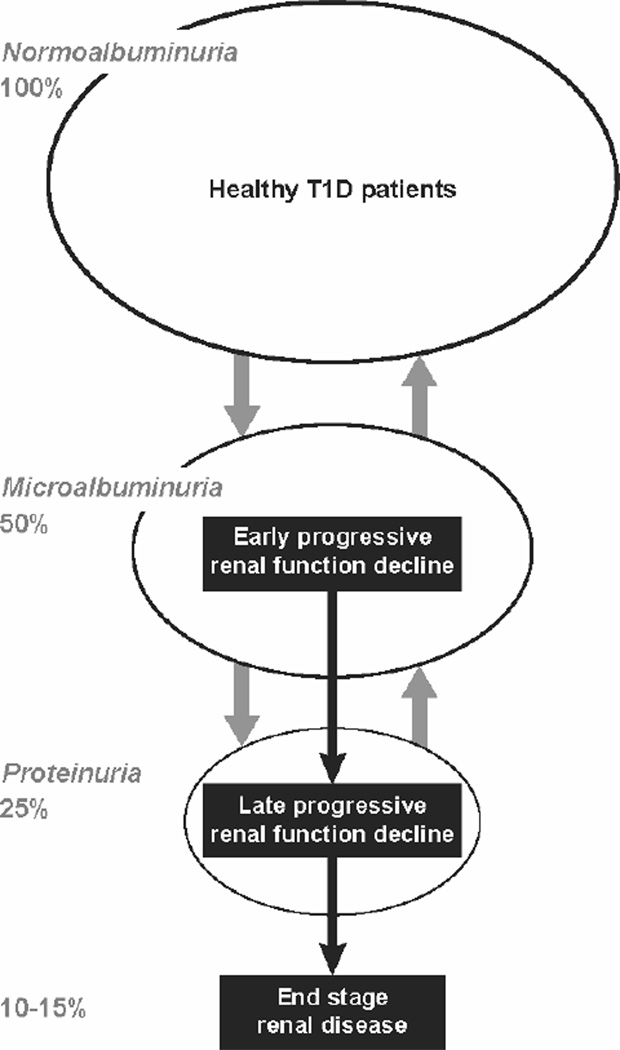
The data presented in Figure 3 unequivocally demonstrates that the progressive renal function decline and not abnormal urinary albumin excretion is the best clinical manifestation of the disease process underlying the development of impaired renal function and ESRD in T1D. The new model of diabetic nephropathy, which we refer to as progressive diabetic nephropathy, incorporates this in a diagram in Figure 5. Progressive renal function decline is represented as a one-directional process superimposed upon a background of abnormal urinary albumin excretion, which regresses as well as progresses. Once initiated, renal function decline seems to progress relentlessly to ESRD. As shown in Figure 3 and 4, the rate of decline of eGFR during CKD stages 1 and 2 (early progressive renal function decline) seems to be similar as during CKD 3 and 4 (late progressive renal function decline), however, we currently do not know whether the disease processes underlying early and late renal function decline are the same or different. Overall, only 30 to 50% of T1D patients with microalbuminuria or proteinuria have a renal function decline significant enough that ESRD will develop during their lifetime. The lifetime risk of ESRD in T1D is estimated to be 10–15% but the cases occur over a long span of diabetes duration (15th to 40th year of diabetes) (30).
Figure 5.
New model of progressive diabetic nephropathy in T1D. Urinary albumin excretion increases in progressively smaller subsets and also regresses, while progressive renal function decline develops early in a subset of microalbuminurics and proteinurics and almost always progresses to ESRD.
Progressive Renal Function Decline: How to diagnose it?
An important message conveyed by Figure 5 is that the majority of patients with microalbuminuria and a large proportion of those with proteinuria will never develop ESRD. They have elevated risk of death unrelated to ESRD, but its excess risk is only one-tenth of the excess risk of death seen among those who develop ESRD. On the other hand, among those with renal function decline the rate of eGFR loss varies widely (Figure 3 & 4). Therefore, medical providers face not only the challenge of distinguishing patients who will remain with stable renal function for their lifetime from patients who will have progressive renal function decline, but also the challenge within the latter group of identifying rapid, moderate and slow decliners and estimating the time to onset of ESRD (examples in Figure 4 panels A, B, D, &E).
There are several legacy biomarkers to diagnose kidney complications in T1D. This includes measurements of levels of hemoglobin A1C (HbA1c, exposure), concentration of urinary albumin excretion (supposedly early disease process) and concentration of serum creatinine (late disease process). Unfortunately, these markers measured cross-sectionally have limited ability to distinguish which patients will remain with stable renal function in the future and which ones have progressive renal function decline and will develop ESRD.
Recently we made an effort to construct a diagnostic test to predict ESRD, which is based on serial measurements over several years of serum creatinine to estimate slopes of eGFR changes when patients still have normal or even elevated renal function. In doing so we found that in T1D patients with proteinuria, the magnitude of eGFR slopes during CKD stage 1 and 2 was a reliable predictor of the subsequent time of onset of ESRD (29). However, before this approach is recommended for clinical use, more work must be done to find the optimal frequency/density of serum creatinine measurements and an optimal time of follow-up during which such determinations are performed.
During the last several years, intensive research has been underway to find new markers to more reliably diagnose patients at risk of renal function decline and progression to ESRD. Serum concentration of cystatin C emerged as a candidate diagnostic marker that might be a more accurate indicator of impaired renal function than serum creatinine. Many studies have been done that proved or disproved this claim. However, the comparisons were always done with direct measurements of GFR in cross-sectional settings (31,32). Only recently we have shown that one determination of serum cystatin C in patients with diabetes and proteinuria provides better risk stratification of subsequent ESRD than determination of serum creatinine obtained at the same time (33).
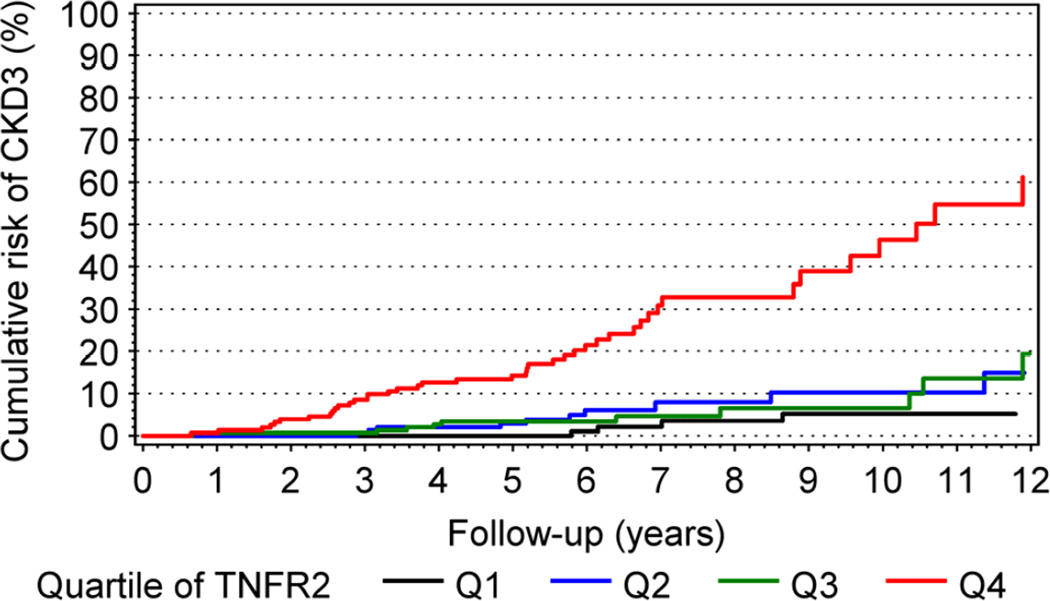
Just recently, serum concentration of TNF receptors 1 or 2 (TNFR1, TNFR2) were shown to be very good predictors of future development of CKD stage 3 in T1D patients and ESRD in T2D patients (34,35). Figure 6 shows cumulative risk of progression to CKD stage 3 in a large cohort of T1D patients with high normoalbuminuria and microalbuminuria according to quartiles of serum concentration of TNFR2. The cumulative risk of CKD stage 3 was very high (55%) after 12 years of follow-up in patients in the highest quartile of baseline TNFR2. In the other 3 lower quartiles, the cumulative risk of CKD stage 3 was low and varied between 5 and 15%. The findings were similar when TNFR1 was used, and did not change when other baseline markers such as HbA1c, ACR and eGFR were included in multivariate analysis. In conclusion, early renal function loss that leads to CKD stage 3 in non-proteinuric T1D patients is strongly associated with circulating levels of TNF receptors. Although mechanisms regulating serum concentrations of TNF receptors and their association with early renal function decline need further study, serum levels of these receptors seem to be the best markers to stratify diabetic patients according to future risk of early renal function decline and progression to ESRD.
Figure 6.
Cumulative risk of CKD≥3 in patients with T1D during 12 years of follow-up according to quartile (Q1–Q4) of circulating TNFR2 at baseline. (Figure reprinted from ref. # 34)
Therapeutic targets and Important Considerations for Therapeutic Trials
A wide spectrum of potential preventive and therapeutic targets can be considered for the development of new therapies/strategies/protocols to reduce the risk of ESRD in T1D. With some simplification, the targets can be divided into three groups: 1) modification of exposures, 2) interference with causal pathways, and 3) cell or gene therapies or transplantation. Some of the specific targets already tried or postulated in each of these groups are listed in Table 1. For many, excellent reviews were recently published (36–39). Others are discussed in articles in this issue of Seminars.
Table 1.
Preventive and therapeutic targets to reduce risk of ESRD or post-ESRD deaths in T1D
| Reduction of exposures: |
| Hyperglycemia |
| Cigarette smoking |
| Hypertension |
| Urinary albumin excretion |
| Serum uric acid |
| Interference in causal pathways |
| Advanced glycation products |
| Reactive oxygen species |
| Glomerular-tubular feedback |
| Hypoxia |
| Renin-angiotensin system |
| TGF-b pathway |
| Inflammation pathways |
| PKC –pathway |
| Glomerular – podocytes |
| KIM – tubular damage mechanisms |
| Pericytes - interstitium |
| Cell or gene therapies or transplantation |
| Injections of modified blood peripheral cells |
| Injections of iPS derived renal cells |
| Pancreas transplantation |
| Pre-emptive kidney transplant |
In designing therapies for T1D it is important to fully appreciate the features of progressive renal function decline and the regulatory environment of the FDA :
First, mechanisms that underlie early renal function decline may be quite different from those involved in late renal function decline leading directly to ESRD, and therefore effectiveness of interventions may vary depending upon the patient population. The best illustration of the latter is the Collaborative Captopril study which showed some effectiveness of ACE inhibitors to postpone onset of ESRD in patients with T1D, proteinuria and elevated serum creatinine (>1.5 mg/dl), but failed to demonstrate any effect of this therapy in similar patients with serum creatinine below 1.5 mg/dl (17).
Second, the wide variation in rates of renal function decline (between −50 and −5 ml/min/year) illustrated in Figure 4 may be determined by multiple different mechanisms, which may be identified with the help of modern genetics, proteomics, and metabolomics platforms. Prediction of the rate of progression will not only help in stratification of patients according to risk of ESRD but will also direct selection of specific therapies to prevent or delay the onset of ESRD. Such personalized approach are being developed in other fields (40–42).
Third, patients with the fastest renal function decline (examples in Figures 4A and 4D), referred to as rapid progressors, may be suitable for more aggressive therapies that have received little consideration so far. The ability to recognize their imminent risk of ESRD and high post-ESRD mortality could justify taking strong measures such as pancreas transplant (43), pre-emptive kidney transplant (44), cellular therapies (45) or aggressive new pharmacological therapies. The latter approached has been practiced successfully in cancer therapies.
Fourth, the effectiveness of new therapies against progressive renal function decline cannot be evaluated in clinical trials that use changes in urinary albumin excretion as an outcome. A much more reliable outcome measure for late disease is a change in the rate of renal function decline or postponement of the time to events such as CKD stage 3, doubling of serum creatinine or ESRD. The efficiency of a study design based on either of the latter outcomes is significantly reduced (and cost significantly increased) by including patients who have microalbuminuria or proteinuria who are non-decliners or have a slow rate of renal function decline. Recruitment of non-decliners or slow decliners like patients in Figure 4C or 4F would be counterproductive despite their having proteinuria and even impaired renal function. This points to the importance of having markers/algorithms to determine, on the basis of one or few baseline measurements, which patients are decliners (rapid, moderate, or slow) and which are non-decliners. At this time, measurement of circulating levels of TNFR1 or TNFR2 seems to be the best markers that achieve such a goal (34,35) (see Figure 6).
Fifth, current FDA regulations favor the use of time to doubling of serum creatinine or onset of ESRD or death as outcome measures. While these metrics are appropriate for testing effectiveness of new therapies at the late stage of progressive renal function decline, insistence on the use of these threshold-based outcomes blocks all progress in the assessment of new therapeutic protocols for early progressive renal function decline. For patients with early progressive renal function decline, the time to these outcomes would be beyond the interval that would be supported by any funding agencies. Therefore, a collaborative effort and support is required, perhaps including NIH and the pharmaceutical industry, to develop a set of reliable outcome-measure tools to assess the rate of renal function decline when patients at risk of ESRD have normal renal function and that the FDA will accept such measures.
Acknowledgments
Preparation of this publication was supported through JDRF research grant 1-2008-1018 (ASK) and NIH grant DK41526 (ASK). JVB is supported by DK39773, DK72381, and DK054741.
Footnotes
Publisher's Disclaimer: This is a PDF file of an unedited manuscript that has been accepted for publication. As a service to our customers we are providing this early version of the manuscript. The manuscript will undergo copyediting, typesetting, and review of the resulting proof before it is published in its final citable form. Please note that during the production process errors may be discovered which could affect the content, and all legal disclaimers that apply to the journal pertain.
References
- 1.Nawroth PP, Isermann B. Mechanisms of diabetic nephropathy – old buddies and newcomers part 1. Exp Clin Endocrinol Diabetes. 2010;118(9):571–576. doi: 10.1055/s-0030-1255051. [DOI] [PubMed] [Google Scholar]
- 2.Nawroth PP, Isermann B. Mechanisms of diabetic nephropathy – old buddies and newcomers part 2. Exp Clin Endocrinol Diabetes. 2010;118(10):667–672. doi: 10.1055/s-0030-1253440. [DOI] [PubMed] [Google Scholar]
- 3.Thomas MC. Pathogenesis and progression of proteinuria. Contrib Nephrol. 2011;170:48–56. doi: 10.1159/000324943. [DOI] [PubMed] [Google Scholar]
- 4.The Diabetes Control and Complications Trial Research Group. The effect of intensive treatment of diabetes on the development and progression of long-term complications in insulin-dependent diabetes mellitus. N Engl J Med. 1993;329:977–986. doi: 10.1056/NEJM199309303291401. [DOI] [PubMed] [Google Scholar]
- 5.de Boer IH, Sun W, Cleary PA, et al. Intensive diabetes therapy and glomerular filtration rate in type 1 diabetes. N Engl J Med. 2011;365:2366–2376. doi: 10.1056/NEJMoa1111732. [DOI] [PMC free article] [PubMed] [Google Scholar]
- 6.American Diabetes Association. Standards of medical care in diabetes – 2009. Diabetes Care. 2009;32(Suppl. 1):S13–S61. doi: 10.2337/dc09-S013. [DOI] [PMC free article] [PubMed] [Google Scholar]
- 7.Saaddine JB, Cadwell B, Gregg EW, Engelgau MM, Vinicor F, Imperatore G, et al. Improvements in diabets processes of care and intermediaye outcomes: United States, 1988–2002. Ann Inter Med. 2006;144:465–474. doi: 10.7326/0003-4819-144-7-200604040-00005. [DOI] [PubMed] [Google Scholar]
- 8.Paris CA, Imperatore G, Klingensmith G, Petitti D, Rodriguez B, Anderrason AM, et al. Predictors of insulin regimens and impact on outcomes in youth with type 1 diabetes: The SEARCH for diabetes in youth study. J Pediatr. 2009;155:183–189. doi: 10.1016/j.jpeds.2009.01.063. [DOI] [PubMed] [Google Scholar]
- 9.Krolewski AS, Laffel LM, Krolewski M, Quinn M, Warram JH. Glycosylated hemoglobin and the risk of microalbuminuria in patients with insulin-dependent diabetes mellitus. N Engl J Med. 1995;332(19):1251–1255. doi: 10.1056/NEJM199505113321902. [DOI] [PubMed] [Google Scholar]
- 10.Mogensen CE. Long-term antihypertensive treatment inhibiting progression of DN. BMJ. 1982;285:685–688. doi: 10.1136/bmj.285.6343.685. [DOI] [PMC free article] [PubMed] [Google Scholar]
- 11.Parving HH, Andersen AR, Smidt UM, Svendsen PA. Early aggressive antihypertensive treatment reduces rate of decline in kidney function in DN. Lancet. 1982;1:1175–1179. doi: 10.1016/s0140-6736(83)92462-5. [DOI] [PubMed] [Google Scholar]
- 12.Trocha AK, Schmidtke C, Didjurgeit U, Muhlhauser I, Bender R, Berger M, et al. Effect of intensified antihypertensive treatment in diabetic nephropathy: mortality and morbidity results of a prospective controlled 10-year study. J Hypertens. 1999;17(10):1497–1503. doi: 10.1097/00004872-199917100-00019. [DOI] [PubMed] [Google Scholar]
- 13.UK Prospective Study Group. Tight blood pressure control and risk of macrovascular and microvascular complications in type 2 diabetes: UKPDS 38. BMJ. 1998;317(7160):703–713. [PMC free article] [PubMed] [Google Scholar]
- 14.Carter BL. Implementing the new guidelines for hypertension: JNC 7, ADA, WHO-ISH. J Manag Care Pharm. 2004;10(5 Suppl. A):S18–S25. doi: 10.18553/jmcp.2004.10.S5-A.S18. [DOI] [PMC free article] [PubMed] [Google Scholar]
- 15.Zatz R, Meyer TW, Rennke HG, Brenner BM. Predominance of hemodynamic rather than metabolic factors in the pathogenesis of diabetic glomerulopathy. Proc Natl Acad Sci U S A. 1985;82:5963–5967. doi: 10.1073/pnas.82.17.5963. [DOI] [PMC free article] [PubMed] [Google Scholar]
- 16.Hollenberg NK, Raij L. Angiotensin-converting enzyme inhibition and renal protection. An assessment of implications for therapy. Arch Intern Med. 1993;153:2426–2435. [PubMed] [Google Scholar]
- 17.Collaborative study. Lewis EJ, Hunsicker LG, Bain RP, Rohde RD. The effect of angiotensin-converting-enzyme inhibition on diabetic nephropathy. The Collaborative Study Group. N Engl J Med. 1993;329:1456–1462. doi: 10.1056/NEJM199311113292004. [DOI] [PubMed] [Google Scholar]
- 18.Mauer M, Zinman B, Gardiner R, Suissa S, Sinaiko A, Strand T, et al. Renal and retinal effects of enalapril and losartan in type 1 diabetes. New Engl J Med. 2009;361(1):40–51. doi: 10.1056/NEJMoa0808400. [DOI] [PMC free article] [PubMed] [Google Scholar]
- 19.Viberti G, Mogensen CE, Groop LC, Pauls JF. Effect of captopril on progression to clinical proteinuria in patients with insulin-dependent diabetes mellitus and microalbuminuria. European Microalbuminuria Captopril Study Group. JAMA. 1994;272(4):275–279. [PubMed] [Google Scholar]
- 20.Laffel LM, McGill JB, Gans DJ. The beneficial effect of angiotensin-converting enzyme inhibition with captopril on diabetic nephropathy in normotensive IDDM patients with microalbuminuria. North American Microalbuminuria Study Group. Am J Med. 1995;99(5):497–504. doi: 10.1016/s0002-9343(99)80226-5. [DOI] [PubMed] [Google Scholar]
- 21.Parving HH, Mauer M, Ritz E. Brenner BM, editor. Diabetic nephropathy. Brenner and Rector’s The Kidney. (7th Edition) 2004:1777–1818. [Google Scholar]
- 22.Perkins BA, Ficociello LH, Roshan B, Warram JH, Krolewski AS. In patients with type 1 diabetes and new onset micro-albuminuria the development of advanced chronic kidney disease may not require progression to proteinuria. Kidney Int. 2010;77:57–64. doi: 10.1038/ki.2009.399. [DOI] [PMC free article] [PubMed] [Google Scholar]
- 23.Macisaac RJ, Jerums G. Diabetic kidney disease with and without albuminuria. Curr Opin Nephrol Hypertension. 2011;20(3):246–257. doi: 10.1097/MNH.0b013e3283456546. [DOI] [PubMed] [Google Scholar]
- 24.Rosolowsky ET, Skupien J, Smiles AM, Niewczas MA, Roshan B, Stanton R, et al. Risk of ESRD in Type 1 Diabetes Remains High in spite of Renoprotection. J Am Soc Nephrol. 2011;22(3):545–553. doi: 10.1681/ASN.2010040354. [DOI] [PMC free article] [PubMed] [Google Scholar]
- 25.Forsblom C, Harjutsalo V, Thorn L, Wadén J, Tolonen N, Saraheimo M, et al. Competing-risk analysis of ESRD and death among patients with type 1 diabetes and macroalbuminuria. J Am Soc Nephrol. 2011;22:537–544. doi: 10.1681/ASN.2010020194. [DOI] [PMC free article] [PubMed] [Google Scholar]
- 26.Perkins BA, Ficociello LH, Silva KH, Finkelstein DM, Warram JH, Krolewski AS. Regression of microalbuminuria in type 1 diabetes. N Engl J Med. 2003;348(23):2285–2293. doi: 10.1056/NEJMoa021835. [DOI] [PubMed] [Google Scholar]
- 27.Perkins BA, Ficociello LH, Ostrander BE, Silva KH, Weinberg J, Warram JH, et al. Microalbuminuria and risk of early progressive renal function decline in type 1 diabetes. J Am Soc Nephrol. 2007;18(4):1353–1361. doi: 10.1681/ASN.2006080872. [DOI] [PubMed] [Google Scholar]
- 28.Merchant ML, Perkins BA, Boratyn GM, Ficociello LH, Wilkey DW, Barati MT, et al. Urinary peptidome may predict renal function decline in type 1 diabetes and microalbuminuria. J Am Soc Nephrol. 2009;20(9):2065–2074. doi: 10.1681/ASN.2008121233. [DOI] [PMC free article] [PubMed] [Google Scholar]
- 29.Skupien J, Warram JH, Smiles AM, Niewczas MA, Gohda G, Pezzolesi MG, et al. Early Renal Function Decline Predicts Risk of ESRD: 5–18 year Follow-up of Patients with Type 1 Diabetes and Proteinuria. Kidney Int. 2012 doi: 10.1038/ki.2012.189. (in press) [DOI] [PMC free article] [PubMed] [Google Scholar]
- 30.Krolewski M, Eggers PW, Warram JH. Magnitude of end-stage renal disease in IDDM: a 35 year follow-up study. Kidney Int. 1996;50(6):2041–2046. doi: 10.1038/ki.1996.527. [DOI] [PubMed] [Google Scholar]
- 31.Zahran A, El Husseini A, Shoker A. Can cystatin C replace creatinine to estimate glomerular filtration rate? A literature review. Am J Nephrol. 2007;27:197–205. doi: 10.1159/000100907. [DOI] [PubMed] [Google Scholar]
- 32.Eriksen BO, Mathisen UD, Melsom T, Ingebretsen OC, Jenssen TG, Njølstad I, et al. Cystatin C is not a better estimator of GFR than plasma creatinine in the general population. Kidney Int. 2010;78:1305–1311. doi: 10.1038/ki.2010.321. [DOI] [PubMed] [Google Scholar]
- 33.Krolewski AS, Warram JH, Forsblom C, Smiles A, Thorn L, Skupien J, et al. Serum concentration of cystatin C and risk of ESRD in diabetes. Diabetes Care. 2012 doi: 10.2337/dc11-2220. (in press) [DOI] [PMC free article] [PubMed] [Google Scholar]
- 34.Gohda T, Niewczas MA, Ficociello LH, Walker WH, Skupien J, Rosetti F, et al. Circulating TNF Receptors 1 and 2 predict stage 3 of CKD in Type 1 Diabetes. J Am Soc Nephrol. 2012;23(3):516–524. doi: 10.1681/ASN.2011060628. [DOI] [PMC free article] [PubMed] [Google Scholar]
- 35.Niewczas MA, Gohda T, Skupien J, Smiles AM, Walker WH, Rosetti F, et al. Circulating TNF Receptors 1 and 2 Predict ESRD in Type 2 Diabetes. J Am Soc Nephrol. 2012;23(3):507–515. doi: 10.1681/ASN.2011060627. [DOI] [PMC free article] [PubMed] [Google Scholar]
- 36.Thomas MC, Groop PH. New approaches to the treatment of nephropathy in diabetes. Expert Opin Investig Drugs. 2011;20(8):1057–1071. doi: 10.1517/13543784.2011.591785. [DOI] [PubMed] [Google Scholar]
- 37.Stanton RC. Oxidative stress and diabetic kidney disease. Curr Diab Rep. 2011;11(4):330–336. doi: 10.1007/s11892-011-0196-9. [DOI] [PubMed] [Google Scholar]
- 38.Ruggenenti P, Cravedi P, Remuzzi G. The RAAS in the pathogenesiis and treatment of diabetic nephropathy. Nat Rev Nephrol. 2010;6(6):319–330. doi: 10.1038/nrneph.2010.58. [DOI] [PubMed] [Google Scholar]
- 39.Mathew A, Cunard R, Sharma K. Antifibrotic treatment and other new strategies for improving renal outcomes. Contrib Nephrol. 2011;170(6):217–227. doi: 10.1159/000325671. [DOI] [PMC free article] [PubMed] [Google Scholar]
- 40.Chokrungvaranon N, Deer J, Reaven PD. Intensive glycemic control and cardiovascular disease; are there patients who may benefit? Postgrad Med. 2011;123(6):114–123. doi: 10.3810/pgm.2011.11.2501. [DOI] [PubMed] [Google Scholar]
- 41.Degome EM, Rivera G, Lilly SM, Usman MH, Mohler ER. Personalized vascular medicine; individualizing drug therapy. Vasc Med. 2011;16(5):391–404. doi: 10.1177/1358863X11422251. [DOI] [PMC free article] [PubMed] [Google Scholar]
- 42.Higgins MJ, Baselga J. Targeted therapies for brest cancer. I Clin Invest. 2011;121(10):3797–3803. doi: 10.1172/JCI57152. [DOI] [PMC free article] [PubMed] [Google Scholar]
- 43.Cantarovich D, Perrone V. Pancreas transplant as treatment to arrest renal function decline in patients with type 1 diabetes and proteinuria. Semin Nephrol. 2012 doi: 10.1016/j.semnephrol.2012.07.005. (in press) [DOI] [PubMed] [Google Scholar]
- 44.Pavlakis M, Kher A. Pre-emptive kidney transplantation to improve survival in patients with Type 1 diabetes and imminent risk of ESRD. Semin Nephrol. 2012 doi: 10.1016/j.semnephrol.2012.07.014. (in press) [DOI] [PubMed] [Google Scholar]
- 45.Gilbert RE, Zhang Y, Yuen DA. Cell therapy for diabetic nephropathy: Is the future, now? Semin Nephrol. 2012 doi: 10.1016/j.semnephrol.2012.07.012. (in press) [DOI] [PubMed] [Google Scholar]


