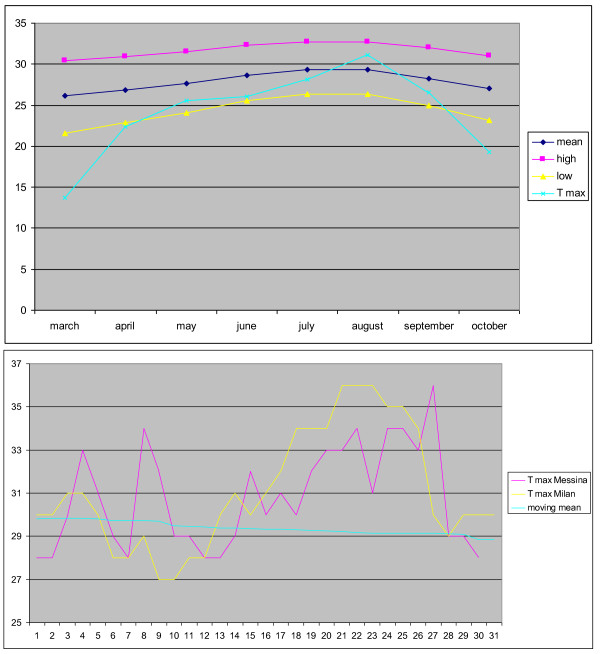
Figure 4.
Clime temperature and comparison among environmental temperature in the north and in the south of Italy. The upper graph shows that the hottest period of the year was during the month of August, in the lower part the graph shows that the trendo of temeprature in Milan and in Messina were very similar.

