

Abstract
Supported lipid bilayers (SLBs) have been widely used as model systems to study cell membrane processes because they preserve the same 2D membrane fluidity found in living cells. One of the most significant limitations of this platform, however, is its inability to incorporate mobile transmembrane species. It is often postulated that transmembrane proteins reconstituted in SLBs lose their mobility because of direct interactions between the protein and the underlying substrate. Herein, we demonstrate a highly mobile fraction for a transmembrane protein, annexin V. Our strategy involves supporting the lipid bilayer on a double cushion, where we not only create a large space to accommodate the transmembrane portion of the macromolecule but also passivate the underlying substrate to reduce nonspecific protein–substrate interactions. The thickness of the confined water layer can be tuned by fusing vesicles containing polyethyleneglycol (PEG)-conjugated lipids of various molecular weights to a glass substrate that has first been passivated with a sacrificial layer of bovine serum albumin (BSA). The 2D fluidity of these systems was characterized by fluorescence recovery after photobleaching (FRAP) measurements. Uniform, mobile phospholipid bilayers with lipid diffusion coefficients of around 3 × 10⁻⁸ cm2/s and percent mobile fractions of over 95% were obtained. Moreover, we obtained annexin V diffusion coefficients that were also around 3 × 10⁻⁸ cm2/s with mobile fractions of up to 75%. This represents a significant improvement over bilayer platforms fabricated directly on glass or using single cushion strategies.
Introduction
Supported lipid bilayers (SLBs), pioneered by McConnell et al.,1–3 have successfully reproduced many aspects of cell membrane behavior. They possess the same 2D fluidity and have been employed to investigate lipid assembly,4,5 membrane structure,6,7 dynamics,8 and multivalent ligand–receptor binding.9,10 They have even been used in the development of biosensors platforms11 and separation devices.12 Despite this, the incorporation of transmembrane proteins into SLBs has not yet been satisfactorily achieved. The problem lies in the limited space between the bottom leaflet of the bilayer and the underlying solid support. This distance, which is typically only on the order of 1 nm, is not usually sufficient to accommodate species that protrude extensively beyond the lower leaflet of the bilayer. Several research groups have explored methods to increase this spacing. Most strategies involve the placement of a polymer cushion between the membrane and support.13–31 To date, however, these experiments generally report that proteins that protrude extensively beyond the lower leaflet have a 25% mobile fraction or less. In other words, more than three-quarters of the protein molecules are immobilized by the underlying support and perhaps partially denatured.
SLBs have a complex series of interactions with underlying planar glass supports. These include van der Waals, electrostatic, hydrophobic, and steric interactions.32–34 Such forces act together to leave a thin layer of hydration water trapped between the bilayer and the substrate.2,35–39 This water layer helps to maintain the lateral mobility of lipids in both leaflets of the bilayer. It would be important to extend this same principle to membrane proteins. To this end, soft hydrophilic polymeric materials have been a popular choice for cushion materials because they readily imbibe large amounts of water.28,40–42 Ideally, the polymer film should act like the cytoskeleton found in mammalian cell membranes. Such an approach, in principle, should significantly reduce frictional coupling and avoid protein denaturation. Methods for the preparation of polymer supports include the chemical grafting of polymers, such as cellulose or dextran directly onto the solid surface, followed by the subsequent deposition of lipid bilayers.13,14 A slightly different approach involves the reconstitution of lipopolymers that also provide a spacer between the underlying substrate and the phospholipid bilayer.21–31,43 The difference in this case is that alkyl side chains emanating from the lipopolymer directly intercalate into a nascently transferred lipid film.
Despite extensive work on cushion designs, only a few studies describe the use of these systems for studying the lateral mobility of transmembrane proteins.15,27,44,45 Tamm and co-workers designed a PEG-conjugated phospholipid membrane that could be covalently bonded to silicate substrates.27 The lateral diffusion of cytochrome b5 and annexin V were measured by FRAP in this system. Although lateral diffusion coefficients were obtained, only 25% of the cytochrome b5 molecules had a diffusion coefficient value that was of the same order of magnitude as the lipids. The rest of the cytochrome b5 molecules diffused several orders of magnitude more slowly or not at all, presumably as a result of interactions between the proteins and the underlying polymer network. Similar results were obtained for annexin V. The PEG tethered system was also used for the reconstitution of mobile SNARE proteins.44 Another protein mobility study was performed by Tanaka, Sackmann, and co-workers.15 In this case, human platelet integrin αIIbβ3 was investigated in a supported bilayer system that rested on a cellulose cushion. Again, only about one-quarter of the proteins were mobile in the presence of the cushion, and none were mobile without it. In a fourth example, Smith, Wirth, and co-workers45 studied the mobility of the human delta-opioid receptor on acrylamide cushions of various thicknesses. In this case, however, only data for an individually mobile protein molecule were reported rather than the mobile fraction for a population of membrane-embedded proteins. Finally, Brozik and co-workers used nanoporous microbeads rather than a polymer cushion strategy to support lipid membranes with bacteriorhodopsin.46 High protein mobile factions were obtained (~78%) with D = 3.8 × 10⁻¹⁰ cm2/s for proteins in the pores of the bead. It would be important to determine if the same type of mobility can be extended to systems with planar geometry.
In the work described herein, we investigate the 2D fluidity of a transmembrane protein, annexin V, reconstituted into a double-cushion planar supported membrane system. Annexin V, which has dimensions of of 64 × 40 × 30 Å3 and is folded into four domains,47 is a multihelical intracellular protein that binds to negatively charged phospholipids in a Ca2+-dependent manner.48 The function of this protein has been ascribed to different membrane-associated events including vesicular trafficking, membrane fusion, and ion channel formation.49 It has been reported that annexin V forms ion channels in phospholipid bilayers at mildly acidic pH values.50–52
Figure 1 illustrates our strategy for achieving high mobile fractions of annexin V. A first cushion layer is formed by uniformly adsorbing BSA onto a planar glass support. This protein monolayer passivates the substrate and thereby helps prevent strong interactions with the underlying oxide surface. The second layer of the cushion is formed when lipid vesicles containing (poly)ethyleneglycol-conjugated lipids are fused on top of the first layer. The spacing between the BSA film and the lower leaflet of the bilayer can be modulated by changing the number density and molecular weight of the PEG lipopolymer incorporated into the lipid bilayer. The best results were achieved when a 0.1 mg/mL BSA solution was incubated over the surface for 20 min and the lipid bilayer consisted of 0.5 mol% PEG5000. In that case, the mobile fraction of annexin V was ~75% with a diffusion coefficient of 3 × 10⁻⁸ cm2/s.
Figure 1.

Schematic diagrams of the supported bilayer systems used in this work. (A) A bilayer supported directly on a bare glass substrate. Membrane proteins, which protrude beyond the lower leaflet of the bilayer, become immobilized by direct interactions with the underlying glass surface. (B) The double-cushion system creates more space between the bilayer and support and also mitigates interactions with the substrate.
Materials and Methods
Materials
1-Palmitoyl-2-oleoyl-sn-glycero-3-phosphocholine (POPC), bovine brain L-α-phosphatidylserine (brain PS), and 1,2-dioleoyl-sn-glycero-3-phosphoethanolamine-N-[methoxy(poly(ethylene glycol))] (PEG-PE) were purchased from Avanti Polar Lipids (Alabaster, AL) with PEG molecular weights of 550, 2000, and 5000. N-(Texas Red sulfonyl)-1,2-dihexadecanoyl-sn-glycero-3-phosphoethanolamine (Texas Red DHPE) was obtained from Molecular Probes (Eugene, OR). Bovine serum albumin (BSA) was purchased from Sigma-Aldrich (St. Louis, MO). Phycoerythrin-labeled recombinant human annexin V with a molecular weight of 35 800 Da was obtained from Alexis Biochemicals (San Diego, CA).
Purified water from a NANOpure Ultrapure Water System (Barnstead, Dubuque, IA) was used to prepare all buffer solutions. The water had a minimum resistivity of 18 MΩ cm. Phosphate-buffered saline (PBS) was prepared using 10 mM sodium phosphate with the addition of 150 mM NaCl (Sigma-Aldrich). The pH was adjusted to 7.4 by the dropwise addition of NaOH (EMD, Germany). Tris(hydroxymethyl)aminomethane was used to prepare 10 mM, pH 7.4 Tris (Fluka-BioChemika) buffer with 100 mM sodium chloride (Sigma-Aldrich). CaCl2 (Acros Organic, 8 mM) was added to the Tris buffer where noted. Polydimethylsiloxane (PDMS) was used to fabricate microwell structures. The polymer and cross-linker were purchased from Dow Corning (Sylgard Silicone Elastomer-184, Krayden Inc.).
Small Unilamellar Vesicles
Small unilamellar vesicles (SUVs) were prepared as previously reported.4,53,54 Briefly, the desired amounts of POPC, PEG-PE lipopolymer, and PS were mixed in appropriate proportions from stock solutions in chloroform and allowed to dry in a stream of nitrogen followed by desiccation under vacuum for 4 h. In some cases, 0.1 mol % Texas Red DHPE was used as a fluorescent probe. After the evaporation of the solvent, the lipids were reconstituted in 10 mM Tris buffer and subjected to 10 freeze–thaw cycles by alternating between immersion in liquid nitrogen and a 30 °C water bath. The solution was then extruded five times through a polycarbonate filter (50 nm pore size) to produce vesicles of uniform size. Small unilamellar vesicles prepared by this method were 80 ± 10 nm in diameter as determined by dynamic light scattering using a 90Plus particle size analyzer from Brookhaven Instrument Corp.
Supported Lipid Membranes
Supported lipid bilayers were prepared by the adsorption and fusion of SUVs onto clean planar borosilicate coverslips (VWR International).1,55–57 Polymer-conjugated bilayers were prepared by the same vesicle fusion method, but using the desired amount of PEG-PE as previously reported.53,58 Coverslips were cleaned in hot surfactant solution (ICN 7X detergent, MP Biomedicals, Solon, OH),59 rinsed with copious amounts of DI water, and annealed in a kiln at 550 °C for 5 h to yield flat surfaces with root-mean-square roughness (rms) values on the order of ~0.13 nm over a 1 μm2 area as determined by atomic force microscopy. Vesicle fusion was performed via the introduction of a 100 μL SUV solution onto the clean glass substrate. The solution was confined to a circular area (~8 mm in diameter) in the center of the surface by a thin hydrophobic PDMS microwell.53 After a 10 min incubation period, the nascently formed bilayer was extensively rinsed with buffer to remove excess vesicles.
Lipid bilayers supported on protein films were prepared by fusing vesicles in a manner similar to the one described above. In this case, however, a 100 μL BSA solution in Tris buffer was introduced into the microwell first and incubated for a period of 20 min, followed by thorough rinsing with buffer. Solutions of BSA were prepared at concentrations ranging from 0.001 to 0.5 mg/mL. Prior to use, the protein solutions were centrifuged at 13 500 rpm for 20 min (5415, Eppendorf) to remove any aggregates from the bulk solution.
Reconstitution of Annexin V
Each supported bilayer was incubated for 20 min with Tris buffer containing 8 mM CaCl2 before the introduction of protein solution. It should be noted that the divalent metal ion is required for annexin V incorporation into the membrane.27,48 At this point, a solution of phycoerythrin-labeled annexin V (0.1 mg/mL) in Tris buffer was introduced into the bulk solution above the surface and incubated for 30 min. The bilayers were extensively washed with a buffer solution containing EDTA (10 mM Tris, pH 6.0, 100 mM NaCl, and 5 mM EDTA) to remove any excess protein bound to the upper leaflet. It has been previously shown that any annexin V molecules that are not fully inserted into the bilayer can be easily removed from the interface by exposing the system to 5 mM EDTA.60,61 We therefore exposed our system to these conditions to remove all partially bound annexin V molecules before performing FRAP experiments. In a final step, fresh Tris without CaCl2 was flowed over the bilayer at pH 6.0, and FRAP experiments were performed. Under these conditions, the annexin V should be fully inserted into the membrane.50–52 By contrast, working at somewhat higher pH does not lead to protein insertion.62
Double-cushion systems were also tested by the direct fusion of proteoliposomes containing annexin V to BSA-coated supports. In this case, the vesicles were made from 20 mol % PS, 0.5 mol % PEG 5000, and 79.5 mol % POPC. To form the proteoliposomes, annexin V was mixed with the polymer-conjugated vesicles in a ratio of ~1 protein molecule/400 lipids. After a 2 h incubation time, excess proteins were removed from the vesicle solutions by size exclusion chromatography with a BioGel P-30 column (Bio-Rad Laboratories, CA). The column was passiviated with a vesicle solution, which was also made from 20 mol % PS, 0.5 mol % PEG 5000, and 79.5 mol % POPC prior to purification to minimize the adsorption of proteoliposomes within the column.
Fluorescence Recovery after Photobleaching
FRAP63,64 experiments were carried out with a 2.5 W mixed gas argon/krypton ion laser (Stabilite 2018, Spectra Physics). Samples were irradiated at 568.2 nm with 100 mW of power for 1 s. A 13 μm fwhm bleach spot was made by focusing the light onto the bilayer through a 10× objective. The fluorescence recovery was measured using MetaMorph Software (Universal Imaging). The fluorescence intensity of a bleached spot was determined as a function of time after background subtraction and intensity normalization. All fluorescence recovery curves were fit to a single exponential equation to estimate the mobile fraction of labeled lipids and proteins as well as the half-time of recovery, t1/2. The equation employed to calculate the lateral diffusion coefficient of dye-labeled lipids and proteins is:63
| (1) |
where w is the fwhm of the Gaussian profile of the focused beam and γD is a correction factor that depends on the bleach time and the geometry of the laser beam.63 The value of γD was 1.1.
Results
Protein-Supported Lipid Membranes
In the first set of experiments, BSA was coated onto clean glass coverslips from a Tris buffer solution at a concentration of 0.1 mg/mL. After rinsing, POPC vesicles were introduced above the protein film in Tris buffer at a concentration of 1 mg/mL. The vesicles contained 0.1 mol % Texas Red DHPE for visualization under an epifluorescence microscope. The inset images in Figure 2 show fluorescence micrographs of this bilayer immediately after photobleaching and again 300 s later. The FRAP curve denotes the fluorescence intensity in the bleached spot as a function of time. As can be seen, relatively complete recovery was observed with a diffusion coefficient of 4.0 (±0.3) × 10−8 cm2/s. Moreover, the sample recovered roughly 97% of its initial fluorescence at t = ∞.
Figure 2.
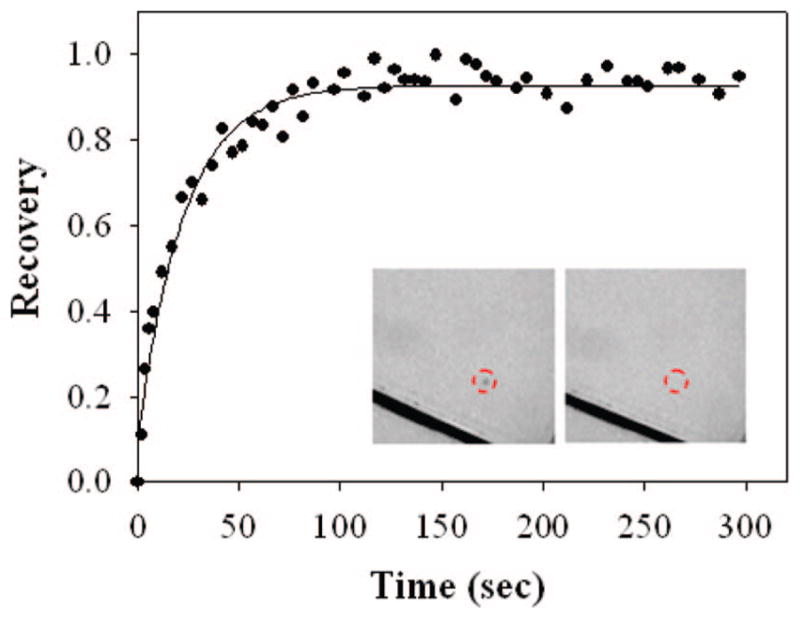
FRARP curve from a BSA-supported POPC bilayer with 0.1 mol % Texas Red DHPE. The BSA was introduced at 0.1 mg/mL. The black lines in the inset fluorescence images are scratches that were intentionally made with a pair of metal tweezers for the estimation of the background contribution to the measured fluorescence intensity. The dashed red circles highlight the position of the beach spot. The inset images, which are 230 μm × 230 μm, were captured immediately after photobleaching and again 300 s later.
These experiments were repeated for a total of seven different BSA concentrations ranging from 0.01 to 0.5 mg/mL. The diffusion coefficients for Texas Red DHPE in POPC membranes are plotted in Figure 3. As can be seen, these values remained unchanged between 0.01 and 0.1 mg/mL BSA. Recovery was nearly complete in each case (0.97 ± 0.01). At 0.2 mg/mL, the diffusion slowed dramatically and the mobile fraction of Texas Red DHPE was 0.60. Long-range diffusion was completely arrested when the BSA concentration was 0.3 mg/mL or higher.
Figure 3.
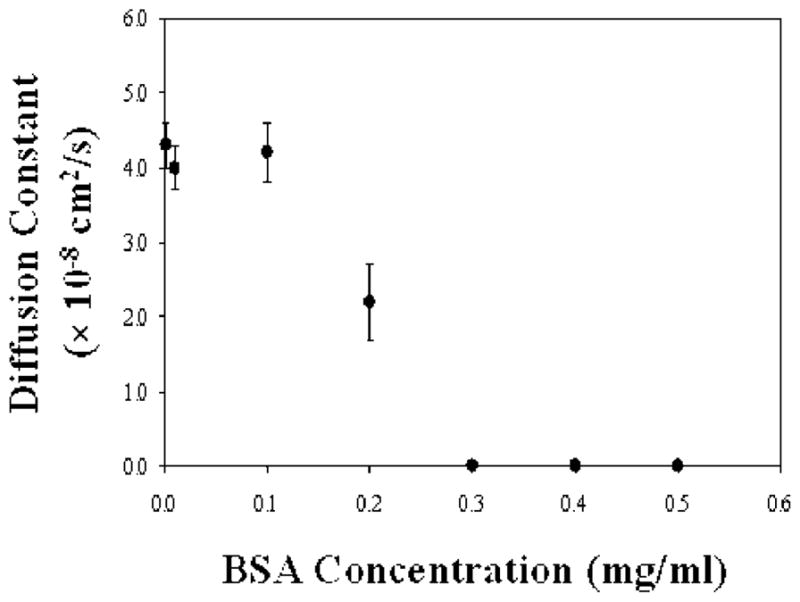
Diffusion of Texas Red-labeled lipids in POPC bilayers as a function of the BSA incubation concentration.
Analogous experiments were performed with membranes containing 79.9 mol % POPC, 20 mol % brain-PS, and 0.1 mol % Texas Red DHPE. In that case, however, the results were quite different. Indeed, no fluorescence recovery was observed when vesicles were introduced above BSA films formed from 0.1 mg/mL solutions. It has been reported in the literature that the addition of Ca2+ to the buffer can sometimes aid bilayer formation when PS lipids are present.65 We therefore repeated these experiments in the presence of 8 mM Ca2+ under otherwise identical conditions. Again, the Texas Red DHPE probes were found to be completely immobile. A final control was performed in the presence of PS lipids without the BSA cushion. In this case, the supported bilayer formed by vesicle fusion was mobile with D = 3.5 (±0.1) × 10−8 cm2/s and a 0.90 mobile fraction.
Polymer-Supported Lipid Membranes without BSA
Polymer-supported lipid bilayers were prepared as previously reported.53 The lipopolymer was added to POPC vesicles containing 20 mol % brain-PS and 0.1 mol % Texas Red DHPE. PEG-PE lipids with three different molecular weights and concentrations were employed: 7 mol % for PEG550-PE, 1.4 mol % for PEG2000-PE, and 0.5 mol % for PEG5000-PE, respectively. These particular values were chosen to correspond to the onset of the mushroom-to-brush transition as calculated by Marsh and co-workers.66 All experiments were performed on clean glass coverslips without the introduction of BSA. Fluorescence imaging experiments confirmed that the supported membranes were homogeneous down to the diffraction limit. FRAP measurements were also made, and the values of the diffusion coefficient and mobile fraction are provided in Table 1. As can been seen, these values are consistent with high-quality supported bilayers in each case. It should be noted that the PEG moiety is not chemically grafted to the surface and that the lipopolymer remains mobile on the surface under these conditions.53 Finally, it should be pointed out that the experiments associated with Table 1 were performed in the absence of Ca2+. Control experiments were also done in the presence of 8 mM CaCl2, and these gave identical results to those shown in the Table within experimental error.
Table 1.
Lateral Mobility of Texas Red-Labeled Lipids in Glass-Supported Lipid Bilayers Containing PEG-PE
| type of support | diffusion coefficient (× 10−8cm2/s) | mobile fraction (%) |
|---|---|---|
| 7 mol % PEG 550 | 3.5 ± 0.1 | 95.8 ± 3.6 |
| 1.4 mol % PEG 2000 | 3.6 ± 0.2 | 93.3 ± 3.4 |
| 0.5 mol % PEG 5000 | 3.8 ± 0.4 | 93.5 ± 3.1 |
Double-Cushion System
Novel double-cushion systems were investigated whereby PEGylated membranes were fused to substrates coated with BSA. To construct these systems, 0.1 mg/mL BSA was introduced above planar glass substrates and allowed to incubate for 20 min. This concentration was chosen because it represents the highest protein concentration at which full mobility of the lipids was still observed in Figure 3. After extensively rinsing away the protein solution with buffer, POPC vesicles with 20 mol % brain-PS, 0.1 mol % Texas Red DHPE, and 7 mol % PEG550-PE were fused to a protein-coated coverslip. The lateral diffusion coefficient of Texas Red DHPE was 3.2 ± (0.3) × 10−8 cm2/s with a mobile fraction of 94%. This result is quite significant because it indicates that the presence of the PEG cushion mitigates the interactions between the BSA and the negatively charged brain-PS to a sufficient extent to allow long-range bilayer fluidity. Control experiments revealed that the addition of 8 mM CaCl2 to the buffer did not influence either the diffusion coefficient or the mobile fraction.
These experiments were repeated with PEG2000 and PEG5000 at their respective mushroom-to-brush concentrations, and the results are provided in Table 2. As can be seen, both the diffusion coefficient and mobile fraction remained quite high for all PEG chain lengths employed.
Table 2.
Lateral Mobility of Texas Red-Labeled Lipids in Bilayers Supported on the Double-Cushion System
| double-cushion system | diffusion coefficient (× 10−8 cm2/s) | mobile fraction (%) |
|---|---|---|
| 7 mol % PEG 550-BSA | 3.2 ± 0.3 | 94.0 ± 4.6 |
| 1.4 mol % PEG 2000-BSA | 3.2 ± 0.4 | 95.3 ± 3.1 |
| 0.5 mol % PEG 5000-BSA | 3.0 ± 0.4 | 93.0 ± 1.7 |
Reconstitution and Lateral Diffusion of Annexin V
In the next set of experiments, the lateral diffusion of annexin V was investigated in lipid bilayers containing 20 mol % PS, 79.9 mol % POPC, and 0.1 mol % Texas Red DHPE on bare glass substrates. After a bilayer was formed, 0.1 mg/mL phycoerythrin-labeled annexin V was introduced above the interface in Tris buffer with 8 mM CaCl2 and incubated for 30 min. Unbound protein molecules were rinsed away with EDTA, and fresh buffer was added back to the system. Finally, diffusion coefficient and mobile fraction measurements of the biomacromolecules were made by FRAP (Table 3). As can be seen, three-quarters of the protein molecules were immobile, and the diffusion coefficient of the protein was significantly slower than that for Texas Red DHPE.
Table 3.
Effect of PEG2000-PE Concentration on the Two-Dimensional Lateral Mobility of Fluorescently Labeled Annexin V
| PEG2000-PE concentration | diffusion coefficient (× 10−8cm2/s) | mobile fraction (%) |
|---|---|---|
| 0 mol % | 0.3 ± 0.1 | 26.3 ± 3.2 |
| 0.5 mol % | 1.3 ± 0.2 | 28.9 ± 4.8 |
| 1.4 mol % | 2.0 ± 0.2 | 35.8 ± 3.2 |
| 5 mol % | 1.0 ± 0.3 | 19.9 ± 2.9 |
Identical measurements were repeated in membranes containing PEG2000 lipopolymer. The effect of polymer density on the lateral diffusion of phycoerythrin-labeled annexin V was quantified by varying the mol % of PEG2000-PE moieties within the membrane. The mole percentages of PEG2000-PE used in these experiments were 0.5, 1.4, and 5%. At low PEG density (0.5 mol % PEG2000-PE), the PEG moiety exists in a mushroom conformation. At higher polymer density (5 mol % PEG2000-PE), the PEG moiety should be well into the brush transition. The values for the diffusion coefficient and mobile fraction of annexin V as a function of lipopolymer density are provided in Table 3. As can be seen, the highest diffusion coefficient and mobile fraction values were found at the onset of the mushroom-to-brush transition. The decrease in mobility above and below this value can be explained as follows. An isolated mushroom conformation for PEG2000 should not be able to prevent direct interactions between annexin V and the substrate at many locations on the surface. However, concentrations of PEG well into the brush transition are known to lead to lipopolymer immobilization,53 which almost certainly affects the mobility of the membrane protein. An intermediate lipopolymer concentration avoids both of these problems.
To investigate the influence of the polymer chain length on the lateral diffusion of phycoerythrin-labeled annexin V, lipopolymers were incorporated into POPC bilayers at different molecular weights (PEG550, PEG2000, and PEG5000) at the onset of the mushroom-to-brush transition. Increasing the length of the polymer chain increases the membrane–substrate distance.67 This should decrease the interactions between the inserted membrane protein and the underlying substrate. Indeed, higher diffusion coefficients were obtained for annexin V reconstituted into membranes with longer polymer chains (Table 4). Nevertheless, a majority of the protein molecules were immobile in all cases.
Table 4.
Effect of Polymer Length (PEG550, PEG2000, and PEG5000) on the Two-Dimensional Lateral Mobility of Fluorescently Labeled Annexin V
| type of support | diffusion coefficient (× 10−8cm2/s) | mobile fraction (%) |
|---|---|---|
| glass | 0.3 ± 0.1 | 26.3 ± 3.2 |
| 7 mol % PEG 550 | 0.4 ± 0.1 | 27.7 ± 3.4 |
| 1.4 mol % PEG 2000 | 2.0 ± 0.2 | 35.8 ± 3.2 |
| 0.5 mol % PEG 5000 | 3.5 ± 0.4 | 24.6 ± 1.7 |
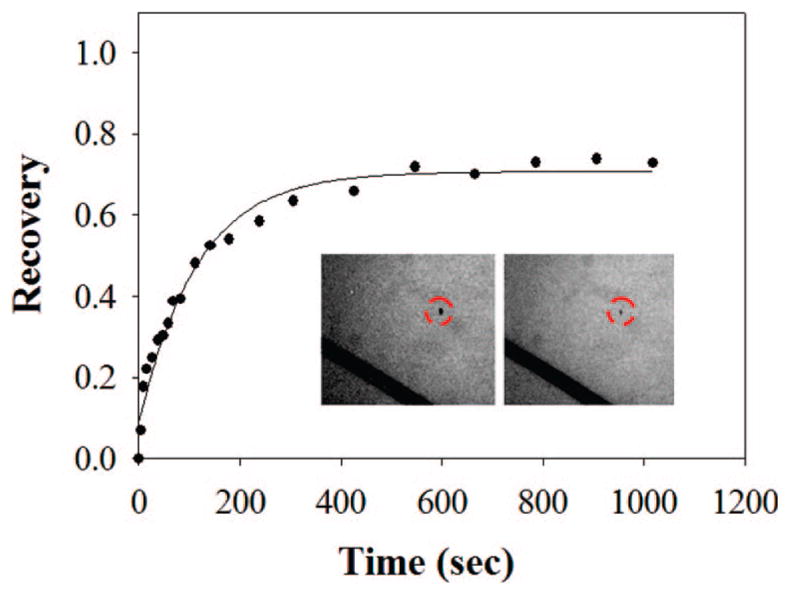
Next, the 2D fluidity of annexin V was measured in double-cushioned systems. BSA was incubated above the surface at a concentration of 0.1 mg/mL before rinsing and the introduction of the supported bilayer. Figure 4 shows fluorescence micrographs and the corresponding FRAP recovery curve for phycoerythrin-labeled annexin V reconstituted into the PEG-PE5000/BSA system. The fluorescence recovery of the photobleached spot was remarkably high (~74%), and the diffusion coefficient value of the protein, 2.9 ± (0.4) × 10−8 cm2/s, was nearly as high as that for the Texas Red-conjugated lipid probes. The mobile fraction was strongly dependent on the length of the polymer chain. Moreover, the diffusion coefficient also decreased with decreasing chain length. Both the diffusion coefficient and mobile fraction values obtained for annexin V are provided in Table 5.
Figure 4.
Employment of a double-cushion system for maintaining the 2D lateral mobility of annexin V. Phycoerythrin-labeled annexin V was added to the bilayer and incubated for 30 min. Excess protein was rinsed away with EDTA before FRAP measurements were made. The black lines in the inset images are scratches that were intentionally made with a pair of metal tweezers for estimating the background contribution to the measured fluorescence intensity. The bright white stripes adjacent to these lines represent immobilized protein molecules. The dashed red circles show the position of the bleach spot. These inset images, which are 300 μm × 300 μm, were captured immediately after photobleaching and again 1200 s later. The main curve corresponds to the fluorescence recovery of the spot with time.
Table 5.
Lateral Mobility of Fluorescently Labeled Annexin V in Double-Cushion Systems
| double-cushion system | diffusion coefficient (× 10−8cm2/s) | mobile fraction (%) |
|---|---|---|
| 7 mol % PEG 550 - BSA | 0.5 ± 0.1 | 33.1 ± 6.2 |
| 1.4 mol % PEG 2000 -SA | 2.0 ± 0.4 | 52.2 ± 4.7 |
| 0.5 mol % PEG 5000 -BSA | 2.9 ± 0.4 | 73.5 ± 2.4 |
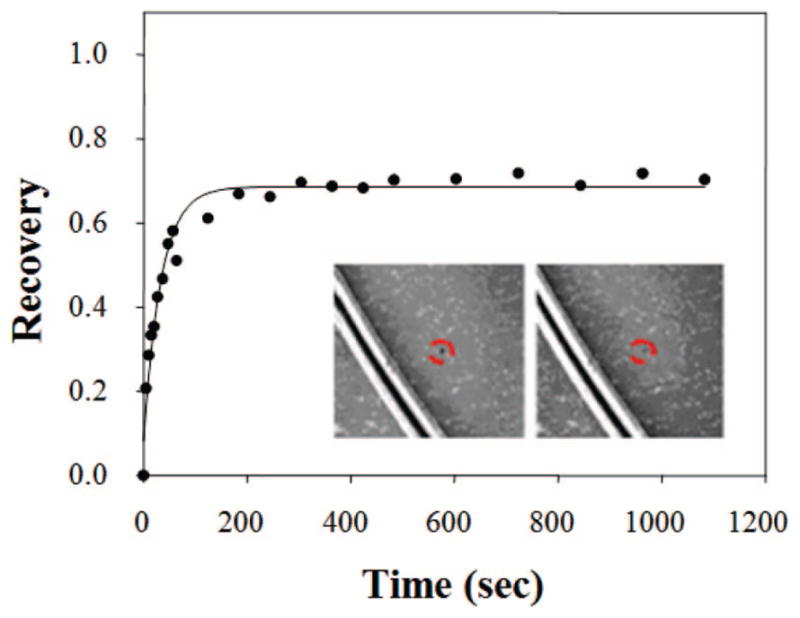
In a final set of experiments, we wished to test the generality of our platform for use with proteoliposomes. Therefore, vesicles containing annexin V were fused to BSA-coated substrates instead of introducing annexin V into the double-cushion system after its formation. The experiment was directly analogous to the one shown in Figure 4. In other words, the annexin V-containing vesicles were made with 20 mol % PS, 0.5 mol % PEG 5000, and 79.5 mol % POPC. These proteoliposomes were fused to a BSA cushion in Tris buffer in the presence of 8 mM CaCl2. Next, unbound protein molecules were rinsed away with EDTA, and fresh buffer was added back to the system. This led to the formation of a uniform bilayer as judged by fluorescence microscopy. Figure 5 shows the recovery curve for phycoerythrin-labeled annexin V reconstituted into the 0.5 mol % PEG-PE5000/BSA system. Remarkably, the mobile fraction of proteins was ~70% with a diffusion coefficient of 1.4 (±0.4) × 10−8 cm2/s. This result is perhaps somewhat surprising because the orientation of the protein with respect to the underlying substrate after vesicle fusion is not completely controlled. Therefore, it is possible that annexin V is mobile within the double-cushion system for both possible vectorial orientations. Of course, it is also possible that one orientation dominates upon vesicle fusion. Future studies will be needed to distinguish between these two possibilities. Nevertheless, the double-cushion strategy may have potential utility for use with proteins that need to be transferred to the BSA-coated substrate surface via vesicle fusion.
Figure 5.
FRAP data after the fusion of proteoliposomes containing phycoerythrin-labeled annexin V to a BSA cushion. The dark scratch lines in the inset images were intentionally made with a pair of metal tweezers for estimating the background contribution to the measured fluorescence intensity. The dashed red circles show the position of the bleach spot. The inset images were taken right after photobleaching and after 1200 s, respectively.
Discussion
It has been reported that the spacer length and density play an important role in the structure and function of supported membranes.30,67,68 Wagner et al. reported the formation of uniform, mobile bilayers on PEG-coated substrates made with silane-functionalized PEG2000 tethers,27 whereby the polymer concentration was maintained slightly below the mushroom-to-brush transition. It was observed that a decrease in the mobile fraction of fluorescently labeled lipids was directly related to increasing the polymer density within the supported membrane. In 2004, Purrucker and Tanaka reported that spacer length and density influence the distribution and function of transmembrane proteins.30 They observed a more homogeneous distribution of labeled integrin αIIbβ3 when using longer polymer spacers. Such results suggest that the membrane–substrate distance is a very significant variable for successfully incorporating transmembrane proteins into supported bilayers. Finally, Kunding and Stamou reported that the membrane–substrate distance in the presence of a PEG cushion could be varied by modulating the ionic strength of the solution.67
Herein, rapid diffusion of annexin V with a high protein mobile fraction was achieved with a double-cushion system. The key difference between this platform and previous designs is the fact that a sacrificial protein layer was present between the polymer-cushioned membrane and the underlying substrate. BSA monolayers have been previously shown to resist the adsorption of additional proteins on glass substrates69 and are almost certainly providing a passivating layer in the present case. Strong evidence for this statement comes from Tables 4 and 5. Indeed, three-quarters of the annexin V molecules were immobile in the PEG5000-PE system in the absence of the BSA monolayer. Such a result is consistent with the notion that the transmembrane protein molecules diffuse laterally until they encounter a high-energy site on the glass substrate, which leads to immobilization. Once a majority of high-energy sites have been passivated, however, the rest of the annexin V molecules remain mobile over periods of time sufficiently long to perform fluorescence recovery experiments.
It should be noted that the mere presence of the BSA layer in double-cushion systems does not appear to be sufficient to produce a high fraction of mobile protein molecules. Indeed, reducing the thickness of the PEG layer also reduces the mobile protein fraction (Table 5). It is curious that the mobile fraction increases essentially monotonically with increasing PEG length at the onset of the mushroom-to-brush transition. This is consistent with the notion that a minimum offset distance is required for a high fraction of protein molecules to diffuse freely. Moreover, it is consistent with faster diffusion coefficients for the mobile fraction. This should be the case as a result of reduced drag of the membrane protein on the immobilized support surface.
Finally, it should be noted that the concentration of BSA incubated above the interface was key to forming high-quality supported bilayers (Figure 3). Previous investigations have shown that relatively smooth BSA monolayers are formed with extensive spreading of these molecules under circumstances where the BSA concentration in the bulk solution is relatively low (Figure 6).69 However, high bulk protein concentrations led to more rapid BSA adsorption and higher surface densities. Consequently, there was much less protein spreading. The adsorption and relaxation kinetics of BSA molecules at the solid–liquid interface should play an important role in their function as cushions. It is probably the case that rougher surfaces, created with higher BSA concentrations, are not as conducive to the fusion of phospholipid vesicles. Indeed, previous studies have shown that vesicle fusion relies on relatively low substrate roughness.34,70
Figure 6.

BSA-coated glass coverslips. (Left) At low protein concentration, BSA forms a flat protein monolayer. (Right) At high protein concentration, a higher density of protein adsorbs more rapidly, which prevents the BSA molecules from spreading.
Acknowledgments
We thank the National Institutes of Health (R01-070622) for support. A.J.D. also acknowledges a fellowship from the NIH (5 F31 GM072434-03).
References
- 1.Brian AA, McConnell HM. Proc Natl Acad Sci USA. 1984;81:6159–6163. doi: 10.1073/pnas.81.19.6159. [DOI] [PMC free article] [PubMed] [Google Scholar]
- 2.Tamm LK, Mcconnell HM. Biophys J. 1985;47:105–113. doi: 10.1016/S0006-3495(85)83882-0. [DOI] [PMC free article] [PubMed] [Google Scholar]
- 3.McConnell HM, Watts TH, Weis RM, Brian AA. Biochim Biophys Acta. 1986;864:95–106. doi: 10.1016/0304-4157(86)90016-x. [DOI] [PubMed] [Google Scholar]
- 4.Kalb E, Frey S, Tamm LK. Biochim Biophys Acta. 1992;1103:307–316. doi: 10.1016/0005-2736(92)90101-q. [DOI] [PubMed] [Google Scholar]
- 5.Hubbard JB, Silin V, Plant AL. Biophys Chem. 1998;75:163–176. doi: 10.1016/s0301-4622(98)00199-9. [DOI] [PubMed] [Google Scholar]
- 6.Tamm LK, Shao Z. Biomembrane Structure. IOS Press; Amsterdam: 1998. [Google Scholar]
- 7.Koenig BW, Gawrisch K, Krueger S, Orts W, Majkrzak CF, Berk N, Silverton JV. Biophys J. 1996;70:229. doi: 10.1007/978-1-4615-5847-7_19. [DOI] [PubMed] [Google Scholar]
- 8.Thompson NL, Pearce KH, Hsieh HV. Eur Biophys J Biophy. 1993;22:367–378. doi: 10.1007/BF00213560. [DOI] [PubMed] [Google Scholar]
- 9.Yang T, Baryshnikova OK, Mao HB, Holden MA, Cremer PS. J Am Chem Soc. 2003;125:4779–4784. doi: 10.1021/ja029469f. [DOI] [PubMed] [Google Scholar]
- 10.Thompson NL, Drake AW, Chen LX, VandenBroek W. Photochem Photobiol. 1997;65:39–46. doi: 10.1111/j.1751-1097.1997.tb01875.x. [DOI] [PubMed] [Google Scholar]
- 11.Cornell BA, BraachMaksvytis VLB, King LG, Osman PDJ, Raguse B, Wieczorek L, Pace RJ. Nature. 1997;387:580–583. doi: 10.1038/42432. [DOI] [PubMed] [Google Scholar]
- 12.van Oudenaarden A, Boxer SG. Science. 1999;285:1046–1048. doi: 10.1126/science.285.5430.1046. [DOI] [PubMed] [Google Scholar]
- 13.Elender G, Kuhner E, Sackmann E. Biosens Bioelectron. 1996;11:565–577. doi: 10.1016/0956-5663(96)83292-1. [DOI] [PubMed] [Google Scholar]
- 14.Hillebrandt H, Wiegand G, Tanaka M, Sackmann E. Langmuir. 1999;15:8451–8459. [Google Scholar]
- 15.Goennenwein S, Tanaka M, Hu B, Moroder L, Sackmann E. Biophys J. 2003;85:646–655. doi: 10.1016/S0006-3495(03)74508-1. [DOI] [PMC free article] [PubMed] [Google Scholar]
- 16.Baumgart T, Offenhausser A. Langmuir. 2003;19:1730–1737. [Google Scholar]
- 17.Zhang LQ, Longo ML, Stroeve P. Langmuir. 2000;16:5093–5099. [Google Scholar]
- 18.Majewski J, Wong JY, Park CK, Seitz M, Israelachvili JN, Smith GS. Biophys J. 1998;75:2363–2367. doi: 10.1016/S0006-3495(98)77680-5. [DOI] [PMC free article] [PubMed] [Google Scholar]
- 19.Ma C, Srinivasan MP, Waring AJ, Lehrer RI, Longo ML, Stroeve P. Colloids Surf, B. 2003;28:319–329. [Google Scholar]
- 20.Kugler R, Knoll W. Bioelectrochemistry. 2002;56:175–178. doi: 10.1016/s1567-5394(02)00031-2. [DOI] [PubMed] [Google Scholar]
- 21.Spinke J, Yang J, Wolf H, Liley M, Ringsdorf H, Knoll W. Biophys J. 1992;63:1667–1671. doi: 10.1016/S0006-3495(92)81742-3. [DOI] [PMC free article] [PubMed] [Google Scholar]
- 22.Shen WW, Boxer SG, Knoll W, Frank CW. Biomacromolecules. 2001;2:70–79. doi: 10.1021/bm005581z. [DOI] [PubMed] [Google Scholar]
- 23.Beyer D, Elender G, Knoll W, Kuhner M, Maus S, Ringsdorf H, Sackmann E. Angew Chem Int Ed. 1996;35:1682–1685. [Google Scholar]
- 24.Hausch M, Zentel R, Knoll W. Macromol Chem Phys. 1999;200:174–179. [Google Scholar]
- 25.Seitz M, Ter-Ovanesyan E, Hausch M, Park CK, Zasadzinski JA, Zentel R, Israelachvili JN. Langmuir. 2000;16:6067–6070. doi: 10.1021/la9915771. [DOI] [PMC free article] [PubMed] [Google Scholar]
- 26.Seitz M, Wong JY, Park CK, Alcantar NA, Israelachvili J. Thin Solid Films. 1998;329:767–771. [Google Scholar]
- 27.Wagner ML, Tamm LK. Biophys J. 2000;79:1400–1414. doi: 10.1016/S0006-3495(00)76392-2. [DOI] [PMC free article] [PubMed] [Google Scholar]
- 28.Sackmann E. Science. 1996;271:43–48. doi: 10.1126/science.271.5245.43. [DOI] [PubMed] [Google Scholar]
- 29.Lang H, Duschl C, Vogel H. Langmuir. 1994;10:197–210. [Google Scholar]
- 30.Purrucker O, Fortig A, Jordan R, Tanaka M. Chem Phys Chem. 2004;5:327–335. doi: 10.1002/cphc.200300863. [DOI] [PubMed] [Google Scholar]
- 31.Naumann CA, Frank CW, Prucker O, Lehmann T, Ruehe J, Knoll W. Biophys J. 2000;78:273a–273a. [Google Scholar]
- 32.Johnson JM, Ha T, Chu S, Boxer SG. Biophys J. 2002;83:3371–3379. doi: 10.1016/S0006-3495(02)75337-X. [DOI] [PMC free article] [PubMed] [Google Scholar]
- 33.Kim J, Kim G, Cremer PS. Langmuir. 2001;17:7255–7260. [Google Scholar]
- 34.Cremer PS, Boxer SG. J Phys Chem B. 1999;103:2554–2559. [Google Scholar]
- 35.Bayerl TM, Bloom M. Biophys J. 1990;58:357–362. doi: 10.1016/S0006-3495(90)82382-1. [DOI] [PMC free article] [PubMed] [Google Scholar]
- 36.Johnson SJ, Bayerl TM, Mcdermott DC, Adam GW, Rennie AR, Thomas RK, Sackmann E. Biophys J. 1991;59:289–294. doi: 10.1016/S0006-3495(91)82222-6. [DOI] [PMC free article] [PubMed] [Google Scholar]
- 37.Williams LM, Evans SD, Flynn TM, Marsh A, Knowles PF, Bushby RJ, Boden N. Langmuir. 1997;13:751–757. [Google Scholar]
- 38.Koenig BW, Kruger S, Orts WJ, Majkrzak CF, Berk NF, Silverton JV, Gawrisch K. Langmuir. 1996;12:1343–1350. [Google Scholar]
- 39.Kiessling V, Tamm LK. Biophys J. 2003;84:408–418. doi: 10.1016/S0006-3495(03)74861-9. [DOI] [PMC free article] [PubMed] [Google Scholar]
- 40.Tanaka M, Sackmann E. Nature. 2005;437:656–663. doi: 10.1038/nature04164. [DOI] [PubMed] [Google Scholar]
- 41.Tanaka M. MRS Bull. 2006;31:513–520. [Google Scholar]
- 42.Sackmann E, Tanaka M. Trends Biotechnol. 2000;18:58–64. doi: 10.1016/s0167-7799(99)01412-2. [DOI] [PubMed] [Google Scholar]
- 43.Wiegand G, Jaworek T, Wegner G, Sackmann E. J Colloid Interface Sci. 1997;196:299–312. doi: 10.1006/jcis.1997.5193. [DOI] [PubMed] [Google Scholar]
- 44.Wagner ML, Tamm LK. Biophys J. 2001;81:266–275. doi: 10.1016/S0006-3495(01)75697-4. [DOI] [PMC free article] [PubMed] [Google Scholar]
- 45.Smith EA, Coym JW, Cowell SM, Tokimoto T, Hruby VJ, Yamamura HI, Wirth MJ. Langmuir. 2005;21:9644–9650. doi: 10.1021/la051116h. [DOI] [PMC free article] [PubMed] [Google Scholar]
- 46.Davis RW, Flores A, Barrick TA, Cox JM, Brozik SM, Lopez GP, Brozik JA. Langmuir. 2007;23:3864–3872. doi: 10.1021/la062576t. [DOI] [PubMed] [Google Scholar]
- 47.Huber R, Romisch J, Paques EP. EMBO J. 1990;9:3867–3874. doi: 10.1002/j.1460-2075.1990.tb07605.x. [DOI] [PMC free article] [PubMed] [Google Scholar]
- 48.Berendes R, Voges D, Demange P, Huber R, Burger A. Science. 1993;262:427–430. doi: 10.1126/science.7692599. [DOI] [PubMed] [Google Scholar]
- 49.Seaton BA. Annexins: Molecular Structure to Cellular Function. Landes Co; Austin, TX: 1996. [Google Scholar]
- 50.Isas JM, Cartailler JP, Sokolov Y, Patel DR, Langen R, Luecke H, Hall JE, Haigler HT. Biochemistry. 2000;39:3015–3022. doi: 10.1021/bi9922401. [DOI] [PubMed] [Google Scholar]
- 51.Langen R, Isas JM, Hubbell WL, Haigler HT. Proc Natl Acad Sci USA. 1998;95:14060–14065. doi: 10.1073/pnas.95.24.14060. [DOI] [PMC free article] [PubMed] [Google Scholar]
- 52.Binder H, Kohler G, Arnold K, Zschornig O. Chem Phys Chem. 2000;2:4615–4623. [Google Scholar]
- 53.Albertorio F, Diaz AJ, Yang TL, Chapa VA, Kataoka S, Castellana ET, Cremer PS. Langmuir. 2005;21:7476–7482. doi: 10.1021/la050871s. [DOI] [PubMed] [Google Scholar]
- 54.Nollert P, Kiefer H, Jahnig F. Biophys J. 1995;69:1447–1455. doi: 10.1016/S0006-3495(95)80014-7. [DOI] [PMC free article] [PubMed] [Google Scholar]
- 55.Cremer PS, Groves JT, Kung LA, Boxer SG. Langmuir. 1999;15:3893–3896. [Google Scholar]
- 56.Groves JT, Ulman N, Cremer PS, Boxer SG. Langmuir. 1998;14:3347–3350. [Google Scholar]
- 57.Mao HB, Yang TL, Cremer PS. Anal Chem. 2002;74:379–385. doi: 10.1021/ac010822u. [DOI] [PubMed] [Google Scholar]
- 58.Albertorio F, Daniel S, Cremer PS. J Am Chem Soc. 2006;128:7168–7169. doi: 10.1021/ja062010r. [DOI] [PMC free article] [PubMed] [Google Scholar]
- 59.Yang TL, Jung SY, Mao HB, Cremer PS. Anal Chem. 2001;73:165–169. doi: 10.1021/ac000997o. [DOI] [PubMed] [Google Scholar]
- 60.Cezanne L, Lopez A, Loste F, Parnaud G, Saurel O, Demange P, Tocanne JF. Biochemistry. 1999;38:2779–2786. doi: 10.1021/bi9818568. [DOI] [PubMed] [Google Scholar]
- 61.Saurel O, Cezanne L, Milon A, Tocanne JF, Demange P. Biochemistry. 1998;37:1403–1410. doi: 10.1021/bi971484n. [DOI] [PubMed] [Google Scholar]
- 62.Richter RP, Him JLK, Tessier B, Tessier C, Brisson AR. Biophys J. 2005;89:3372–3385. doi: 10.1529/biophysj.105.064337. [DOI] [PMC free article] [PubMed] [Google Scholar]
- 63.Axelrod D, Koppel DE, Schlessinger J, Elson E, Webb WW. Biophys J. 1976;16:1055–1069. doi: 10.1016/S0006-3495(76)85755-4. [DOI] [PMC free article] [PubMed] [Google Scholar]
- 64.Jacobson K, Derzko Z, Wu ES, Hou Y, Poste G. J Supramol Struct. 1976;5:565–576. doi: 10.1002/jss.400050411. [DOI] [PubMed] [Google Scholar]
- 65.Rossetti FF, Textor M, Reviakine I. Langmuir. 2006;22:3467–3473. doi: 10.1021/la053000r. [DOI] [PubMed] [Google Scholar]
- 66.Marsh D, Bartucci R, Sportelli L. Biochim Biophys Acta. 2003;1615:33–59. doi: 10.1016/s0005-2736(03)00197-4. [DOI] [PubMed] [Google Scholar]
- 67.Kunding A, Stamou D. J Am Chem Soc. 2006;128:11328–11329. doi: 10.1021/ja062545k. [DOI] [PubMed] [Google Scholar]
- 68.Munro JC, Frank CW. Langmuir. 2004;20:3339–3349. doi: 10.1021/la036062v. [DOI] [PubMed] [Google Scholar]
- 69.Sweryda-Krawiec B, Devaraj H, Jacob G, Hickman JJ. Langmuir. 2004;20:2054–2056. doi: 10.1021/la034870g. [DOI] [PubMed] [Google Scholar]
- 70.Castellana ET, Cremer PS. Surf Sci Rep. 2006;61:429–444. doi: 10.1016/j.surfrep.2006.06.001. [DOI] [PMC free article] [PubMed] [Google Scholar]