

Abstract
The symptoms of Parkinson's disease (PD) are related to changes in the frequency and pattern of activity in the reciprocally connected GABAergic external globus pallidus (GPe) and glutamatergic subthalamic nucleus (STN). In idiopathic and experimental PD, the GPe and STN exhibit hypoactivity and hyperactivity, respectively, and abnormal synchronous rhythmic burst firing. Following lesion of midbrain dopamine neurons, abnormal STN activity emerges slowly and intensifies gradually until it stabilizes after 2–3 weeks. Alterations in cellular/network properties may therefore underlie the expression of abnormal firing. Because the GPe powerfully regulates the frequency, pattern, and synchronization of STN activity, electrophysiological, molecular, and anatomical measures of GPe–STN transmission were compared in the STN of control and 6-hydroxydopamine-lesioned rats and mice. Following dopamine depletion: (1) the frequency (but not the amplitude) of mIPSCs increased by ∼70%; (2) the amplitude of evoked IPSCs and isoguvacine-evoked current increased by ∼60% and ∼70%, respectively; (3) mRNA encoding α1, β2, and γ2 GABAA receptor subunits increased by 15–30%; (4) the density of postsynaptic gephyrin and γ2 subunit coimmunoreactive structures increased by ∼40%, whereas the density of vesicular GABA transporter and bassoon coimmunoreactive axon terminals was unchanged; and (5) the number of ultrastructurally defined synapses per GPe–STN axon terminal doubled with no alteration in terminal/synapse size or target preference. Thus, loss of dopamine leads, through an increase in the number of synaptic connections per GPe–STN axon terminal, to substantial strengthening of the GPe–STN pathway. This adaptation may oppose hyperactivity but could also contribute to abnormal firing patterns in the parkinsonian STN.
Introduction
The reciprocally connected GABAergic external segment of the globus pallidus (GPe) and glutamatergic subthalamic nucleus (STN) occupy pivotal positions in cortico-basal ganglia-thalamo-cortical networks necessary for action selection (Smith et al., 1998). In Parkinson's disease (PD), degeneration of substantia nigra dopamine neurons leads to hyperactivity of striatal D2 dopamine receptor-expressing medium spiny neurons (D2-MSNs) and hypoactivity and hyperactivity of GPe and STN neurons, respectively, which together contribute to the excessive inhibitory output of the parkinsonian basal ganglia (Gerfen and Surmeier, 2011; Wichmann et al., 2011). Abnormal hypersynchronous rhythmic burst firing may also contribute to motor symptoms because: (1) this activity pattern is prevalent in the parkinsonian basal ganglia; (2) reduction of hypersynchronous rhythmic activity through dopamine-based therapies or high-frequency (>100 Hz) electrical stimulation is associated with symptomatic relief often in the absence of corrective changes in firing rate; and (3) electrical stimulation of the STN at frequencies in the pathological tremor and beta bands exacerbates symptoms (Benabid et al., 2009; Zaidel et al., 2009; Jenkinson and Brown, 2011; Wichmann et al., 2011).
Although loss of dopaminergic neuromodulation directly contributes to abnormal STN activity in PD (Galati et al., 2009), alterations in cellular and network properties may also be significant because abnormal activity develops gradually over 2–3 weeks following lesion of midbrain dopamine neurons (Vila et al., 2000; Mallet et al., 2008a). During this period, there are changes in elements of the “indirect” pathway. In D2-MSNs corticostriatal axospinous synapses decline in number (Day et al., 2006) and inputs from fast-spiking GABAergic interneurons increase (Gittis et al., 2011), and in GPe and STN neurons autonomous firing activity decreases (Zhu et al., 2002; Wilson et al., 2006; Chan et al., 2011). These adaptations may reflect homeostatic compensatory processes triggered by hyperactivity of D2-MSNs but could also be maladaptive by contributing to abnormal firing patterns.
The GPe is the dominant source of GABAergic input to the STN (Smith et al., 1998) and patterns activity predominantly through GABAA receptors (Hallworth and Bevan, 2005). The hyperpolarized equilibrium potential of postsynaptic GABAA receptor current (Bevan et al., 2002) and the unitary and collective strength of GPe–STN inputs (Baufreton et al., 2009) enable the GPe to: inhibit and synchronize STN activity through deactivation of pacemaker Nav channels (Baufreton et al., 2005, 2009); promote synaptic excitation through de-inactivation of Nav channels (Baufreton et al., 2005); and generate rebound burst firing through de-inactivation of Cav1 and Cav3 channels (Bevan et al., 2002; Hallworth and Bevan, 2005; Atherton et al., 2010). Given the potency with which GPe inputs pattern STN activity and the evidence for enhanced functional connectivity between the parkinsonian GPe and STN in vivo (Mallet at al., 2008a,b; Cruz et al., 2011; Moran et al., 2011), we sought to determine whether the loss of midbrain dopamine neurons leads to adaptations in GPe–STN synaptic properties that may compensate for and/or contribute to abnormal STN activity.
Materials and Methods
Animals.
Experiments were performed in accordance with institutional, NIH, and Society for Neuroscience guidelines using male Sprague Dawley rats (Charles River) except for quantitative PCR where male C57BL/6 mice (Charles River) were used due to the availability of species-specific primers.
Statistics.
Data are reported as mean ± SD. Cumulative and box (central line, median; dot, mean; box, 25–75%; whiskers, 10–90%) plots are used to illustrate sample distributions. The Kolmogorov–Smirnov test was used to test for significant differences in cumulative distributions (Prism 5, GraphPad). Mann–Whitney and Wilcoxon signed rank tests were used to test for significant differences between unpaired and paired data, respectively (Prism 5). The level of significance was set at p < 0.05. Nonsignificant differences are denoted as NS.
Surgery and slice preparation.
Under ketamine/xylazine anesthesia, unilateral, stereotaxic injections (2–5 μl) of 6-hydroxydopamine (6-OHDA; 3–5 mg/ml) or vehicle were made in the substantia nigra or medial forebrain bundle. To assess the degree of associated motor impairment, forelimb use asymmetry was assessed 1–2 weeks postsurgery, as described previously (Schallert et al., 2000). The number of spontaneous exploratory touches made by each forepaw on the wall of a clear plastic cylinder (18 cm wide for rats; 9 cm wide for mice) was recorded using a digital camcorder for 10–20 min over two sessions and scored using IMovie (Apple).
Approximately 2–3 weeks postsurgery, 6-OHDA- and vehicle-injected animals were perfused transcardially under ketamine/xylazine anesthesia with ice-cold modified artificial CSF (ACSF). 6-OHDA-injected animals (n = 44) were perfused 17.9 ± 4.2 d after surgery, and vehicle-injected animals (n = 13) were perfused 19.4 ± 3.8 d after surgery. Age-matched control animals (n = 23) were also transcardially perfused with the same solution. At the time of perfusion, 6-OHDA-injected, vehicle-injected, and age-matched control animals were 55.3 ± 16.6, 67.3 ± 9.2, and 53.0 ± 15.1 d old, respectively. Modified ACSF was equilibrated with 95% O2/5% CO2 and contained the following (in mm): 230 sucrose, 26 NaHCO3, 2.5 KCl, 1.25 NaH2PO4, 0.5 CaCl2, 10 MgSO4, and 10 glucose. Each brain was sliced at 250–300 μm (electrophysiology/quantitative PCR) or at 125 μm (immunocytochemistry for synaptic markers) in the sagittal plane using a vibratome (Vibratome 3000; Leica). Slices containing the STN were stored in ACSF, which was equilibrated with 95% O2/5% CO2 and contained the following (in mm): 126 NaCl, 26 NaHCO3, 2.5 KCl, 1.25 NaH2PO4, 2 CaCl2, 2 MgSO4, and 10 glucose.
Electrophysiology.
Slices were perfused with ACSF, which was heated to 35–37°C, equilibrated with 95% O2/5% CO2, and contained the following (in mm): 126 NaCl, 26 NaHCO3, 3 KCl, 1.25 NaH2PO4, 1.6 CaCl2, 1.5 MgSO4, 10 glucose, 0.05 d-(−)-2-amino-5-phosphonopentanoic acid (APV), 0.02 6,7-dinitroquinoxaline-2,3-dione (DNQX), and 0.002 (2S)-3-{[(1S)-1-(3,4-dichlorophenyl)ethyl]amino-2-hydroxypropyl) (phenylmethyl)phosphinic acid (CGP55845). APV, DNQX, and CGP55845 were used to block NMDA, AMPA/kainate, and GABAB receptors, respectively, so that GABAA receptor-mediated currents could be studied in relative isolation (Bevan et al., 2002; Hallworth and Bevan, 2005). Miniature IPSCs (mIPSCs) were recorded in the additional presence of 0.5 μm tetrodotoxin. In some cases, sulpiride (2 μm) was added to block D2 dopamine receptors. Drugs were purchased from Abcam, except for sulpiride, which was obtained from Tocris Bioscience.
Somatic patch-clamp recordings were obtained under visual guidance (Axioskop FS2, Zeiss) using computer-controlled manipulators (Luigs & Neumann) and a Multiclamp 700B amplifier and Digidata 1440A digitizer controlled by PClamp 10 (Molecular Devices). Pipettes contained the following (in mm): 135 CsCl, 3.6 NaCl, 1 MgCl2, 10 HEPES, 10 QX-314, 0.1 Na4EGTA, 0.4 Na3GTP, and 2 Mg1.5ATP, pH 7.2 and 290 mOsm, or 130 Kgluconate, 3.6 Nagluconate, 1 MgCl2, 10 HEPES, 10 QX-314, TEA-Cl 5, 0.1 Na4EGTA, 0.4 Na3GTP and 2 Mg1.5ATP, pH 7.2 and 290 mOsm, for the recording of GABAA receptor-mediated mIPSCs and evoked currents, respectively. mIPSCs were recorded at −60 mV. Evoked IPSCs and isoguvacine-evoked currents were recorded at −50 mV. Weighted decay kinetics of mIPSCs were calculated from τ decay = (A1*τ1 + A2*τ2)/(A1 + A2), where A and τ refer to the amplitude and decay constants, respectively, of biexponential fits of mIPSCs. Data were analyzed with Clampfit 10 (Molecular Devices), Igor Pro 6 (Wavemetrics), and Origin 8 (OriginLab).
Quantitative PCR.
The STN was microdissected from 250 μm sagittal slices prepared as described above. STN RNA was first isolated using RNeasy Plus Mini Kit (Qiagen). STN cDNA was then synthesized using qScript cDNA Supermix (Quanta Biosciences) under the following conditions: 5 min at 25°C, 30 min at 42°C, 5 min at 85°C, and then held at 4°C. Quantitative PCR was run in triplicate, including negative controls, using SYBR Green I on a StepOnePlus thermocycler (Applied Biosystems) under the following conditions: 95°C for 20 s, 40 cycles at 95°C for 3 s and 60°C for 30 s. The PCR cycle threshold (CT) values were set in StepOne Plus (Applied Biosystems) within the exponential phase of the PCR. Custom synthesized primers (Invitrogen) were desalted and intron-spanning. Melting curves verified amplification of single PCR products. Primers were further validated with PCR and gel electrophoresis of whole-brain tissue samples to confirm the amplification of PCR products with the predicted molecular weight. After performing quantitative PCR, outliers were removed from triplicates if the SD of the PCR cycle was >0.3. Samples that showed an SD > 0.3 after outlier removal were excluded from further analysis.
A relative quantification approach, the ΔΔCT method, was used to compare transcript levels. Expression levels were normalized to five housekeeping genes: gapdh, atp5b, sdha, uchl1, and cyc1. The contribution of each gene was weighted to its relative stability (Chan et al., 2012), based on the integration of the following four algorithms: geNorm (Vandesompele et al., 2002); Normfinder (Andersen et al., 2004); BestKeeper (Pfaffl et al., 2004); and the comparative ΔCt method (Silver et al., 2006; Integration tool available at http://www.leonxie.com/referencegene.php). Expression data are presented as the fold difference relative to control.
Immunocytochemistry of synaptic markers.
The 125-μm-thick sagittal slices, prepared as described above, were immersion fixed in 4% paraformaldehyde in 0.1 m PB, pH 7.4, at room temperature for 20 min. After washing in PBS, slices were incubated in primary antibodies (Synaptic Systems), as indicated in Table 1, in PBS plus 0.3% Triton X-100 (Sigma-Aldrich) and 2% normal donkey serum for 48 h at 4°C. After washing, slices were incubated in fluorescent secondary antibodies (Jackson Immunoresearch; Table 1) in the same diluent for 2 h at room temperature. Slices were then mounted in ProLong Gold (Invitrogen) on glass slides and coverslipped.
Table 1.
Antibodies used for immunocytochemistry of GPe–STN synaptic markers
| Antibody | Species | Primary dilution | Secondary antibody | Secondary dilution | |
|---|---|---|---|---|---|
| Double labeling | GABAA receptor γ2 subunit | Rabbit | 1:1000 | DyLight 594 donkey anti-rabbit IgG | 1:250 |
| Gephyrin | Mouse | 1:300 | DyLight 488 donkey anti-mouse IgG | 1:250 | |
| Double labeling | vGAT | Mouse | 1:250 | Cyanine Cy3 donkey anti-mouse IgG | 1:250 |
| Bassoon | Guinea pig | 1:1000 | Alexa Fluor 488 donkey anti-guinea pig IgG | 1:250 | |
| Single labeling | vGAT | Rabbit | 1:1000 | DyLight 594 donkey anti-rabbit IgG or biotinylated donkey anti-rabbit IgG | 1:250 |
Immunofluorescent labeling was visualized using confocal laser scanning microscopy (LSM 510, Zeiss). Image stacks (16 optical sections each) were acquired using a 63× oil-immersion objective (numerical aperture 1.4) with a digital zoom of 1.5× (x, y, 1024 × 1024 pixels, 93 nm per pixel; z-step, 0.3–0.4 μm). For multichannel image acquisition, fluorophores were excited alternately. Pinholes were set to the same airy unit for each laser to obtain identical optical section thickness. Images were acquired using the same settings and analyzed without postprocessing. The density, fluorescent intensity, and dimensions of immunoreactive structures were assessed with ImageJ (NIH).
The densities of gephyrin-, γ2-, vesicular GABA transporter (vGAT)-, and bassoon-immunoreactive structures were quantified using the optical dissector method (West, 1999). Sample sites were chosen using a grid (frame size, 11.9 × 11.9 μm) that was superimposed randomly on each image stack. Stereological counting commenced at an optical section ∼5 μm below the slice surface. Immunoreactive structures were counted if they appeared within the sample frame and in the reference but not the adjacent look-up optical section. For gephyrin and γ2 colocalization, gephyrin-immunoreactive structures were selected stereologically and colocalization of these structures with γ2-immunoreactive structures was then determined. For vGAT and bassoon colocalization, vGAT-immunoreactive structures were first selected stereologically and colocalization with bassoon-immunoreactive structures was subsequently determined. Removal or prior incubation of primary antibodies with their respective immunogenic synthetic peptides abolished specific labeling.
Electron microscopy.
Under ketamine/xylazine anesthesia, animals were transcardially perfused with ∼50 ml of HEPES-buffered ACSF, which was equilibrated with O2 and contained the following (in mm): 140 NaCl, 3 KCl, 1.6 CaCl2, 15 HEPES, 10 MgCl2, and 23 glucose, followed by 250 ml of 0.1% glutaraldehyde and 4% paraformaldehyde in 0.1 m PB for 15 min, 4% paraformaldehyde in 0.1 m PB for 15 min, and finally 0.1 m PB for 15 min. Seventy-five micrometer coronal sections were then prepared with a vibratome (VT1000 S, Leica). To permeabilize the tissue in a manner compatible with ultrastructural preservation, sections were equilibrated in cryoprotectant medium (25% sucrose, 15% glycerol in 0.05 m PB), rapidly frozen in cooled isopentane and liquid nitrogen, and then thawed at room temperature. After washing in PBS, sections were incubated in rabbit anti-vGAT primary antibody (1:1000) and 2% normal donkey serum in PBS for 48 h at 4°C. Sections were then washed and incubated in biotinylated donkey anti-rabbit IgG (1:500) in the same diluent for 2 h at room temperature. Sections were then washed and incubated in avidin–biotin–peroxidase complex (Vector Laboratories) in the same diluent for 2 h at room temperature before further washing in PBS. Finally, vGAT immunoreactivity was revealed by incubation in 0.025% diaminobenzidine tetrahydrochloride (DAB) and 0.0025% H2O2 in Tris buffer (0.05 m), pH 7.4, for 5–10 min. Sections were then prepared for electron microscopy: sections were postfixed with 1% OsO4 in 0.1 m PB, dehydrated through a graded alcohol series, contrasted with 1% uranyl acetate, and embedded in epoxy resin (Durcupan, Fluka) between coverslips and glass slides. STN tissue was then resectioned at ∼70 nm using an ultramicrotome (UCT, Leica Microsystems). Ultrathin sections were mounted on pioloform-coated slot grids, stained with lead citrate, and examined using an electron microscope (Tecnai Spirit G2, FEI) equipped with a digital camera. Entire individual ultrathin sections were systematically scanned at ∼10,000× for vGAT-immunoreactive structures. Each vGAT-immunoreactive structure was then imaged at higher magnification (20,000–25,000×), and measurements were taken using ImageJ. The dimensions of vGAT-immunoreactive structures, postsynaptic structures, and synapses were measured. Synapses were defined according to classical criteria, i.e., the presence of synaptic vesicles associated with the presynaptic active zone, the presence of a synaptic cleft with cleft material, and the presence of presynaptic and postsynaptic membrane specializations.
Immunocytochemistry for tyrosine hydroxylase.
Brain tissue was immersion fixed in 4% paraformaldehyde in 0.1 m PB (see Surgery and slice preparation) or perfusion fixed in 0.1% glutaraldehyde and 4% paraformaldehyde in 0.1 m PB (see Electron microscopy). Fixed tissue was then sectioned at 70 μm on a vibratome (VT1000 S, Leica) and processed for the detection of tyrosine hydroxylase (TH) using immunofluorescent or immunoperoxidase techniques. For immunofluorescent detection, slices were incubated in 1:500 mouse anti-TH (Millipore) in PBS plus 0.3% Triton X-100 and 2% normal donkey serum for 48 h at 4°C. After washing, sections were incubated in 1:200 DyLight 488 donkey anti-mouse IgG in the same diluent for 2 h at room temperature. For immunoperoxidase detection, slices were treated as above except that 1:100 biotinylated donkey anti-mouse IgG (Jackson Immunoresearch) was used as the secondary antibody and sections were subsequently incubated in 1:100 avidin–biotin peroxidase complex (Vector Laboratories) before peroxidase was revealed with DAB and H2O2, as described above. Sections were mounted on glass slides, coverslipped, and then imaged under epifluorescent or bright-field illumination using a microscope (Axioskop, Zeiss) equipped with a software-controlled CCD camera (Axiovision/Axiocam, Zeiss). Immunoreactivity was assessed from optical densities acquired with ImageJ (NIH). Specific immunoreactivity for tyrosine hydroxylase was defined as immunoreactivity of the dorsal striatum minus immunoreactivity of the overlying motor cortex in the same section.
Results
To determine the impact of chronic dopamine depletion on GPe–STN transmission GABAergic transmission was compared in brain slices derived from animals that had received unilateral 6-OHDA injections in the substantia nigra or medial forebrain bundle ∼2–3 weeks earlier (n = 44) and control animals that had received similarly timed vehicle injections (n = 13) or were age matched (n = 23). Data derived from the control groups were similar and were therefore pooled. 6-OHDA-lesioned animals exhibited profound asymmetric forelimb use (forelimb ipsilateral to 6-OHDA injection normalized to total forelimb movement = 75.0 ± 15.7%, n = 44), which is a faithful marker of substantial dopamine depletion ipsilateral to the preferred forelimb (Schallert et al., 2000). Indeed, TH immunoreactivity of the striatum ipsilateral to the injection of 6-OHDA and forelimb preference was found to be profoundly reduced compared with the contralateral striatum in each 6-OHDA-injected animal (ipsilateral = 1.7 ± 5.5% of contralateral immunoreactivity, n = 44).
Because the GPe is the principal source of GABAergic inputs to STN neurons (Smith et al., 1998) and these inputs are mediated largely through GABAA receptors (Baufreton et al., 2005, 2009; Hallworth and Bevan, 2005), GABAA receptor-mediated transmission and its associated molecular and anatomical markers in the STN were used as measures of GPe–STN transmission. The impact of chronic dopamine depletion on GPe–STN transmission was first assessed by whole-cell patch-clamp recording. The frequency of action potential-independent transmission, measured in the presence of 0.5 μm tetrodotoxin, was significantly increased by dopamine depletion (Fig. 1; control = 1.05 ± 0.36 Hz, n = 26; 6-OHDA = 1.80 ± 1.59 Hz, n = 35; p < 0.05). The decay time constant of mIPSCs was also increased by dopamine depletion (Fig. 1; control = 6.48 ± 1.92 ms, n = 26; 6-OHDA = 7.78 ± 2.40 ms, n = 35; p < 0.05). However, the mean conductance underlying mIPSCs was unaltered (Fig. 1; control = 0.70 ± 0.24 nS, n = 26; 6-OHDA = 0.76 ± 0.23 nS, n = 35; NS). Application of the D2-like dopamine receptor antagonist sulpiride (2 μm) to control slices had no effect on the frequency, conductance, or decay kinetics of mIPSCs (sulpiride data normalized to control: frequency = 0.95 ± 0.17, n = 7, NS; conductance = 0.86 ± 0.18, n = 7, NS; kinetics = 1.2 ± 0.12, n = 7; NS), confirming that basal activation of presynaptic D2-like dopamine receptors (Shen and Johnson, 2000; Baufreton and Bevan, 2008) does not underlie the relatively low-frequency and rapid kinetics of mIPSCs in control slices compared with those derived from 6-OHDA-treated animals.
Figure 1.

Chronic dopamine depletion increased the frequency and prolonged the decay kinetics of mIPSCs. A, Representative recordings of mIPSCs in STN neurons derived from control and 6-OHDA-treated animals. The frequency but not the amplitude of mIPSCs was greater following dopamine depletion. B, Cumulative probability (cum. prob.) plots of the sample populations confirmed that dopamine depletion significantly reduced the intervals between mIPSCs but had no effect on the conductance underlying mIPSCs. C, The mean frequency of mIPSCs was significantly enhanced by dopamine depletion, whereas the mean conductance underlying mIPSCs was unaltered. D, The decay of mIPSCs was prolonged by chronic dopamine depletion, as evidenced by representative mean peak-scaled mIPSCs and box plots. *p < 0.05.
To further address the contribution of presynaptic and/or postsynaptic mechanisms to the alteration in GPe–STN transmission, the effect of chronic dopamine depletion on IPSCs evoked by bipolar electrical stimulation of the internal capsule rostral to the STN at 10 or 50 Hz was studied. Electrical stimulation intensity was increased until the maximum IPSC was evoked. Although the intensity of stimulation required to generate the maximum IPSC was not significantly different in control and 6-OHDA lesion groups (control = 706 ± 78 μA, n = 20; 6-OHDA = 719 ± 69 μA, n = 15; NS), dopamine depletion significantly increased the conductance underlying evoked IPSCs (Fig. 2; Table 2). Dopamine depletion had no effect on the short-term synaptic plasticity of GPe–STN transmission (Fig. 2; Table 2). Application of the D2-like dopamine receptor antagonist sulpiride (2 μm) to control slices also had no effect on the conductance underlying evoked IPSCs (sulpiride data normalized to control: 10 Hz IPSC1 = 0.98 ± 0.21, n = 7, NS; 10 Hz IPSC25 = 1.00 ± 0.37, n = 7, NS) or the short-term plasticity of evoked IPSCs (sulpiride data normalized to control: 10 Hz IPSC2/IPSC1 = 1.03 ± 0.14, n = 4, NS; 10 Hz IPSC25/IPSC1 = 0.98 ± 0.12, n = 4, NS; 50 Hz IPSC2/IPSC1 = 0.99 ± 0.09, n = 7, NS; 50 Hz IPSC25/IPSC1 = 1.01 ± 0.21, n = 7, NS), confirming that basal activation of presynaptic D2-like dopamine receptors (Shen and Johnson, 2000; Baufreton and Bevan, 2008) does not underlie the relatively small amplitude of evoked IPSCs in control slices compared with those derived from 6-OHDA-treated animals. Together, these data suggest that the augmentation of GPe–STN synaptic transmission following loss of dopamine is not mediated by an alteration in the probability of transmission.
Figure 2.

Chronic dopamine depletion increased the magnitude of evoked GABAA receptor-mediated synaptic transmission but had no effect on short-term synaptic plasticity. A–H, Following chronic dopamine depletion, the magnitude of synaptic transmission evoked at 10 Hz (A–D) and 50 Hz (E–H) was enhanced with no alteration in short-term synaptic plasticity. A, E, Representative recordings. B, F, Peak and normalized conductances plotted against IPSC number. C, D, G, H, Chronic dopamine depletion significantly increased the conductances underlying IPSC1 and IPSC25 (C, G) but had no effect on the ratio of conductances underlying IPSC2 to IPSC1 or IPSC25 to IPSC1 (D, H). *p < 0.05.
Table 2.
Chronic dopamine depletion increases the maximum evoked GABAA receptor-mediated synaptic conductance but has no effect on short-term synaptic plasticity
| Control (nS) | 6-OHDA (nS) | Significance | |
|---|---|---|---|
| IPSC1 | 7.03 ± 3.10 (n = 20) | 11.17 ± 5.41 (n = 15) | p < 0.05 |
| IPSC25 (10 Hz) | 5.59 ± 2.58 (n = 20) | 8.62 ± 4.42 (n = 15) | p < 0.05 |
| IPSC2:IPSC1 (10 Hz) | 0.94 ± 0.06 (n = 20) | 0.96 ± 0.04 (n = 15) | NS |
| IPSC25:IPSC1 (10 Hz) | 0.79 ± 0.10 (n = 20) | 0.77 ± 0.09 (n = 15) | NS |
| IPSC2:IPSC1 (50 Hz) | 0.86 ± 0.18 (n = 20) | 0.89 ± 0.16 (n = 14) | NS |
| IPSC25:IPSC1 (50 Hz) | 0.56 ± 0.18 (n = 20) | 0.64 ± 0.21 (n = 14) | NS |
The frequency of electrical stimulation (10 or 50 Hz) and the number of the evoked IPSC (e.g., IPSC1 and IPSC2) are denoted.
To further address the contribution of postsynaptic mechanisms to the augmentation of GPe–STN transmission following depletion of dopamine, the magnitude of GABAA receptor conductance evoked by perfusion of 20 μm isoguvacine, a slowly desensitizing GABAA receptor agonist, was examined. Chronic dopamine depletion significantly increased the peak amplitude of the isoguvacine-evoked conductance (Fig. 3; control = 4.61 ± 1.84 nS, n = 6; 6-OHDA = 7.80 ± 1.10 nS, n = 5; p < 0.05). This observation suggests that the expression of GABAA receptors by STN neurons is increased following the loss of dopamine. Together, the electrophysiological data demonstrate that GPe–STN synaptic transmission is greatly enhanced by chronic dopamine depletion and that postsynaptic alterations contribute to this enhancement. Furthermore, the increased frequency of mIPSCs and amplitude of ensemble but not miniature GABAA receptor-mediated currents suggest that the collective rather than the individual strength of GPe–STN synapses is increased following the loss of dopamine.
Figure 3.

Chronic dopamine depletion increased the conductance evoked by the GABAA receptor agonist isoguvacine. A, Representative traces of isoguvacine-evoked currents in STN neurons derived from control and 6-OHDA-treated animals. B, The conductance evoked by isoguvacine was significantly increased by chronic dopamine depletion. *p < 0.05.
To address molecular mechanisms underlying the enhancement of GPe–STN transmission by chronic dopamine depletion, the relative abundance of mRNA transcripts encoding the most commonly expressed GABAA receptor subunits in the STN (Wisden et al., 1992) were compared using quantitative PCR analysis. Data are expressed as the fold change relative to median control values. Dopamine depletion significantly elevated the level of each transcript (Fig. 4; α1: control = 1.04 ± 0.21, n = 15; 6-OHDA = 1.20 ± 0.12, n = 12, p < 0.05; β2: control = 1.02 ± 0.21, n = 15; 6-OHDA = 1.34 ± 0.22, n = 12, p < 0.05; γ2: control = 1.05 ± 0.178, n = 15; 6-OHDA = 1.24 ± 0.15, n = 12, p < 0.05). In contrast, the less abundantly expressed α3 subunit (Wisden et al., 1992), which is associated with relatively slow GABAA receptor-mediated IPSCs in neurons (Eyre et al., 2012), was unchanged following dopamine depletion (α3: control = 1.02 ± 0.18, n = 15; 6-OHDA = 1.14 ± 0.19, n = 12, NS). Together, these data suggest that GPe–STN transmission is enhanced, at least in part, through persistent increases in the transcription of genes encoding the usually expressed GABAA receptor subunits.
Figure 4.

Chronic dopamine depletion increased the transcription of genes encoding commonly expressed GABAA receptor subunits. Quantitative PCR of the STN derived from control and 6-OHDA-lesioned animals revealed that the abundance of mRNA encoding GABAA α1, β2, and γ2 receptor subunits was significantly increased by chronic dopamine depletion. *p < 0.05.
To further address the molecular (and structural) mechanisms contributing to the enhancement of GPe–STN transmission by chronic dopamine depletion, the density of postsynaptic structures expressing gephyrin and both gephyrin and γ2 GABAA receptor subunits and the density of presynaptic structures expressing vGAT and bassoon were estimated stereologically using immunofluorescent confocal microscopy. The inhibitory postsynaptic scaffold protein gephyrin and γ2 GABAA receptor subunits are critical for the clustering and retention of functional GABAA receptors at many GABAergic synapses (Smith and Kittler, 2010; Tyagarajan and Fritschy, 2010; Luscher et al., 2011), whereas vGAT is a transporter responsible for the concentration of GABA in synaptic vesicles (McIntire et al., 1997) and bassoon is an active zone protein at both inhibitory and excitatory synapses (tom Dieck et al., 1998; Micheva et al., 2010). Dopamine depletion significantly increased the density of immunoreactive structures expressing gephyrin and both gephyrin and γ2 GABAA receptor subunits (Fig. 5; gephyrin: control = 59.78 ± 22.40 million mm−3, n = 14; 6-OHDA = 80.92 ± 24.65 million mm−3, n = 15, p < 0.05; gephyrin plus γ2: control = 50.90 ± 22.80 million mm−3, n = 14; 6-OHDA = 72.78 ± 22.58 million mm−3, n = 15, p < 0.05) but had no effect on the absolute or relative densities of presynaptic structures expressing vGAT or both vGAT and bassoon (Fig. 6; vGAT: control = 65.46 ± 7.12 million mm−3, n = 16; 6-OHDA = 68.47 ± 10.53 million mm−3, n = 16, NS; vGAT plus bassoon: control = 44.53 ± 19.57 million mm−3; 6-OHDA = 47.15 ± 17.8 million mm−3, n = 16, NS). The densities of presynaptic and postsynaptic markers in control animals were similar to the density of GPe–STN synapses (∼50 million mm−3) estimated by an earlier stereological study, which used ultrastructural and neurochemical criteria (Baufreton et al., 2009). Thus, these immunocytochemical markers appear to represent reasonably faithful markers of GPe–STN synapses.
Figure 5.
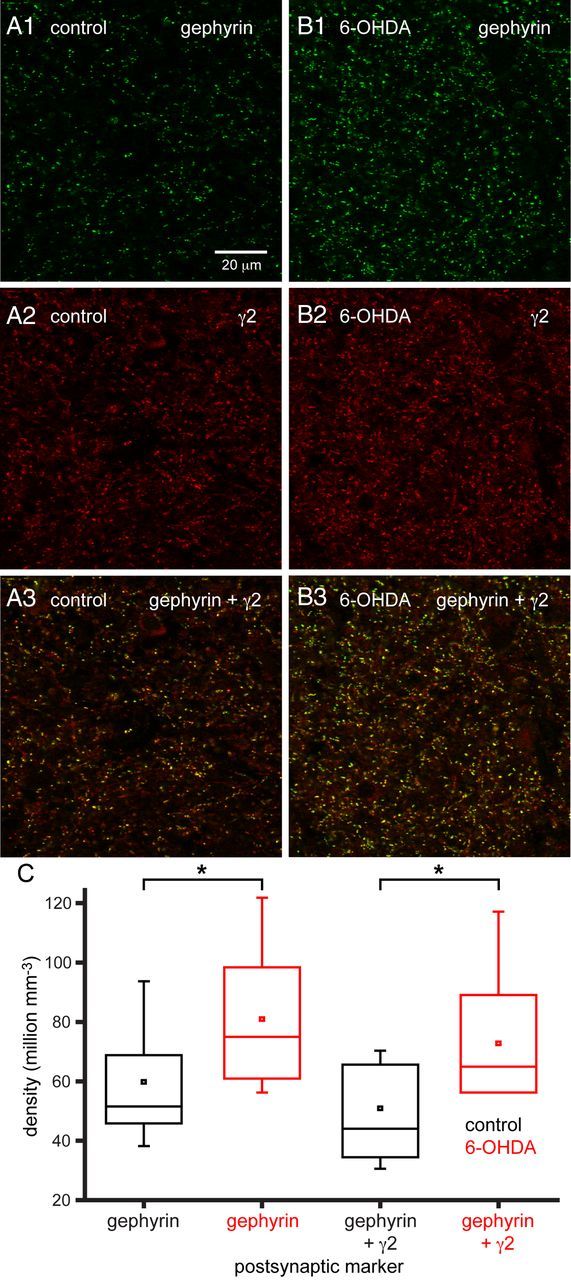
Chronic dopamine depletion increased the densities of postsynaptic gephyrin-immunoreactive and γ2 GABAA receptor subunit-immunoreactive structures. A1–B3, Representative confocal micrographs of gephyrin (A1, B1: green), γ2 GABAA receptor subunit (A2, B2: red), and gephyrin plus γ2 GABAA receptor subunit immunoreactivity (A3, B3: yellow) in the STN of a control (A) and 6-OHDA-treated (B) animal. The densities of immunoreactive structures in the STN were increased by chronic dopamine depletion compared with control both in representative micrographs (A, B) and across the sample population (C). The scale bar in A1 applies to each micrograph. *p < 0.05.
Figure 6.
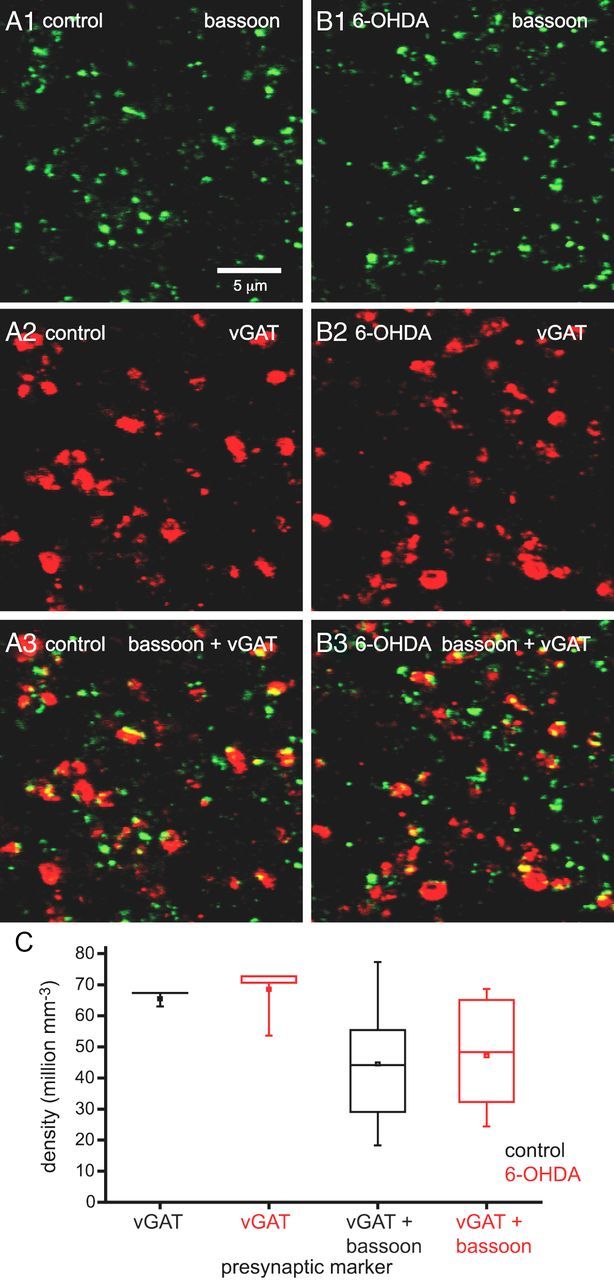
Chronic dopamine depletion did not alter the densities of presynaptic vGAT- and bassoon-immunoreactive structures. A1–B3, Representative confocal micrographs of bassoon (A1, B1: green), vGAT (A2, B2: red), and bassoon plus vGAT immunoreactivity (A3, B3: yellow) in the STN of a control (A) and 6-OHDA-depleted (B) animal. The densities of immunoreactive structures in the STN were not altered by chronic dopamine depletion compared with control in the representative micrographs (A, B) or across the sample population (C). The scale bar in A1 applies to each micrograph. *p < 0.05.
The fluorescence intensity and dimensions of gephyrin-, γ2-, vGAT-, and bassoon-immunoreactive structures were unaltered by dopamine depletion (data not shown). Together, these data indicate that the density of postsynaptic markers is increased by chronic dopamine depletion, but this is not matched by an increased density of axon terminals. Therefore, one possibility is that the number of synapses per GPe–STN axon terminal increases following dopamine depletion. However, the number of bassoon-immunoreactive structures per vGAT-immunoreactive terminal was also apparently unaltered by dopamine depletion (control = 1.29 ± 0.56, n = 108; 6-OHDA = 1.39 ± 0.64, n = 105, NS). Given the resolution limit of standard confocal microscopy, it is likely that distinct bassoon-immunoreactive structures were not fully resolved. To mitigate this confound, further analysis was restricted to large vGAT-immunoreactive structures >0.5 μm2 in their maximal cross-sectional area. In large vGAT-immunoreactive axon terminals, the number of bassoon-immunoreactive structures per terminal was found to be significantly greater in dopamine-depleted tissue (Fig. 7; control = 1.56 ± 0.71, n = 48; 6-OHDA = 2.0 ± 0.70, n = 34, p < 0.05), suggesting that the number of synapses per GPe–STN axon terminal does indeed increase following loss of dopamine.
Figure 7.

Chronic dopamine depletion increased the number of bassoon-immunoreactive structures associated with large vGAT-immunoreactive axon terminals. A–F, Representative through-focus confocal micrographs of bassoon (green) and vGAT (red) coimmunoreactive (yellow) axon terminals in the STN of control (A–C) and 6-OHDA-lesioned (D–F) animals. Three examples (A–C and D–F) per condition are illustrated. G, The number of bassoon-immunoreactive structures per vGAT-immunoreactive axon terminal (arrows) was significantly increased by chronic dopamine depletion compared with control both in the representative examples and across the sample population. The scale bar in A applies to each micrograph. *p < 0.05.
To investigate the anatomical basis for augmented GPe–STN synaptic transmission, the ultrastructural properties of vGAT-immunoreactive structures were analyzed through electron microscopy. vGAT-immunoreactive structures were identified by the presence of an electron-dense DAB reaction product, which adhered to the cytoplasmic face of the membrane of organelles including synaptic vesicles and mitochondria (Fig. 8). The cross-sectional area of vGAT-immunoreactive axon terminals in the STN of control and dopamine-depleted animals were similar (Fig. 8; control = 0.76 ± 0.54 μm2, n = 63; 6-OHDA = 0.64 ± 0.34 μm2, n = 61, NS) as were the diameter of postsynaptic dendrites (Fig. 8; control = 0.83 ± 0.63 μm, n = 28; 6-OHDA = 0.81 ± 0.43 μm, n = 43, NS) and the proportion of STN somata postsynaptic to vGAT-immunoreactive axon terminals (Fig. 8; control = 12.5%, 4 of 32 postsynaptic structures; 6-OHDA = 14%, 7 of 50 postsynaptic structures). The synaptic contacts of vGAT-immunoreactive axon terminals were invariably symmetric and were therefore assumed to arise from the GPe (Smith et al., 1998; Baufreton et al., 2009). Although the dimensions of GPe–STN synapses were unaltered by dopamine depletion (Fig. 8; length of synapses: control = 180 ± 65 nm, n = 41; 6-OHDA = 180 ± 67 nm, n = 78), the number of symmetric synapses per GPe–STN axon terminal was significantly greater in dopamine-depleted tissue (Fig. 8; number of synapses per terminal: control = 0.63 ± 0.75, n = 63; 6-OHDA = 1.26 ± 0.98, n = 61, p < 0.05). Together with our electrophysiological and molecular data, our findings suggest that chronic dopamine depletion enhances GPe–STN transmission through an increase in the number of GPe–STN synaptic connections. Furthermore, the enhancement in GPe–STN synaptic connectivity is mediated, at least in part, through an increase in the number of synapses per GPe–STN axon terminal.
Figure 8.

Chronic dopamine depletion increased the number synapses per vGAT-immunoreactive axon terminal. A–F, Representative electron micrographs of vGAT-immunoreactive axon terminals in the STN of control (A–C) and 6-OHDA-lesioned (D–F) animals. vGAT-immunoreactive axon terminals were characterized by the presence of flocculent, electron-dense DAB reaction product, which adhered to intracellular organelles, particularly vesicles. Three examples per condition are illustrated (A–C and D–F). vGAT-immunoreactive structures formed synapses (black arrows) with the dendrites (d) and somata (s) of STN neurons. Vesicles associated with each synapse are also indicated (white arrows). In some cases, vGAT-immunoreactive structures did not form a synaptic connection in the ultrathin section that was examined (A). Although the dimensions of vGAT-immunoreactive structures, synaptic targets, and synapses were similar in control and dopamine-depleted animals, individual vGAT-immunoreactive axon terminals formed significantly more synapses in dopamine-depleted animals (A–G). Scale bar in A applies to each micrograph. *p < 0.05.
Discussion
We demonstrate through a variety of experimental approaches that loss of midbrain dopamine neurons leads to a substantial increase in the synaptic strength of the GPe–STN projection. Our data are therefore concordant with studies that reported increased GABAA receptor current and binding in the STN ipsilateral to dopamine depletion relative to the STN in the intact hemisphere (Yu et al., 2001; Shen and Johnson, 2005) and in vivo electrophysiological studies that imply that the functional connectivity between the GPe and STN is strengthened by dopamine depletion (Mallet at al., 2008b; Cruz et al., 2011; Moran et al., 2011). In this study, we present convergent but independent lines of evidence, which support the conclusion that following loss of dopamine the STN–GPe projection is strengthened through an increase in the number of GPe–STN synapses per axon terminal. The electrophysiological data demonstrated the following: (1) the frequency but not the amplitude of mIPSCs increased; (2) the amplitude of evoked IPSCs increased with no alteration in short-term synaptic plasticity; and (3) current evoked by application of an exogenous GABAA receptor agonist increased. Thus, strengthening was mediated by an increase in GPe–STN synaptic connections with properties similar to those in control tissue. Quantitative PCR data demonstrated that transcription of usually expressed GABAA receptor subunits also increased, presumably to supply the newly formed synapses with receptors. Immunocytochemical data revealed that the densities of presynaptic and postsynaptic markers were elevated but the density of GABAergic axon terminals was unaltered, implying an increased number of synapses per GPe–STN axon terminal. Finally, electron microscopy confirmed that the number of synapses per GPe–STN axon terminal increased with no alteration in the dimensions of GPe–STN terminals, their individual synapses, or their postsynaptic target preference. The correspondence of the datasets both in terms of magnitude and mechanism is compelling. For example, the frequency but not the amplitude of mIPSCs increased, which is concordant with both the increased density but not intensity of immunocytochemically visualized synaptic markers and the increase in the number but not the size of synapses per GPe–STN axon terminal at the electron microscopic level (Nusser et al., 1997).
Regulation of GPe–STN synaptic transmission through dynamic modification of GPe–STN connectivity may represent a homeostatic process for fine tuning GPe–STN interactions. This process may be recruited excessively by profound alterations in presynaptic and postsynaptic activity, which follow the loss of dopamine. However, strengthening the GPe–STN projection, aside from restricting hyperactivity of the parkinsonian STN, may also increase the capability of the GPe to generate synchronous, rhythmic burst firing in the STN and in that respect be maladaptive. Indeed, ex vivo and in vivo electrophysiological studies (Baufreton et al., 2005, 2009; Hallworth and Bevan, 2005; Mallet et al., 2008b; Tachibana et al., 2011) and computational modeling (Holgado et al., 2010; Moran et al., 2011) suggest that strengthening the GPe–STN projection will enhance the capability of the GPe (and cortical inputs) to synchronize STN neurons and generate rhythmic burst firing. Furthermore, in the nonhuman primate model of PD, silencing the GPe with muscimol abolished hypersynchronous rhythmic burst firing in the STN (Tachibana et al., 2011), which implies a pivotal role for GPe–STN synaptic transmission in the manifestation of parkinsonian STN activity.
Together with synaptic adaptations in D2-MSNs (Day et al., 2006; Gittis et al., 2011), reductions in the autonomous activity of STN neurons (Zhu et al., 2002; Wilson et al., 2006) and downregulation of HCN channels in GPe neurons (Chan et al., 2011), this study suggests that loss of dopamine leads to adaptations in elements of the indirect pathway. In idiopathic PD, it is possible that such adaptations are initially homeostatic and delay the symptomatic expression of the disease until the scale of neurodegeneration and resulting adaptation is sufficiently severe that abnormal activity such as hypersynchronous firing is generated. Thus, in the basal ganglia and other brain regions intrinsic cellular and synaptic plasticity mechanisms may ultimately contribute to rather than ameliorate brain dysfunction if the scale of neuronal degeneration or disruption is sufficiently extreme (Zhu et al., 2002; Day et al., 2006; Wilson et al., 2006; Chan et al., 2011; Gittis et al., 2011; Lewis and Chetkovich, 2011).
The processes that regulate the strength of GPe–STN synaptic transmission both under normal conditions and following the loss of dopamine are unknown. However, intracellular Ca2+ is likely to be key due to its influence on protein kinases and phosphatases, which in turn regulate the translation, exocytosis, endocytosis, recycling, degradation, and molecular interactions of synaptic receptors and associated molecules. In cortical pyramidal neurons, the strength of GABAergic connections is regulated bidirectionally through activity pattern-dependent activation of postsynaptic Cav2.3 and Cav1 channels (Kurotani et al., 2008). Activation of Cav1 channels can also enhance the strength of GPe–STN synaptic transmission, but this effect is mediated through increased extrusion of intracellular Cl− (Wang et al., 2006) and cannot therefore account for (but could augment) the plasticity described here. Another potential source of postsynaptic Ca2+ is the NMDA receptor, which triggers an increase in the number and/or strength of some GABAergic synapses (Ouardouz and Sastry, 2000; Marsden et al., 2007). Hyperactivity of STN neurons and increased patterning by cortical inputs (Mallet et al., 2008b; Wichmann et al., 2011) suggest that activation of both STN Cav channels and NMDA receptors will be greatly enhanced in the parkinsonian STN.
The plasticity we describe here is presumably mediated, in part, through activation of transcription factors (e.g., CREB and c-fos), which upregulate sufficient gene expression for the construction and maintenance of additional GPe–STN synapses. Indeed, quantitative PCR confirmed that transcription of GABAA receptor subunits increased following loss of dopamine. Altered trafficking may also contribute to plasticity because NMDA receptor stimulation leads to activation of GABA receptor accessory protein and N-ethylmaleimide-sensitive factor, which chaperone and position GABAA receptors in preparation for exocytosis (Marsden et al., 2007). Indeed, exocytosis of GABAA receptors rather than alterations in recycling is required for the potentiation of GABAergic synaptic transmission (Ouardouz and Sastry, 2000; Marsden et al., 2007; Kurotani et al., 2008).
Following export to the cell surface, the mechanisms responsible for the positioning of GABAA receptors and associated molecules at synapses are complex and connection specific. Tethering of GABAA receptors at synapses is often dependent on their interaction with the scaffolding protein gephyrin, whose positioning is in turn regulated by cell adhesion molecules such as neuroligin 2 and regulatory proteins like collybistin (Smith and Kittler, 2010; Tyagarajan and Fritschy, 2010; Luscher et al., 2011; Papadopoulos and Soykan, 2011). Indeed, the dynamic expression pattern of gephyrin and γ2 GABAA receptors in the STN argues that gephyrin is critical for both GPe–STN synaptic transmission and plasticity.
GPe–STN axon terminals are large (Smith et al., 1998; Baufreton et al., 2009) and thus provide readily available sites for the addition of synapses in the absence of axonal sprouting. Thus, the prolonged decay time course of mIPSCs following loss of dopamine may reflect cross-activation of receptors at neighboring synapses rather than de novo expression of slowly gating GABAA receptor subunits. The processes that mediate coordinated remodeling of GABAergic presynaptic and postsynaptic machinery are poorly understood, but presynaptic alterations accompany and often precede postsynaptic changes (Dobie and Craig, 2011). Therefore, retrograde messaging and cell-to-cell molecular interactions are likely to be critical for coordinated regulation of the presynaptic and postsynaptic elements of GPe–STN synapses both under normal conditions and in disease states.
Footnotes
This research was supported by National Institutes of Health–National Institute of Neurological Disorders and Stroke Grants R37NS041280 (M.D.B.), P50NS040705 (M.D.B., D.J.S.) and R01NS069777 (C.S.C.), the Parkinson's Disease Foundation (PDF-IRG-1101; M.D.B.), La Fondation de France (J.B.), L'Agence Nationale de la Recherche Grant ANR08-JCJC-0087 (J.B.), and a University of Sheffield Prize studentship (K.Y.F.). We also acknowledge the technical support of Erin Kirkham, Patrick Hackler, Stéphanie Morin, and Aude Retailleau, and the expertise and resources of Northwestern University's Cell Imaging Facility.
References
- Andersen CL, Jensen JL, Ørntoft TF. Normalization of real-time quantitative reverse transcription-PCR data: a model-based variance estimation approach to identify genes suited for normalization, applied to bladder and colon cancer data sets. Cancer Res. 2004;64:5245–5250. doi: 10.1158/0008-5472.CAN-04-0496. [DOI] [PubMed] [Google Scholar]
- Atherton JF, Kitano K, Baufreton J, Fan K, Wokosin D, Tkatch T, Shigemoto R, Surmeier DJ, Bevan MD. Selective participation of somatodendritic HCN channels in inhibitory but not excitatory synaptic integration in neurons of the subthalamic nucleus. J Neurosci. 2010;30:16025–16040. doi: 10.1523/JNEUROSCI.3898-10.2010. [DOI] [PMC free article] [PubMed] [Google Scholar]
- Baufreton J, Bevan MD. D2-like dopamine receptor-mediated modulation of activity-dependent plasticity at GABAergic synapses in the subthalamic nucleus. J Physiol. 2008;586:2121–2142. doi: 10.1113/jphysiol.2008.151118. [DOI] [PMC free article] [PubMed] [Google Scholar]
- Baufreton J, Atherton JF, Surmeier DJ, Bevan MD. Enhancement of excitatory synaptic integration by GABAergic inhibition in the subthalamic nucleus. J Neurosci. 2005;25:8505–8517. doi: 10.1523/JNEUROSCI.1163-05.2005. [DOI] [PMC free article] [PubMed] [Google Scholar]
- Baufreton J, Kirkham E, Atherton JF, Menard A, Magill PJ, Bolam JP, Bevan MD. Sparse but selective and potent synaptic transmission from the globus pallidus to the subthalamic nucleus. J Neurophysiol. 2009;102:532–545. doi: 10.1152/jn.00305.2009. [DOI] [PMC free article] [PubMed] [Google Scholar]
- Benabid AL, Chabardes S, Torres N, Piallat B, Krack P, Fraix V, Pollak P. Functional neurosurgery for movement disorders: a historical perspective. Prog Brain Res. 2009;175:379–391. doi: 10.1016/S0079-6123(09)17525-8. [DOI] [PubMed] [Google Scholar]
- Bevan MD, Magill PJ, Hallworth NE, Bolam JP, Wilson CJ. Regulation of the timing and pattern of action potential generation in rat subthalamic neurons in vitro by GABA-A IPSPs. J Neurophysiol. 2002;87:1348–1362. doi: 10.1152/jn.00582.2001. [DOI] [PubMed] [Google Scholar]
- Chan CS, Glajch KE, Gertler TS, Guzman JN, Mercer JN, Lewis AS, Goldberg AB, Tkatch T, Shigemoto R, Fleming SM, Chetkovich DM, Osten P, Kita H, Surmeier DJ. HCN channelopathy in external globus pallidus neurons in models of Parkinson's disease. Nat Neurosci. 2011;14:85–92. doi: 10.1038/nn.2692. [DOI] [PMC free article] [PubMed] [Google Scholar]
- Chan CS, Peterson JD, Gertler TS, Glajch KE, Quintana RE, Cui Q, Sebel LE, Plotkin JL, Shen W, Heiman M, Heintz N, Greengard P, Surmeier DJ. Strain-Specific Regulation of Striatal Phenotype in Drd2-eGFP BAC Transgenic Mice. J Neurosci. 2012;32:9124–9132. doi: 10.1523/JNEUROSCI.0229-12.2012. [DOI] [PMC free article] [PubMed] [Google Scholar]
- Cruz AV, Mallet N, Magill PJ, Brown P, Averbeck BB. Effects of dopamine depletion on information flow between the subthalamic nucleus and external globus pallidus. J Neurophysiol. 2011;106:2012–2023. doi: 10.1152/jn.00094.2011. [DOI] [PMC free article] [PubMed] [Google Scholar]
- Day M, Wang Z, Ding J, An X, Ingham CA, Shering AF, Wokosin D, Ilijic E, Sun Z, Sampson AR, Mugnaini E, Deutch AY, Sesack SR, Arbuthnott GW, Surmeier DJ. Selective elimination of glutamatergic synapses on striatopallidal neurons in Parkinson disease models. Nat Neurosci. 2006;9:251–259. doi: 10.1038/nn1632. [DOI] [PubMed] [Google Scholar]
- Dobie FA, Craig AM. Inhibitory synapse dynamics: coordinated presynaptic and postsynaptic mobility and the major contribution of recycled vesicles to new synapse formation. J Neurosci. 2011;31:10481–10493. doi: 10.1523/JNEUROSCI.6023-10.2011. [DOI] [PMC free article] [PubMed] [Google Scholar]
- Eyre MD, Renzi M, Farrant M, Nusser Z. Setting the time course of inhibitory synaptic currents by mixing multiple GABA(A) receptor α subunit isoforms. J Neurosci. 2012;32:5853–5867. doi: 10.1523/JNEUROSCI.6495-11.2012. [DOI] [PMC free article] [PubMed] [Google Scholar]
- Galati S, Stanzione P, D'Angelo V, Fedele E, Marzetti F, Sancesario G, Procopio T, Stefani A. The pharmacological blockade of medial forebrain bundle induces an acute pathological synchronization of the cortico-subthalamic nucleus-globus pallidus pathway. J Physiol. 2009;587:4405–4423. doi: 10.1113/jphysiol.2009.172759. [DOI] [PMC free article] [PubMed] [Google Scholar]
- Gerfen CR, Surmeier DJ. Modulation of striatal projection systems by dopamine. Annu Rev Neurosci. 2011;34:441–466. doi: 10.1146/annurev-neuro-061010-113641. [DOI] [PMC free article] [PubMed] [Google Scholar]
- Gittis AH, Hang GB, LaDow ES, Shoenfeld LR, Atallah BV, Finkbeiner S, Kreitzer AC. Rapid target-specific remodeling of fast-spiking inhibitory circuits after loss of dopamine. Neuron. 2011;71:858–868. doi: 10.1016/j.neuron.2011.06.035. [DOI] [PMC free article] [PubMed] [Google Scholar]
- Hallworth NE, Bevan MD. Globus pallidus neurons dynamically regulate the activity pattern of subthalamic nucleus neurons through the frequency-dependent activation of postsynaptic GABAA and GABAB receptors. J Neurosci. 2005;25:6304–6315. doi: 10.1523/JNEUROSCI.0450-05.2005. [DOI] [PMC free article] [PubMed] [Google Scholar]
- Holgado AJ, Terry JR, Bogacz R. Conditions for the generation of beta oscillations in the subthalamic nucleus-globus pallidus network. J Neurosci. 2010;30:12340–12352. doi: 10.1523/JNEUROSCI.0817-10.2010. [DOI] [PMC free article] [PubMed] [Google Scholar]
- Jenkinson N, Brown P. New insights into the relationship between dopamine, beta oscillations and motor function. Trends Neurosci. 2011;34:611–618. doi: 10.1016/j.tins.2011.09.003. [DOI] [PubMed] [Google Scholar]
- Kurotani T, Yamada K, Yoshimura Y, Crair MC, Komatsu Y. State-dependent bidirectional modification of somatic inhibition in neocortical pyramidal cells. Neuron. 2008;57:905–916. doi: 10.1016/j.neuron.2008.01.030. [DOI] [PMC free article] [PubMed] [Google Scholar]
- Lewis AS, Chetkovich DM. HCN channels in behavior and neurological disease: too hyper or not active enough? Mol Cell Neurosci. 2011;46:357–367. doi: 10.1016/j.mcn.2010.11.007. [DOI] [PMC free article] [PubMed] [Google Scholar]
- Luscher B, Fuchs T, Kilpatrick CL. GABAA receptor trafficking-mediated plasticity of inhibitory synapses. Neuron. 2011;70:385–409. doi: 10.1016/j.neuron.2011.03.024. [DOI] [PMC free article] [PubMed] [Google Scholar]
- Mallet N, Pogosyan A, Sharott A, Csicsvari J, Bolam JP, Brown P, Magill PJ. Disrupted dopamine transmission and the emergence of exaggerated beta oscillations in subthalamic nucleus and cerebral cortex. J Neurosci. 2008a;28:4795–4806. doi: 10.1523/JNEUROSCI.0123-08.2008. [DOI] [PMC free article] [PubMed] [Google Scholar]
- Mallet N, Pogosyan A, Márton LF, Bolam JP, Brown P, Magill PJ. Parkinsonian beta oscillations in the external globus pallidus and their relationship with subthalamic nucleus activity. J Neurosci. 2008b;28:14245–14258. doi: 10.1523/JNEUROSCI.4199-08.2008. [DOI] [PMC free article] [PubMed] [Google Scholar]
- Marsden KC, Beattie JB, Friedenthal J, Carroll RC. NMDA receptor activation potentiates inhibitory transmission through GABA receptor-associated protein-dependent exocytosis of GABAA receptors. J Neurosci. 2007;27:14326–14337. doi: 10.1523/JNEUROSCI.4433-07.2007. [DOI] [PMC free article] [PubMed] [Google Scholar]
- McIntire SL, Reimer RJ, Schuske K, Edwards RH, Jorgensen EM. Identification and characterization of the vesicular GABA transporter. Nature. 1997;389:870–876. doi: 10.1038/39908. [DOI] [PubMed] [Google Scholar]
- Micheva KD, Busse B, Weiler NC, O'Rourke N, Smith SJ. Single-synapse analysis of a diverse synapse population: proteomic imaging methods and markers. Neuron. 2010;68:639–653. doi: 10.1016/j.neuron.2010.09.024. [DOI] [PMC free article] [PubMed] [Google Scholar]
- Moran RJ, Mallet N, Litvak V, Dolan RJ, Magill PJ, Friston KJ, Brown P. Alterations in brain connectivity underlying beta oscillations in parkinsonism. PLoS Comput Biol. 2011;7:e1002124. doi: 10.1371/journal.pcbi.1002124. [DOI] [PMC free article] [PubMed] [Google Scholar]
- Nusser Z, Cull-Candy S, Farrant M. Differences in synaptic GABA(A) receptor number underlie variation in GABA mini amplitude. Neuron. 1997;19:697–709. doi: 10.1016/s0896-6273(00)80382-7. [DOI] [PubMed] [Google Scholar]
- Ouardouz M, Sastry BR. Mechanisms underlying LTP of inhibitory synaptic transmission in the deep cerebellar nuclei. J Neurophysiol. 2000;84:1414–1421. doi: 10.1152/jn.2000.84.3.1414. [DOI] [PubMed] [Google Scholar]
- Papadopoulos T, Soykan T. The role of collybistin in gephyrin clustering at inhibitory synapses: facts and open questions. Front Cell Neurosci. 2011;5:11. doi: 10.3389/fncel.2011.00011. [DOI] [PMC free article] [PubMed] [Google Scholar]
- Pfaffl MW, Tichopad A, Prgomet C, Neuvians TP. Determination of stabhousekeeping genes, differentially regulated target genes and sample integrity: BestKeeper—Excel-based tool using pair-wise correlations. Biotechnol Lett. 2004;26:509–515. doi: 10.1023/b:bile.0000019559.84305.47. [DOI] [PubMed] [Google Scholar]
- Schallert T, Fleming SM, Leasure JL, Tillerson JL, Bland ST. CNS plasticity and assessment of forelimb sensorimotor outcome in unilateral rat models of stroke, cortical ablation, parkinsonism and spinal cord injury. Neuropharmacology. 2000;39:777–787. doi: 10.1016/s0028-3908(00)00005-8. [DOI] [PubMed] [Google Scholar]
- Shen KZ, Johnson SW. Presynaptic dopamine D2 and muscarine M3 receptors inhibit excitatory and inhibitory transmission to rat subthalamic neurones in vitro. J Physiol. 2000;525:331–341. doi: 10.1111/j.1469-7793.2000.00331.x. [DOI] [PMC free article] [PubMed] [Google Scholar]
- Shen KZ, Johnson SW. Dopamine depletion alters responses to glutamate and GABA in the rat subthalamic nucleus. Neuroreport. 2005;16:171–174. doi: 10.1097/00001756-200502080-00021. [DOI] [PubMed] [Google Scholar]
- Silver N, Best S, Jiang J, Thein SL. Selection of housekeeping genes for gene expression studies in human reticulocytes using real-time PCR. BMC Mol Biol. 2006;7:33. doi: 10.1186/1471-2199-7-33. [DOI] [PMC free article] [PubMed] [Google Scholar]
- Smith KR, Kittler JT. The cell biology of synaptic inhibition in health and disease. Curr Opin Neurobiol. 2010;20:550–556. doi: 10.1016/j.conb.2010.06.001. [DOI] [PubMed] [Google Scholar]
- Smith Y, Bevan MD, Shink E, Bolam JP. Microcircuitry of the direct and indirect pathways of the basal ganglia. Neuroscience. 1998;86:353–387. doi: 10.1016/s0306-4522(98)00004-9. [DOI] [PubMed] [Google Scholar]
- Tachibana Y, Iwamuro H, Kita H, Takada M, Nambu A. Subthalamo-pallidal interactions underlying parkinsonian neuronal oscillations in the primate basal ganglia. Eur J Neurosci. 2011;34:1470–1484. doi: 10.1111/j.1460-9568.2011.07865.x. [DOI] [PubMed] [Google Scholar]
- tom Dieck S, Sanmartí-Vila L, Langnaese K, Richter K, Kindler S, Soyke A, Wex H, Smalla KH, Kämpf U, Fränzer JT, Stumm M, Garner CC, Gundelfinger ED. Bassoon, a novel zinc-finger CAG/glutamine-repeat protein selectively localized at the active zone of presynaptic nerve terminals. J Cell Biol. 1998;142:499–509. doi: 10.1083/jcb.142.2.499. [DOI] [PMC free article] [PubMed] [Google Scholar]
- Tyagarajan SK, Fritschy JM. GABAA receptors, gephyrin and homeostatic synaptic plasticity. J Physiol. 2010;588:101–106. doi: 10.1113/jphysiol.2009.178517. [DOI] [PMC free article] [PubMed] [Google Scholar]
- Vandesompele J, De Preter K, Pattyn F, Poppe B, Van Roy N, De Paepe A, Speleman F. Accurate normalization of real-time quantitative RT-PCR data by geometric averaging of multiple internal control genes. Genome Biol. 2002;3:RESEARCH0034. doi: 10.1186/gb-2002-3-7-research0034. [DOI] [PMC free article] [PubMed] [Google Scholar]
- Vila M, Périer C, Féger J, Yelnik J, Faucheux B, Ruberg M, Raisman-Vozari R, Agid Y, Hirsch EC. Evolution of changes in neuronal activity in the subthalamic nucleus of rats with unilateral lesion of the substantia nigra assessed by metabolic and electrophysiological measurements. Eur J Neurosci. 2000;12:337–344. doi: 10.1046/j.1460-9568.2000.00901.x. [DOI] [PubMed] [Google Scholar]
- Wang L, Kitai ST, Xiang Z. Activity-dependent bidirectional modification of inhibitory synaptic transmission in rat subthalamic neurons. J Neurosci. 2006;26:7321–7327. doi: 10.1523/JNEUROSCI.4656-05.2006. [DOI] [PMC free article] [PubMed] [Google Scholar]
- West MJ. Stereological methods for estimating the total number of neurons and synapses: issues of precision and bias. Trends Neurosci. 1999;22:51–61. doi: 10.1016/s0166-2236(98)01362-9. [DOI] [PubMed] [Google Scholar]
- Wichmann T, DeLong MR, Guridi J, Obeso JA. Milestones in research on the pathophysiology of Parkinson's disease. Mov Disord. 2011;26:1032–1041. doi: 10.1002/mds.23695. [DOI] [PMC free article] [PubMed] [Google Scholar]
- Wilson CL, Cash D, Galley K, Chapman H, Lacey MG, Stanford IM. Subthalamic nucleus neurones in slices from 1-methyl-4-phenyl-1,2,3,6-tetrahydropyridine-lesioned mice show irregular, dopamine-reversible firing pattern changes, but without synchronous activity. Neuroscience. 2006;143:565–572. doi: 10.1016/j.neuroscience.2006.07.051. [DOI] [PubMed] [Google Scholar]
- Wisden W, Laurie DJ, Monyer H, Seeburg PH. Distribution of 13 GABAA receptor subunit mRNAs in the brain. I. Telencephalon, diencephalon, mesencephalon. J Neurosci. 1992;12:1040–1062. doi: 10.1523/JNEUROSCI.12-03-01040.1992. [DOI] [PMC free article] [PubMed] [Google Scholar]
- Yu TS, Wang SD, Liu JC, Yin HS. Changes in the gene expression of GABA(A) receptor alpha1 and alpha2 subunits and metabotropic glutamate receptor 5 in the basal ganglia of the rats with unilateral 6-hydroxydopamine lesion and embryonic mesencephalic grafts. Exp Neurol. 2001;168:231–241. doi: 10.1006/exnr.2000.7590. [DOI] [PubMed] [Google Scholar]
- Zaidel A, Arkadir D, Israel Z, Bergman H. Akineto-rigid vs. tremor syndromes in Parkinsonism. Curr Opin Neurol. 2009;22:387–393. doi: 10.1097/WCO.0b013e32832d9d67. [DOI] [PubMed] [Google Scholar]
- Zhu Z, Bartol M, Shen K, Johnson SW. Excitatory effects of dopamine on subthalamic nucleus neurons: in vitro study of rats pretreated with 6-hydroxydopamine and levodopa. Brain Res. 2002;945:31–40. doi: 10.1016/s0006-8993(02)02543-x. [DOI] [PubMed] [Google Scholar]