

Abstract
Nerve growth cones (GCs) are chemical sensors that convert graded extracellular cues into oriented axonal motion. To ensure a sensitive and robust response to directional signals in complex and dynamic chemical landscapes, GCs are presumably able to amplify and filter external information. How these processing tasks are performed remains however poorly known. Here, we probe the signal-processing capabilities of single GCs during γ-Aminobutyric acid (GABA) directional sensing with a shear-free microfluidic assay that enables systematic measurements of the GC output response to variable input gradients. By measuring at the single molecule level the polarization of GABAA chemoreceptors at the GC membrane, as a function of the external GABA gradient, we find that GCs act as i), signal amplifiers over a narrow range of concentrations, and ii), low-pass temporal filters with a cutoff frequency independent of stimuli conditions. With computational modeling, we determine that these systems-level properties arise at a molecular level from the saturable occupancy response and the lateral dynamics of GABAA receptors.
Introduction
Growth cones (GCs), the motile tips of axons, are chemical sensors with a central role in the response of neurons to guidance cues. Addressing the GC ability to navigate through a complex landscape of guidance signals is essential to improve our understanding of neuronal development and repair (1). Although families of attractive and repulsive molecular cues have now been identified, comparatively much less is known about how individual GCs process directional information. Yet, this is a question of prime importance in the description of GCs as sensing modules. Indeed, during axonal navigation, GCs move across regions where cue gradients are changing in mean concentration, steepness, and orientation and are also potentially corrupted by noise. Hence, GCs face multiple signal processing challenges to take proper turning decisions (2,3). First, they might have to internally amplify extracellular signals to ensure the efficiency of gradient detection and adapt their response over a large range of concentrations. Second, they must be able to filter out rapid concentration fluctuations to avoid erroneous steering. It is thus an important challenge to understand how these systems-level amplifying, filtering, and adaptation tasks are performed in GCs, and how they are related to the molecular properties and organization of signaling components.
Experiments in nonneuronal eukaryotic cells have provided valuable clues on signal processing during gradient sensing. In particular, measurements have underlined how the transduction of external gradients often elicits a polarized redistribution of signaling molecules in the cell (4,5). Experiments in Dictyostelium amoebas (6), or neutrophils (7), and models (8) have further suggested that this polarity serves to amplify the detection of extracellular cues and, thereby, is a key step in the integrative response of the cell to a directional signal. Recently, studies in nerve cells have also noted the ability of GCs to asymmetrically distribute molecules or organelles (receptors, mRNAs, vesicles, lipid rafts, etc.) along the gradient axis (9–13). The polarized distribution of γ-aminobutyric acid (GABA)-A receptors (GABAARs) at the GC membrane in a GABA gradient constitutes a telling example, with a quantitative readout, of cellular reorganization in neurons. During directional sensing, i.e., the phase that precedes GC turning and elongation (3), GABAARs redistribute asymmetrically toward the gradient source in a ligand-specific manner and through a microtubule-dependent positive feedback mechanism (13,14). Furthermore, intracellular calcium imaging indicates that this polarity at the membrane is used to convert an external gradient into a steeper intracellular one (13). Altogether, these observations have supported the notion that the polarization of GABAARs at the GC membrane is associated to amplification in gradient sensing. However, in this case as in most others where gradient-induced polarity was reported, a complete view of GCs as sensing devices is still lacking. In particular, little is known about how the characteristics of the amplification process (such as its kinetics and amplitude) are related to the parameters of the input gradient, and how the systems-level behavior is connected to molecular properties of signaling elements.
Here, we went beyond our prior studies and developed a novel, to our knowledge, quantitative assay to probe the properties of GCs as integrated chemical sensors. To this end, we measured the GC polarization in response to well-defined chemical gradients and, thereby, determined the input-output relationship of the sensor (Fig. 1). A requirement in such experiments is the precise spatial and temporal control of the chemical stimulation, a goal that cannot be easily achieved with standard pipette assays. Microfluidic devices have recently emerged as powerful tools to tailor the chemical environment at the micron scale (15). Yet, applications of microfluidics to neuron guidance are still challenging primarily due to the sensitivity of neuronal cells to shear forces in microcircuits. The presence of continuous flows inevitably leads to shear stress on the cells (Fig. S1 in the Supporting Material), which can affect cell morphology, trigger signaling cascades susceptible to interfere with the chemotropic response, or even induce cell death. A few groups have developed specific devices to stimulate neurons in low-flow conditions (16–18), and these pioneering studies have shown how microfluidics could be fruitfully used to examine complex processes of axonal guidance. However, in most cases, these devices require culturing neurons in closed microchannels for several days before experiments, adding complexity to culture protocols and making difficult the multistep labeling used for single molecule tracking.
Figure 1.
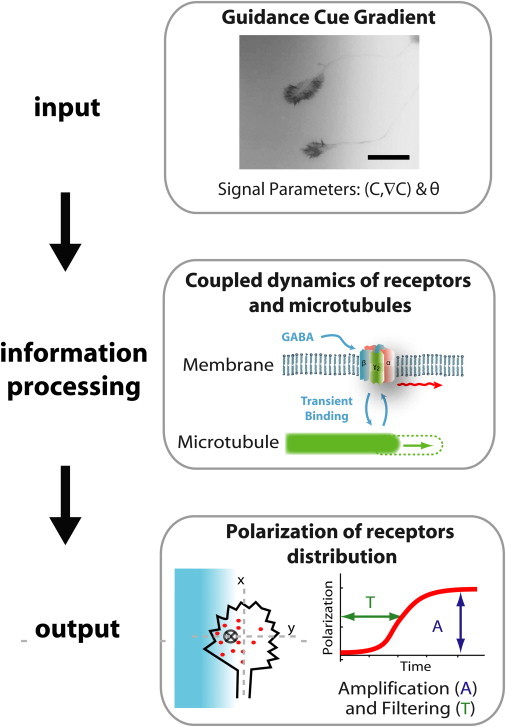
Principle of the assay: neurons are submitted to input GABA gradients with controlled mean concentration (c), steepness (∇c), and orientation (θ). Through internal processing of the directional signal, individual GCs respond by polarizing the distribution of chemoreceptors at the membrane. The polarization output, measured by the position of the receptor barycenter (cross), can be characterized by the polarization kinetics (time T) and amplitude (A). The first image corresponds to neurons transfected with the actin marker Lifeact-mCherry and placed in a fluorescein gradient (in inverted gray levels). Scale bar: 50 μm.
To overcome both the fluidic and culture constraints, we designed a microsystem based on two separate parts (Fig. 2): i), a fluidic microcircuit positioned over a membrane interface, and ii), an open microwell on a glass coverslip in which cells are plated. The two parts of the device are assembled just before the experiment. Neurons can thus be cultured and labeled using standard protocols. Upon assembly, the porous membrane acts as a hydrodynamic barrier (19) and the microfluidic circuit allows the generation of spatiotemporally controlled, yet purely diffusive, gradients in the microwell. Using our shear-free microdevice, we measured the polarized distribution of individual receptors at the GCs membrane in response to GABA gradients with well-defined mean concentration c, steepness ∇c, and orientation. By characterizing the polarization kinetics and amplitude in these variable gradients, we determined the amplification and filtering properties of nerve GCs during GABA directional sensing. With computational modeling, we further connected the GC response to properties of the chemoreceptor lateral dynamics and signaling activity. Overall, our assay provides an integrative description of GCs as chemical sensing modules, from a molecular to a systems-level.
Figure 2.
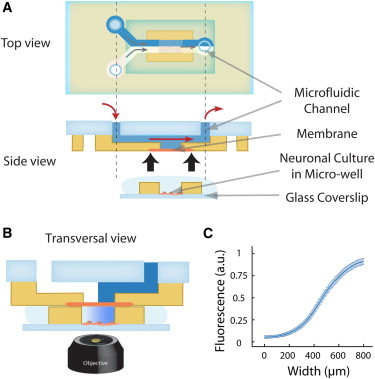
(A) Top and side schematic view of the Y-shaped microfluidic device used in the study. A fluidic microcircuit is interfaced via a porous membrane with cells cultured in a microwell. (B) Schematic sectional view of the assembled device for imaging assays. The coflow in the microcircuit generates a shear-free gradient in the microwell. (C) The concentration profile at the coverslip surface, measured by confocal microscopy and obtained by averaging profiles measured every 30 s over 1 h. The error bars indicate the standard deviation of the local concentration. The fluctuations of the relative gradient in the central part of the device are inferior to 5%.
Materials and Methods
Membrane-based device microfabrication
Membrane microdevices were prepared by an adapted soft imprint lithography technique using the ultraviolet (UV) polymerizable material NOA 81 (Norland Products, Cranbury, NJ). The fabrication process is detailed in (20). Briefly, a two-level polydimethylsiloxane (PDMS) stamp was made by PDMS replica molding of a photolithographed 80/160 μm SU-8 mold (Microchem, Newton, MA). The surface of this replica was then passivated with a perfluoro silane (Sigma, St Louis, MO), and the PDMS invert replica was made by conventional molding. A 5 × 5 mm2 membrane (Cyclopore, ∼20 μm thickness, 400 nm hole diameter, Whatman, Maidstone, United Kingdom) was aligned and pressed between this two-level PDMS stamp and a PDMS flat layer. The space in between was capillary filled with NOA81, and <250 μL of resin are sufficient to form a 25 × 50 mm2 microcircuit. When filling was complete, a uniform 365 nm illumination (Ligthningcure LC8, Hamamatsu Photonics, Hamamatsu City, Japan) for 15 s at 25 mW/cm2 through the PDMS was performed. A stiff micropatterned layer of NOA 81 with embedded membrane and channel network was obtained after PDMS removal. At the same time, a glass slide with drilled access holes (Sandblaster, Texas Airsonics, Corpus Christi, TX) and partially cured NOA 81 (365 nm, 15 s at 8 mW/cm2) was prepared. This slide was gently pressed over the previously prepared membrane-embedded layer and an additional UV illumination (15 s, 25 mW/cm2) was applied for irreversibly bonding the assembly.
Cell culture wells fabrication
Microwells were prepared by the classical UV lithography technique. Briefly, a NOA 81 droplet was deposited onto a flat PDMS surface structured with 200 μm high pillars, and a glass coverslip was placed on top to create a uniform layer. UV exposure (10 s, 8 mW/cm2) is performed across a transparency mask through the coverslip to form a 1 × 1 mm2 chamber. After exposure, the coverslip with reticulated pattern was removed from the PDMS and noncross-linked NOA 81 was rinsed, first briefly with acetone and then extensively with ethanol. A final UV exposure was performed to fully cross-link the glue. Before using them for cell culture, chambers were equilibrated into deionized water for 24 h, sterilized, and coated with adhesion proteins. They were then used with classical culture and labeling conditions.
Xenopus spinal cord explants culture
Spinal cord explants were prepared from Xenopus laevis embryos at Stage 21, using standard procedures. Microwells, coated beforehand with 200 μg/ml of poly-D-Lysine and 10 μg/ml Laminin (Sigma), were seeded with single explants in 50% L-15 Leibowitz medium (Gibco, Invitrogen, Carlsbad, CA) and 50% Ringer’s solution (115 mM NaCl, 2.5 mM KCl, 2 mM CaCl2, and 10 mM HEPES [pH 7.4]). Explants were kept at room temperature for 8 to 16 h before guidance assays. Explants were submitted to gradients of mouse netrin-1 (R&D Systems, Minneapolis, MN) supplemented with 70 MW rhodamine-labeled dextran (Invitrogen) for visualization. Control experiments were done with the rhodamine-labeled dextran only. Bright field images of growing axons were acquired every 30 s with a 40X objective. Image analysis and measurements were performed with the ImageJ software and with the Manual Tracking plug-in. The turning angle was defined as the angle between the original direction of growth and a line drawn between the initial and final positions of the growth cone. The initial direction of growth was determined by the last 10 μm segment of the neurite at the beginning of the acquisition. Only growth cones that extended >15 μm and do not connect other cells during the experiment were included in the analysis. Statistical differences were determined using the Kolmogorov-Smirnov test for turning angles, and statistical significance is defined as p < 0.05.
Rat spinal cord neurons culture
Dissociated rat neurons were prepared from spinal cord of rat embryo at E14-15, using procedures previously described (21). Drops of 50 μL of neurobasal medium with dissociated spinal cord neurons (concentration of 1.8 105 cells/ml) were deposited into a microwell preliminarily coated with 80 μg/ml of poly-D-ornithine (Sigma). After sedimentation of the neurons, neurobasal medium supplemented with B27, L-Glutamine, and antibiotics (Invitrogen) was added and the cells were grown in an incubator (37°C, 5% CO2) for 3 to 5 days before microfluidic experiments.
Single GABAAR labeling
The γ2 subunit of the GABAA receptor was specifically labeled by incubating the cells with primary antibodies raised in guinea pig (gift from J. M. Fritschy, University of Zurich, Switzerland) for 10 min, followed by an anti-guinea pig biotinylated Fab fragment (25 μg/ml, Rockland, Gilbertsville, PA) for 5 min. Neurons were then incubated for 2 min with streptavidin-coated quantum dots (QDs) (QD655, 0.5 nM; Invitrogen) in borate buffer supplemented with bovine serum albumin and sucrose (22). Antibodies labeling and microscope observations were made at 37°C in air-buffered medium (minimal essential medium without phenol red supplemented with 4 mM NaHCO3, 20 mM HEPES, 0.6 g/liter glucose, 2 mM glutamine, 1 mM sodium pyruvate, and 1× B27 supplement).
Acquisition and analysis
Labeled GCs were imaged by epifluorescence on an inverted microscope (IX 71, Olympus, Lyon, France) equipped with an oil-immersion objective (60X, N.A.=1.40; Olympus) and a charge-coupled device camera (MicroMax, Princeton Instruments, Tucson, AZ). We used a blue LED light source (pE-1, CoolLED, Andover, United Kingdom) with a 525AF45 excitation filter, a 560DRLP dichroic filter, and a 655WB20 emission filter (Omega Opticals, Brattleboro, VT). Using sequential displacements of the microscope stage (Marzhauser, Wetzlar, Germany) controlled with Metavue (Molecular Devices, St. Grégoire, France), we recorded the response (1 image every 30 s) of ∼5 GCs per experiment. Drifts in the focal plan were corrected using an objective piezo-focusing system (PIFOC Z, Physik Instrumente, Karlsruhe, Germany) and a software-based autofocus. In each image, centers of single QD spots were detected by Gaussian fitting using the MTT software (23) running under MATLAB (The MathWorks, Natick, MA). Fixed spots were removed and the position of the barycenter relative to the GC axis was computed using MATLAB. In the following, we only considered GCs with >20 diffusing labeled receptors at their membrane.
Polarization modeling
Simulations were based on a stochastic description of the coupling between the lateral dynamics of GABAARs and microtubule (MT) extension, as detailed in (14). Compared to this previous work, we also took into account the nonlinear activation response of chemoreceptors as a function of the ligand concentration. Briefly, GCs were described as a two-dimensional semicircular structure with radius L/2, containing radially oriented MTs and receptors. The model assumed that i), GABAARs respond to extracellular GABA by creating a local activation field W(c) where c is the local GABA concentration; ii), MT extension is positively regulated by the total activation, determined as the sum of the activation fields W generated by the individual receptors; and iii), diffusing GABAARs interact with MTs through a local trapping potential at the MT ends. Here, we consider that the local activation field W(c) is proportional to f(c) = ch/(ch + Kh), where h (the Hill coefficient) and K are parameters that need to be adjusted based on the experimental results and numerical simulations. The proportionality coefficient is however arbitrary because, in the model, the total activation field sensed by the MTs is normalized by its average value over the whole growth cone. In the case of a gradient with a concentration at the GC midpoint and small steepness (typically L.∇c/c much smaller than 1), this is equivalent to having receptors responding linearly to an effective extracellular gradient f′(c)∇c where f′ is the first derivative of f. All simulations were performed with 200 receptors having a diffusion coefficient D = 0.25 μm2.s−1 and 50 MTs in a gradient with relative steepness δ = 7.5 ± 0.4 10−3 μm−1. For simulations of the polarization as a function of the concentration, the gradient was oriented along the axis perpendicular to the GC axis.
Results
Shearless gradient generation for guidance assays
To investigate the dynamics of GABAAR spatial organization under a controlled gradient of guidance cues, we designed shear-free microfluidic devices that overcame the limits of conventional micropipette or flow-based microfluidic assays. We used a layer of semiporous membrane (19,20) integrated into a microfluidic device made of a biocompatible UV-polymerizable resin (24,25). Before guidance assay, this microcircuit was positioned on top of a coverslip on which neurons are cultured in an open microwell (Fig. 2 A). The membrane acts as a hydrodynamic barrier, separating the fluidic channels, where solutes are circulating, from the well where the cells are growing. The concentration profile generated in the fluidic channels is thus transferred to the cultured neurons by diffusion through the membrane and the microwell height (Fig. 2 B). The concentration profile at the coverslip can be calculated using numerical simulation of the diffusive process in the microwell (Fig. S2). We found that the membrane could be satisfyingly modeled as a semiabsorbent boundary with infinite permeability coefficient (20). This condition means that the concentration profile at the surface of the membrane in the fluidic channel is directly transferred to the membrane surface in the microwell. This approximation is consistent with the fact that, although they do not entirely cover the membrane, the pores are relatively large (400 nm) compared to chemical cues, and the membrane thickness (20 μm) is small compared to the microwell height. Given the height (200 μm) of the microwells used for neuronal culture, a small molecule like GABA (MW 101 Da) reaches a steady-state profile in a few tens of seconds, whereas it takes ∼15 min for a large guidance factor such as netrin-1 (MW 75 kDa). Because the diffusion timescales as L2/D, faster dynamics can be simply achieved by reducing the microwell height. In the following, we chose to work with a simple Y-shaped microcircuit (Fig. 2 A) to generate a gradient in the central part of the microwell. We checked the profile and stability of the steady-state gradient by running a coflow of buffer solution and fluorescein dyes (1 μM) in the microcircuit. Using confocal microscopy, we recorded the gradient profile at the coverslip surface every 30 s over 1 h and measured variations of the gradient in the central region lower than 5% (Fig. 2 C).
Thanks to their membrane-based architecture, our devices eliminate shear forces and the need to grow cells for long periods in a closed microenvironment, two culture and fluidic constraints that have largely limited the use of microfluidic systems for guidance assays in neurobiology. Their ability to trigger GC steering was demonstrated by measuring the netrin-1-induced chemorepulsion of spinal Xenopus neuronal explants on a laminin-coated surface (Fig. 3). Gradients of mouse netrin-1 (mean concentration 5 ng/ml and relative steepness ∇c/c = 7.8 10−3 μm−1 in the center of the microwell) were generated using the Y-shaped device and confirmed by adding rhodamine-labeled 70 kDa dextran to the netrin solution. Multiple growth cones (5–12) were followed during 2-h-long guidance assays. After each experiment the microcircuit was detached and stored, whereas the neurons remained available for additional assays. As expected for netrin-induced chemorepulsion on laminin substrate (26), neurons preferentially extended their axons toward the lower concentration of the netrin-1 gradient (Fig. 3 D). For growth cones submitted to netrin-1 (18 cells), we measured a turning angle θ = −19 ± 5° (mean ± SE) with an elongation speed v = 0.67 ± 0.12 μm.min−1. In comparison, control conditions with only the rhodamine-labeled dextran (17 cells) yielded a turning angle θ = 2 ± 6° with speed v = 0.74 ± 0.06 μm.min−1 (Fig. 3, B–C).
Figure 3.
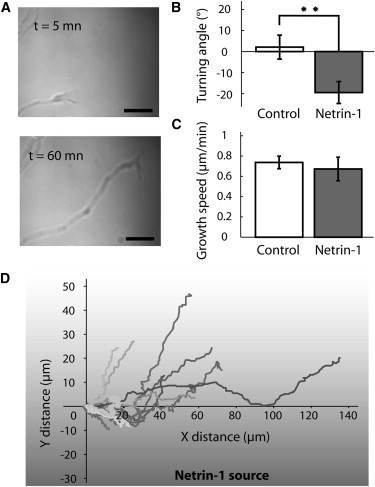
(A) Turning and elongation of an axon in the netrin-1 gradient. Scale bar: 10 μm. (B) Turning angles show a significant repulsive effect in the netrin gradient (mean ± SE = −19 ± 5°, 18 cells, gray bar) compared to control conditions using Rhodamine-labeled dextran (2 ± 6°, 17 cells, white bar). Kolmogorov-Smirnov test, p = 0.007. (C) The netrin gradient has no significant effect on the growth speed (0.67 ± 0.12 μm.min−1) compared to control conditions (0.74 ± 0.06 μm.min−1). (D) Example of trajectories of individual GCs in the Netrin-1 gradient.
Polarization of the receptors under a controlled gradient
We next applied our devices to a quantitative analysis of GABA gradient sensing in dissociated rat spinal cord neurons. Before GABA stimulation, γ2 subunits of growth cones GABAARs were sequentially labeled using a primary antibody and biotinylated secondary Fab fragments coupled to streptavidin-coated QDs (13,27). Reagent conditions were adjusted to achieve a labeling density low enough to localize individual QDs (with accuracy ∼30 nm). From the QD individual positions, we computed the mean position Y(t) of the distribution and its temporal evolution along YGC, the direction normal to the GC axis (XGC), defined as the axis of the parental axon (Fig. 4 A).
Figure 4.
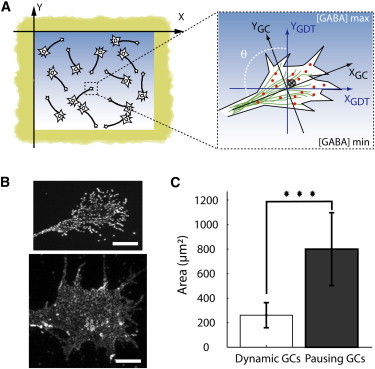
(A) Dissociated neurons plated in the microwell are stimulated with a GABA gradient. The positions of labeled GABAA receptors (dots) and their center of mass (cross) are recorded over time. (B) Maximum projection of fluorescence images of QD-labeled receptors diffusing in the membrane during the experiment and showing the shape of a thin and a large GC. Scale bar 10 μm. (C) Area of the analyzed growth cones. The differences between the two populations of neurons—pausing and dynamic growth cones—are statistically significant (p < 10−5, Kolmogorov-Smirnov test).
Following recent observations on the detection of relative rather than an absolute concentration difference by eukaryotic cells (28,29), we chose to work with an exponential concentration profile for which the relative steepness δ = ∇c/c is constant. To do so, we carefully adjusted the relative pressure between the two streams in the Y-shaped circuit to position the interface at ∼1/5 of the channel. According to numerical simulation for the diffusion coefficient of GABA, this resulted into a stable exponential gradient of GABA in the central part of the microwell (250 < y < 800 μm) with a fixed relative steepness δ = 7.5 ± 0.4 10−3 μm−1 (Fig. S3) For each measured GC, we determined the absolute GABA concentration c according to its position in the chamber (computed at the GC midpoint). GABAARs distributions were followed for 30 min under the GABA gradient. At this point, the gradient was stopped by flowing minimal essential medium instead of GABA in the microcircuit. Receptors were imaged for an additional 15 min. During the time of the experiment, no marked elongation of axons was observed.
From all the analyzed GCs (94 out of 130 neurons, obtained from six independent primary cultures), we could distinguish two populations, discriminated based on the area of the growth cone by using a threshold at 400 μm2 (Fig. 4, B–C). In the first population, identified by their large footprints (mean area ± SE = 800 ± 46 μm2, 40 neurons) and considered as pausing GCs (30), labeled GABAARs kept diffusing in the membrane throughout the experiment but no marked asymmetry in their distribution was observed compared to control condition without GABA (28 neurons from two independent cultures) (Fig. 5). For thinner GCs (mean area ± SE = 261 ± 14 μm2, 54 neurons), the mean position Y(t) reversibly shifted up gradient, indicating the formation of polarity at the cell membrane (Fig. 5). In the rest, we limit our analysis to the second population. From the polarization curve Y(t), we could extract two parameters with important functional relevance: i), the polarization amplitude A at steady state (expressed as a fraction of the GC lateral extension L), which is used as an estimator for amplification in gradient sensing; and ii), the polarization half-time T, which indicates the kinetics of the response.
Figure 5.
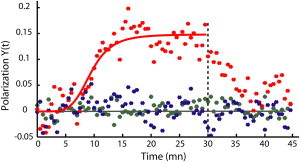
Mean position Y(t) of the labeled receptors along the YGC axis for dynamic GCs (red, 54 cells), pausing GCs (blue, 40 cells), and control conditions without GABA (green, 28 cells). After 30 min (dotted line), the gradient was switched off. The red line is an adjustment of the polarization Y(t) with the phenomenological curve Atn/(tn + Tn) (A = 0.15 ± 0.02, T = 9.2 ± 1.1 min, n taken equal to 5)(14).
We first pooled all the results, regardless of the GC orientation and of the local gradient value, and found T = 9.2 ± 1.1 min and A = 0.15 ± 0.02, in agreement with past observations (13,14). When further analyzed these parameters as a function of the angle θ between XGC and the gradient axis (∼10 GCs per point), T did not vary much (mean value ± SE = 9.1 ± 0.3 min) (Fig. 6 A). In contrast, A varied significantly with the angle and peaked around θ = 90° (Fig. 6 B). In fact, the variation of the polarization amplitude as a function of the angle could be described by a sine function (dashed line in Fig. 6 B). This suggests that the polarization response depends on the value of the effective gradient, defined as the projection of the gradient along the YGC axis.
Figure 6.
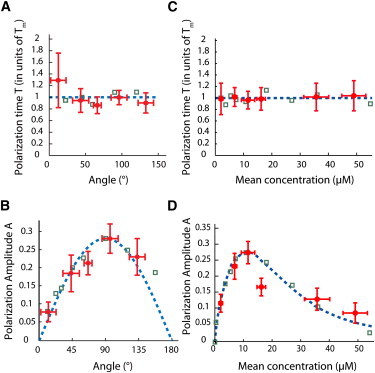
(A) Polarization time as a function of the angle θ (dots). Each point (θ = 12, 43, 67, 95, and 133°) results from a fit of data averaged over several GCs (n = 7, 12, 9, 12, and 10, respectively). In the numerical simulations (squares), the average polarization time (± SE) was min. (B) Amplitude as a function of the angle θ (dots). The dotted line is proportional to sin(θ), i.e., to the projection of the gradient along the YGC axis. (C) Polarization time T as a function of the mean concentration c at a relative steepness δ = 7.5 10−3μm−1. Each point (c = 2, 6, 11, 16, 35, and 49 μM) results from a fit of data averaged over several GCs (n = 9, 9, 9, 10, 9, and 8, respectively). In the numerical simulations (squares), the average polarization time (± SE) was min. (D) Amplitude A for the same experimental conditions (dots). The dotted line is proportional to f′(c) with . The simulated amplitudes were normalized such that the maximum numerical and experimental values would coincide. The error bars along the abscissa and ordinate axis correspond to the standard deviation in the distribution of concentration and to the uncertainty of the measured parameters, respectively.
We next examined how T and A changed when the average concentration c varied between ∼1 and 55 μM at a fixed relative steepness δ = 7.5 ± 0.4 10−3 μm−1 (54 cells in total). T and A were determined on data clustered by increasing values of c (∼9 cones per point). We found that T, equal in average (± SE) to Tm = 9.2 ± 0.1 min, was still largely independent of c (Fig. 6 C). The fact that the dynamics of the cell response is independent of the stimuli conditions is consistent with the predictions of our model, in which the polarization kinetics is only determined by the diffusional properties of the receptors. In contrast, the amplitude A had marked concentration dependence with a peak value 0.28 at c ≈ 10–15 μM (Fig. 6 D), a concentration close to the GABA binding constant (31). This indicates a preferential range of concentration for gradient sensing and points to an absence of adaptation mechanisms to adjust the GC response for different basal concentration levels.
Modeling of the polarization response
Following related observations in neutrophils (28,32), we hypothesized that the variation in amplitude was caused by modulation in the signal transduction at the membrane. Indeed, GCs must sense a difference Lcδ in the ligand concentration between the up- and down-gradient sides of the GC. Once processed by saturable membrane receptors (with response f(c)), this extracellular gradient is converted into a difference ΔR in receptor occupancy, which, for receptors located at the extremities of the GCs, is equal to: ΔR = f(c + ∇cL/2) − f(c − ∇cL/2) ≈ f′(c)∇cL. ΔR is thus expected to be maximal for c around the binding constant and to diminish at lower or higher (saturating) concentrations.
The previous argument is, however, only qualitative. Indeed, receptors are not solely positioned at the cell edges. Moreover, their distribution changes over the time course of the experiment so it is presumably not sufficient to compare the receptor occupancy at the cell extremities to determine the integrated response. Hence, for more quantitative insights, we compared our observations to computational results from a model that could explain the polarization of GABAARs with minimal ingredients (14). In short, our model considers diffusing receptors that can transiently interact with MTs and, as they bind, get transported by elongating MTs (Fig. 7 A). Assuming that the elongation length depends on the receptor activation response, this creates a positive feedback that leads to polarity: in a gradient, the asymmetric activation of the receptors favors the oriented elongation of MTs toward the gradient source, which in turn promotes the polarization of the receptors at the GC membrane (Fig. 7 B).
Figure 7.
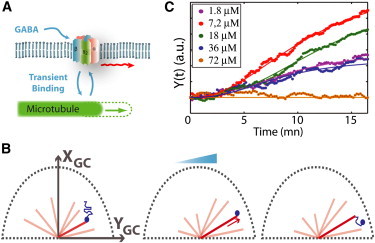
(A) Model is based on the coupling between the receptor diffusive movement in the membrane and MT dynamics (see (14) for details). (B) In a gradient, the coupled dynamics of the receptors (blue) and the MTs (red) acts as positive feedback leading to polarization at the GC membrane. (C) Simulated polarization Y(t) as a function of time for different mean concentration c (δ = 7.5 ± 0.4 10−3μm−1). The plain lines are adjustments with the curve Atn/(tn + Tn) (n taken equal to 5).
In our initial modeling effort, we had assumed a linear activation response of the receptors, independent of the mean concentration. We thus modified our model to account for the concentration conditions encountered in our microfluidic assay. Simulations at small δ (<0.01 μm−1) indicated a linear dependence of the amplitude A with δ (or equivalently with ΔR/c). We thus now expected A to vary proportionally to the effective steepness f′(c)δ. We hypothesized that the response f(c) scaled as ch/(ch + Kh) and neglected desensitization effects. The Hill coefficient h and the effective binding K, not yet reported for GABAARs in spinal GCs, were thus left as free parameters and determined a posteriori from the curve A(c). Simulations led to polarization curves very similar to the experimental results. The best agreement was obtained for hm = 2.1 and Km = 18 μM (Fig. S4), two values consistent with past electrophysiological results on GABAARs (31) for different neuron types. We furthermore performed stochastic simulations of the lateral dynamics of individual receptors in different gradient conditions, using the optimal model accounting for receptor activation with the response , diffusion, and interactions with MTs (Fig. 7 C). The numerical results, with no adjustable parameters, were in agreement with the experimental data for the dependence of the polarization kinetics and amplitude on the gradient orientation (Fig. 6, A–B), or ligand concentration (Fig. 6, C–D).
Discussion
We used the controlled conditions enabled by the microsystems to probe the polarization at the GC membrane during GABA directional sensing. Compared to measurements of the chemotactic motility response of cells (28,33,34), our assay offers two significant advantages: i), by focusing on the receptor dynamics, we directly probe the response of elements of the sensing machinery that detect the external gradient and not a downstream signal possibly distorted after multiple processing steps; and ii), during directional sensing, GCs remain immobile and are thus submitted to a gradient with stable concentration and orientation conditions. Hence, our measurements focus on spatial sensing, namely the ability of GCs to respond to differences in cue concentration across the cell extent, and rule out temporal sensing effects, when cells compare absolute concentrations by moving up and down the gradient.
In this context, our experiments support the notion that spatial information can be processed at the level of a single GC. By sensing differences in receptor occupancy, GCs convert a graded external signal into a functional polarity at the membrane. In fact, the regulation of the membrane organization provides a simple mechanism to modulate the response to external signals and to perform advanced processing tasks, without explicitly requiring additional processes such as local translation or endocytotic recycling. Despite the molecular complexity of the events leading from ligand binding to cell polarization, a remarkably simple picture emerges for the properties of GCs as sensors. In particular, the amplitude response was proportional to the effective gradient, a simple geometric dependence between the gradient orientation and the axonal growth direction (Fig. 6 B). Furthermore, accounting for the nonlinear concentration dependence in the chemoreceptor occupancy, imposed by the binding constant, is sufficient to capture the modulation of the integrative response of the cell. This implies that the response of other elements in the downstream signaling cascade are not saturating, which is beneficial for in vivo guidance when multiple cues, possibly sharing signaling pathways, need to be simultaneously processed (35,36).
We also measured the polarization kinetics and found that the polarization time Tm was constant (∼9 min), irrespective of gradient conditions (Fig. 6 A and Fig. 6 C). This points to the existence of a characteristic timescale over which the stimulation needs to be sustained in order to polarize the chemoreceptors. Because Tm can also be interpreted as a time over which GCs are able to filter out fluctuating signals, our results mean that GCs act as low-pass filters with a fixed cutoff frequency 1/Tm ≈ 0.002 Hz. In fact, this is in agreement with the predictions of our computational model (14), which suggests that the polarization kinetics is determined by the diffusion properties of the receptors rather than by the spatial or chemical characteristics of the directional signal. The time Tm is much longer than the response time of Dictyostelium amoebas or neutrophils (typically a few seconds) (4). It possibly reflects the functional differences between the guidance of neurons, which favor accuracy over speed, and that of food-searching cells for which rapid response is crucial.
A central question in chemotaxis is that of adaptation, namely the capability of a cell to reset its sensitivity to its chemical environment. Despite its importance (2), it has only started being investigated in the context of axonal guidance (33,35,37). In our experiments, GABA gradient detection appears to be optimized for a narrow range of concentration rather than to adjust to the basal levels of guidance cues. The peaked variation of the cell response suggests an absence of adaptation, similar to what was reported for NGF gradient sensing in DRG axons (33,38,39) as well as to recent observations in other eukaryotic systems using microfluidic assays (28,34). This conclusion apparently differs from those of prior reports suggesting the existence of adaptation mechanisms during the sensing of Netrin-1, BDNF, or Semaphorin 3A (35,37). However, these experiments are significantly different from ours, as they were not designed to investigate the dependence of the response to ligand concentration (which was varied only by a factor ∼2) or to the gradient slope. Rather they focused on the ability to readjust the neuronal response when exposed to uniform baths of chemical cues. In our case, the ligand-concentration dependence of the polarization response possibly suggests a tight regulation of in vivo chemoattractant concentrations. If guidance signals result from localized release, it also means that diffusible guidance cues might be effective only over a limited distance range from their source. In the case of GABA gradient sensing, this is consistent with a hypothesis where the foremost use of neurotransmitter guidance is for local cytoarchitectural reshaping (40). However, in general, because the sensitivity to the gradient is peaked around a specific concentration and only extends over no more than two orders of magnitude leaves open the question of how long-range migration is controlled (39). An appealing possibility is that complex guidance coding is achieved through the combinatory processing of multiple cues, known to be simultaneously present during brain development (36). Microfluidic tools should prove essential to further investigate this hypothesis and analyze the combinatorial response of individual GCs.
Conclusion
Our measurements provide an integrative view of the GCs as chemical sensors and highlight how dynamic adaptation of the cellular organization is used for the processing of functional signals. They also illustrate how the workings of complex molecular and signaling circuits can be probed using controllable inputs made possible by microfluidic tools. Beyond the case of GABA guidance, shearless microfluidic assays, which could be multiplexed to provide a simple and low-cost screening platform, will constitute an invaluable tool for deciphering, at a molecular or systems-level, the rules by which nerve cells interpret chemical information and convert it into functional motility.
Acknowledgments
We are grateful to D. Bartolo for his help in the design of the microdevices, P. Tabeling and the MMN laboratory at ESPCI for giving us access to their clean room, J. M. Fritschy for his generous gift of anti-γ2 antibodies, X. Nicol, H. Juraver, and B. Durand for their help with the cultures of Xenopus laevis neurons, and to M. Piel for sharing the actin marker. We thank S. Garel, G. Gouzer, M. Vergassola, M. Coppey, and S. Andersen for critical reading of the manuscript and useful discussions. Three authors (J.C.G., V.S., and M.D.) are shareholders of a start-up company (Alveole) developing devices inspired by the microfluidic technology used in this report.
This work was supported by grants from Fondation Pierre-Gilles de Gennes, Centre National de la Recherche Scientifique (CNRS), Fondation pour la Recherche Médicale, Centre C’Nano Ile de France, and Agence Nationale pour la Recherche (ANR Piribio 2009 CONE).
Supporting Material
References
- 1.O’Donnell M., Chance R.K., Bashaw G.J. Axon growth and guidance: receptor regulation and signal transduction. Annu. Rev. Neurosci. 2009;32:383–412. doi: 10.1146/annurev.neuro.051508.135614. [DOI] [PMC free article] [PubMed] [Google Scholar]
- 2.Song H., Poo M. The cell biology of neuronal navigation. Nat. Cell Biol. 2001;3:E81–E88. doi: 10.1038/35060164. [DOI] [PubMed] [Google Scholar]
- 3.Mortimer D., Fothergill T., Goodhill G.J. Growth cone chemotaxis. Trends Neurosci. 2008;31:90–98. doi: 10.1016/j.tins.2007.11.008. [DOI] [PubMed] [Google Scholar]
- 4.Swaney K.F., Huang C.H., Devreotes P.N. Eukaryotic chemotaxis: a network of signaling pathways controls motility, directional sensing, and polarity. Annu Rev Biophys. 2010;39:265–289. doi: 10.1146/annurev.biophys.093008.131228. [DOI] [PMC free article] [PubMed] [Google Scholar]
- 5.Berzat A., Hall A. Cellular responses to extracellular guidance cues. EMBO J. 2010;29:2734–2745. doi: 10.1038/emboj.2010.170. [DOI] [PMC free article] [PubMed] [Google Scholar]
- 6.Jin T., Zhang N., Devreotes P.N. Localization of the G protein betagamma complex in living cells during chemotaxis. Science. 2000;287:1034–1036. doi: 10.1126/science.287.5455.1034. [DOI] [PubMed] [Google Scholar]
- 7.Servant G., Weiner O.D., Bourne H.R. Polarization of chemoattractant receptor signaling during neutrophil chemotaxis. Science. 2000;287:1037–1040. doi: 10.1126/science.287.5455.1037. [DOI] [PMC free article] [PubMed] [Google Scholar]
- 8.Iglesias P.A., Devreotes P.N. Navigating through models of chemotaxis. Curr. Opin. Cell Biol. 2008;20:35–40. doi: 10.1016/j.ceb.2007.11.011. [DOI] [PubMed] [Google Scholar]
- 9.Guirland C., Suzuki S., Zheng J.Q. Lipid rafts mediate chemotropic guidance of nerve growth cones. Neuron. 2004;42:51–62. doi: 10.1016/s0896-6273(04)00157-6. [DOI] [PubMed] [Google Scholar]
- 10.Leung K.M., van Horck F.P.G., Holt C.E. Asymmetrical beta-actin mRNA translation in growth cones mediates attractive turning to netrin-1. Nat. Neurosci. 2006;9:1247–1256. doi: 10.1038/nn1775. [DOI] [PMC free article] [PubMed] [Google Scholar]
- 11.Yao J., Sasaki Y., Zheng J.Q. An essential role for beta-actin mRNA localization and translation in Ca2+-dependent growth cone guidance. Nat. Neurosci. 2006;9:1265–1273. doi: 10.1038/nn1773. [DOI] [PubMed] [Google Scholar]
- 12.Tojima T., Akiyama H., Kamiguchi H. Attractive axon guidance involves asymmetric membrane transport and exocytosis in the growth cone. Nat. Neurosci. 2007;10:58–66. doi: 10.1038/nn1814. [DOI] [PubMed] [Google Scholar]
- 13.Bouzigues C., Morel M., Dahan M. Asymmetric redistribution of GABA receptors during GABA gradient sensing by nerve growth cones analyzed by single quantum dot imaging. Proc. Natl. Acad. Sci. USA. 2007;104:11251–11256. doi: 10.1073/pnas.0702536104. [DOI] [PMC free article] [PubMed] [Google Scholar]
- 14.Bouzigues C., Holcman D., Dahan M. A mechanism for the polarity formation of chemoreceptors at the growth cone membrane for gradient amplification during directional sensing. PLoS ONE. 2010;5:e9243. doi: 10.1371/journal.pone.0009243. [DOI] [PMC free article] [PubMed] [Google Scholar]
- 15.Keenan T.M., Folch A. Biomolecular gradients in cell culture systems. Lab Chip. 2008;8:34–57. doi: 10.1039/b711887b. [DOI] [PMC free article] [PubMed] [Google Scholar]
- 16.Bhattacharjee N., Li N.Z., Folch A. A neuron-benign microfluidic gradient generator for studying the response of mammalian neurons towards axon guidance factors. Integr. Biol. (Camb.) 2010;2:669–679. doi: 10.1039/c0ib00038h. [DOI] [PMC free article] [PubMed] [Google Scholar]
- 17.Taylor A.M., Blurton-Jones M., Jeon N.L. A microfluidic culture platform for CNS axonal injury, regeneration and transport. Nat. Methods. 2005;2:599–605. doi: 10.1038/nmeth777. [DOI] [PMC free article] [PubMed] [Google Scholar]
- 18.Joanne Wang C., Li X., Levchenko A. A microfluidics-based turning assay reveals complex growth cone responses to integrated gradients of substrate-bound ECM molecules and diffusible guidance cues. Lab Chip. 2008;8:227–237. doi: 10.1039/b713945d. [DOI] [PubMed] [Google Scholar]
- 19.Kim T., Pinelis M., Maharbiz M.M. Generating steep, shear-free gradients of small molecules for cell culture. Biomed. Microdevices. 2009;11:65–73. doi: 10.1007/s10544-008-9210-7. [DOI] [PubMed] [Google Scholar]
- 20.Morel M., Galas J.C., Studer V. Concentration landscape generators for shear free dynamic chemical stimulation. Lab Chip. 2012;12:1340–1346. doi: 10.1039/c2lc20994b. [DOI] [PubMed] [Google Scholar]
- 21.Lévi S., Vannier C., Triller A. Strychnine-sensitive stabilization of postsynaptic glycine receptor clusters. J. Cell Sci. 1998;111:335–345. doi: 10.1242/jcs.111.3.335. [DOI] [PubMed] [Google Scholar]
- 22.Bannai H., Lévi S., Triller A. Imaging the lateral diffusion of membrane molecules with quantum dots. Nat. Protoc. 2006;1:2628–2634. doi: 10.1038/nprot.2006.429. [DOI] [PubMed] [Google Scholar]
- 23.Sergé A., Bertaux N., Marguet D. Dynamic multiple-target tracing to probe spatiotemporal cartography of cell membranes. Nat. Methods. 2008;5:687–694. doi: 10.1038/nmeth.1233. [DOI] [PubMed] [Google Scholar]
- 24.Bartolo D., Degré G., Studer V. Microfluidic stickers. Lab Chip. 2008;8:274–279. doi: 10.1039/b712368j. [DOI] [PubMed] [Google Scholar]
- 25.Morel M., Bartolo D., Studer V. Microfluidic stickers for cell- and tissue-based assays in microchannels. Lab Chip. 2009;9:1011–1013. doi: 10.1039/b819090a. [DOI] [PubMed] [Google Scholar]
- 26.Höpker V.H., Shewan D., Holt C. Growth-cone attraction to netrin-1 is converted to repulsion by laminin-1. Nature. 1999;401:69–73. doi: 10.1038/43441. [DOI] [PubMed] [Google Scholar]
- 27.Pinaud F., Clarke S., Dahan M. Probing cellular events, one quantum dot at a time. Nat. Methods. 2010;7:275–285. doi: 10.1038/nmeth.1444. [DOI] [PubMed] [Google Scholar]
- 28.Herzmark P., Campbell K., Bourne H.R. Bound attractant at the leading vs. the trailing edge determines chemotactic prowess. Proc. Natl. Acad. Sci. USA. 2007;104:13349–13354. doi: 10.1073/pnas.0705889104. [DOI] [PMC free article] [PubMed] [Google Scholar]
- 29.Paliwal S., Iglesias P.A., Levchenko A. MAPK-mediated bimodal gene expression and adaptive gradient sensing in yeast. Nature. 2007;446:46–51. doi: 10.1038/nature05561. [DOI] [PubMed] [Google Scholar]
- 30.Kalil K., Szebenyi G., Dent E.W. Common mechanisms underlying growth cone guidance and axon branching. J. Neurobiol. 2000;44:145–158. [PubMed] [Google Scholar]
- 31.White G. Heterogeneity in EC50 and nH of GABAA receptors on dorsal root ganglion neurons freshly isolated from adult rats. Brain Res. 1992;585:56–62. doi: 10.1016/0006-8993(92)91190-p. [DOI] [PubMed] [Google Scholar]
- 32.Zigmond S.H. Consequences of chemotactic peptide receptor modulation for leukocyte orientation. J. Cell Biol. 1981;88:644–647. doi: 10.1083/jcb.88.3.644. [DOI] [PMC free article] [PubMed] [Google Scholar]
- 33.Rosoff W.J., Urbach J.S., Goodhill G.J. A new chemotaxis assay shows the extreme sensitivity of axons to molecular gradients. Nat. Neurosci. 2004;7:678–682. doi: 10.1038/nn1259. [DOI] [PubMed] [Google Scholar]
- 34.Fuller D., Chen W., Loomis W.F. External and internal constraints on eukaryotic chemotaxis. Proc. Natl. Acad. Sci. USA. 2010;107:9656–9659. doi: 10.1073/pnas.0911178107. [DOI] [PMC free article] [PubMed] [Google Scholar]
- 35.Ming G.L., Wong S.T., Poo M.M. Adaptation in the chemotactic guidance of nerve growth cones. Nature. 2002;417:411–418. doi: 10.1038/nature745. [DOI] [PubMed] [Google Scholar]
- 36.Cheng S.Y., Heilman S., Wu M. A hydrogel-based microfluidic device for the studies of directed cell migration. Lab Chip. 2007;7:763–769. doi: 10.1039/b618463d. [DOI] [PubMed] [Google Scholar]
- 37.Piper M., Salih S., Harris W.A. Endocytosis-dependent desensitization and protein synthesis-dependent resensitization in retinal growth cone adaptation. Nat. Neurosci. 2005;8:179–186. doi: 10.1038/nn1380. [DOI] [PMC free article] [PubMed] [Google Scholar]
- 38.Mortimer D., Feldner J., Goodhill G.J. Bayesian model predicts the response of axons to molecular gradients. Proc. Natl. Acad. Sci. USA. 2009;106:10296–10301. doi: 10.1073/pnas.0900715106. [DOI] [PMC free article] [PubMed] [Google Scholar]
- 39.Xu J., Rosoff W.J., Goodhill G.J. Adaptation is not required to explain the long-term response of axons to molecular gradients. Development. 2005;132:4545–4552. doi: 10.1242/dev.02029. [DOI] [PubMed] [Google Scholar]
- 40.Zheng J.Q., Felder M., Poo M.M. Turning of nerve growth cones induced by neurotransmitters. Nature. 1994;368:140–144. doi: 10.1038/368140a0. [DOI] [PubMed] [Google Scholar]
Associated Data
This section collects any data citations, data availability statements, or supplementary materials included in this article.