Abstract
This article reports the evolution of scanning spectral imaging techniques using scattered light for minimally invasive detection of early cancerous changes in tissue and cell biology applications. Optical spectroscopic techniques have shown promising results in the diagnosis of disease on a cellular scale. They do not require tissue removal, can be performed in vivo, and allow for real time diagnoses. Fluorescence and Raman spectroscopy are most effective in revealing molecular properties of tissue. Light scattering spectroscopy (LSS) relates the spectroscopic properties of light elastically scattered by small particles, such as epithelial cell nuclei and organelles, to their size, shape and refractive index. It is capable of characterizing the structural properties of tissue on cellular and sub-cellular scales. However, in order to be useful in the detection of early cancerous changes which are otherwise not visible to the naked eye, it must rapidly survey a comparatively large area while simultaneously detecting these cellular changes. Both goals are achieved by combining LSS with spatial scanning imaging. Two examples are described in this article. The first reviews a clinical system for screening patients with Barrett’s esophagus. The second presents a novel advancement in confocal light absorption and scattering spectroscopic (CLASS) microscopy.
Index Terms: Optics, spectroscopy, imaging, scanning, light scattering, cancer, cellular scale
I. INTRODUCTION
Light is now used in biomedical applications, both for diagnostic [1,2] and therapeutic purposes [3–5]. Especially promising results in the detection of diseases on cellular and sub-cellular scales have been accomplished using optical spectroscopy. This technique does not require tissue removal, can be performed in vivo, can rapidly interrogate large tissue surfaces, and permits the diagnosis to be made in real time. While fluorescence and Raman spectroscopy are effective in revealing the molecular properties of tissue, light scattering spectroscopy (LSS) [6–11] and elastic scattering spectroscopy (ESS) [12,13] are capable of characterizing the structural properties of tissue on a cellular and sub-cellular scale. LSS and ESS connect the spectroscopic properties of light elastically scattered by small particles to their size, refractive index and shape. Light scattering in biological tissues originates from tissue inhomogeneities such as cellular organelles, the extracellular matrix, blood vessels, etc. This often translates into unique angular, polarization, and spectroscopic features of scattered light emerging from tissue and therefore information about the tissue macroscopic and microscopic structure can be obtained from these characteristics.
Several successful examples of implementing these noninvasive optical techniques have emerged in recent years. The first successful demonstration of LSS was demonstrated in an application where the technique is used for non-invasive optical biopsy in Barrett’s esophagus patients [10]. Similarly, the ESS technique was also successfully utilized for the optical biopsy [13]. More recently, a preliminary clinical study has shown that angle-resolved Low-Coherence Interferometry (a/LCI) can depth-selectively diagnose dysplasia in Barrett’s esophagus patients with a contact probe measurement [14].
At the same time for a technique to have a profound impact on either the detection of early cancer in a clinical settings, or the sub-cellular sensing in cell biology applications, it must rapidly survey a comparatively large area while simultaneously detecting abnormalities on a cellular or sub-cellular scale. In other words, the technique should retain sub-cellular sensing capabilities but also become an imaging technique. Both goals can be achieved by combining LSS with scanning. Here LSS provides information about structural properties on a sub-cellular scale and spatial scanning provides imaging.
In this article, we review two systems that utilize LSS imaging on two very different size scales. The first instrument is applied to the early detection of dysplasia by imaging large areas of Barrett’s esophagus in vivo and is called endoscopic polarized scanning spectroscopy (EPSS) [15]. The second technique is used for microscopic imaging of internal cell structure and is called confocal light absorption and scattering spectroscopic (CLASS) microscopy [16,17]. EPSS allows for rapid optical biopsy of large areas of endoscopy-accessible tissue and CLASS microscopy avoids the use of contrast agents, common to standard optical microscopy, which may affect cell function. This article reviews the application of EPSS for diagnosing dysplasia in Barrett’s esophagus during routine clinical procedures, reviews the principles of CLASS microscopy and reports a new form of CLASS microscopy called Coherent CLASS microscopy or C-CLASS.
II. Imaging Early Pre-Cancerous Lesions with LSS
LSS-based detection of dysplasia in Barrett’s esophagus (BE) has been demonstrated successfully using a simple proof-of-principle single-point instrument [6,7]. This instrument was capable of collecting data at randomly selected sites by manually positioning the probe. The sites were then biopsied, the data were processed off-line, and a comparison with biopsy results was made when the pathology information became available. The high correlation between spectroscopic results and pathology was sufficiently promising to justify the development of the clinical device, which is reviewed herein.
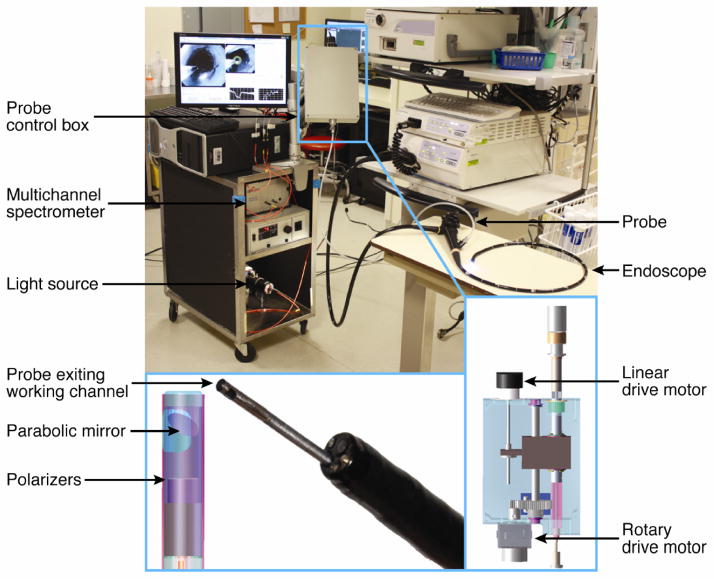
The clinical EPSS instrument [15] is compatible with existing endoscopes (Fig. 1). It scans large areas of the esophagus chosen by the physician, and has the software and algorithms necessary to obtain quantitative, objective data about tissue structure and composition, which can be translated into diagnostic information in real time. This enables the physician to take confirming biopsies at suspicious sites and minimize the number of biopsies taken at non-dysplastic sites.
Fig. 1.
Clinical EPSS instrument. The EPSS instrument is shown in the endoscopy suite before the clinical procedure, with the scanning probe inserted into the working channel of an endoscope. The insets show details of the scanning probe tip and the control box.
The instrument detects polarized light coming primarily from the epithelial layer. Although principally using the polarization technique to extract diagnostic information about dysplasia, the EPSS instrument can also sum the two polarizations to permit the use of diffuse reflectance spectroscopy, which also can provide information about early stages of adenocarcinoma [18].
The EPSS instrument is a significant advance over the single-point fiber-optic instrument in that: (1) it scans the esophagus and has the software and algorithms necessary to obtain quantitative, objective data about tissue structure and composition, which can be translated into diagnostic information and guide biopsy in real time; (2) it employs collimated illumination and collection optics, which enables the instrument to generate maps of epithelial tissue not affected by the distance between the probe tip and the mucosal surface, making it dramatically less sensitive to peristaltic motion; (3) it incorporates both the polarization technique for removing the unwanted background in the LSS signal, and single backscattering in the diffuse reflectance spectroscopy signal; (4) it integrates the data analysis software with the instrument in order to provide the physician with real time diagnostic information; (5) it combines LSS information with diffuse reflectance spectroscopy information measured by the same instrument, thereby improving the diagnostic assessment capability.
The instrument makes use of commercially available gastroscopes and video processors. A standard PC is adapted to control the system. Commercially available spectrometers are also employed.
For use during endoscopy, the polarized scanning fiber optic probe is inserted into the working channel of a standard gastroendoscope (e.g., Olympus GIF-H180 used in the procedures reported below) and the gastroenterologist introduces the endoscope through the mouth. Spectroscopy of the entire Barrett’s segment is performed by scanning adjacent sections, 2 cm in length, with the polarized scanning probe as follows. The endoscope tip is positioned and the probe is extended 2 cm beyond the endoscope tip, placing it at the distal boundary of a BE region chosen for examination. One complete rotary scan of the esophageal wall is completed. The probe is withdrawn linearly 2 mm back into the endoscope tip and another rotary scan is completed. This is repeated for 10 rotary scans, so that an entire 2 cm length of BE is scanned; then, the endoscope tip is withdrawn 2 cm and the next length of BE is examined. Currently the instrument collects 30 data points for each rotary scan and performs ten steps during a linear scan (2 mm per step), collecting 300 data points in 2 minutes for each 2 cm segment of BE. We estimate that the scanning time can be reduced to as little as 20 sec by utilizing a more efficient scanning mechanism.
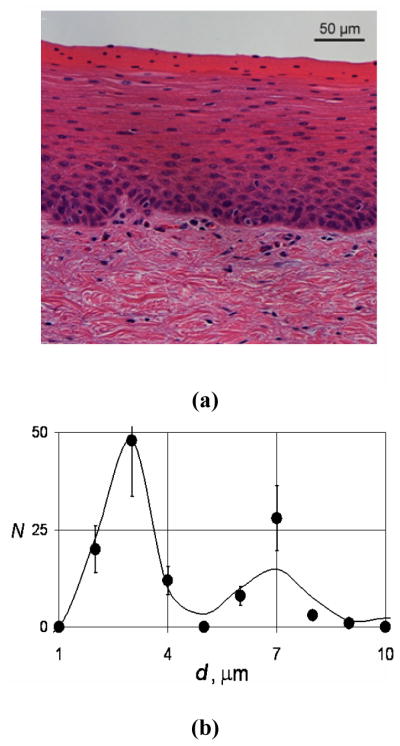
We checked the performance of the EPSS instrument in experiments using freshly resected bovine esophagi. An intact bovine esophagus was mounted vertically and an Olympus GIF-H180 clinical endoscope was inserted. The esophagus was scanned point-by-point and the data were recorded. We then performed histological examination of the sites where the PLSS data were collected (see supplementary section of [15] for more detailed methods). Comparing nuclear sizes in the H&E image with the PLSS result, we observed reasonable agreement (Fig. 2).
Fig. 2.
Bovine lower-portion esophagus epithelium. (a) H&E staining. (b) Comparison of the nuclear size distributions extracted from the EPSS instrument measurements on intact epithelium (solid curve) and histological examination of the corresponding H&E stained sections (dots).
We performed in vivo measurements using EPSS during 10 routine clinical endoscopic procedures for patients with suspected dysplasia at the Interventional Endoscopy Center (IEC) at Beth Israel Deaconess Medical Center (BIDMC). Patients reporting to the IEC at BIDMC had undergone initial screening at other institutions and were referred with confirmed BE and suspicion of dysplasia. Our protocols were reviewed and approved by the BIDMC Institutional Review Board.
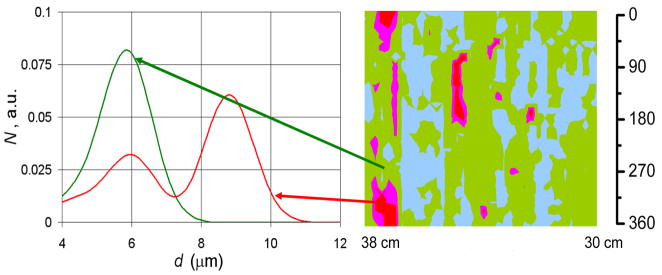
Patients reporting for routine screening of Barrett’s esophagus who had consented to participate in our study were examined. The EPSS polarized fiber optic probe was inserted into the working channel of the gastroendoscope and the gastroenterologist introduced the endoscope through the mouth. The EPSS instrument performed optical scanning of each complete, continuous region of the luminal esophageal wall chosen for examination by the gastroenterologist. Data from the optical scans were recorded for each linear and angular position of the probe tip as parallel and perpendicular polarization reflectance spectra, corrected for light source intensity and lineshape. The backscattering spectrum at each individual spatial location was extracted by subtracting perpendicular from parallel polarized reflectance spectra. The backscattering spectra were then normalized to remove amplitude variations due to peristalsis. The mean of the normalized spectra was calculated. The difference from the mean for each site was calculated, squared, and summed over all spectral points. A site was considered likely to be dysplastic if this parameter was greater than 10% of the summed mean squared. No data points are needed for calibration of this simple diagnostic rule. This analysis is straightforward and can be done in real time. By extracting the nuclear size distributions from the backscattering spectra for each individual spatial location we found that this simple rule is approximately equivalent to a contribution of greater than 25% from enlarged nuclei over 10 microns in diameter (Fig. 3).
Fig. 3.
Nuclear size distributions for one high grade dysplasia site and one non-dysplastic site in BE of one of the patients. Dark (red and pink online) regions of the map indicate areas suspicious for dysplasia based on nuclear size distributions extracted from the backscattering spectra for each individual spatial location. Non-dysplastic BE sites had nuclear size distributions centered about 5–6 μm diameter while sites marked as suspicious for dysplasia have nuclear size distributions with a main peak centered from 9 to 15 μm. The arrows indicate the specific locations on the esophageal surface from which the size distributions extracted from the polarized LSS data.
Two observations support the clinical feasibility of this method. First, spectroscopic data collected during clinical procedures confirm that the polarization technique is very effective in removing unwanted background signals. Second, the issue of peristaltic motion is addressed in the EPSS instrument. During a procedure, it is difficult to maintain a fixed distance between the optical probe head and the esophageal surface, due to peristaltic motion and other factors. Therefore, an important feature of the EPSS instrument is its ability to collect spectra of epithelial tissue that are not affected by the orientation or distance of the distal probe tip to the mucosal surface. This is achieved with collimated illumination and collection optics. Analysis of parallel polarization spectra collected at ten BE locations during a standard clinical procedure showed that although amplitudes of the spectra differ from point to point, the spectral shape is practically unchanged and, more importantly, the oscillatory structure containing diagnostically significant information is intact.
During the initial stage of the project we collected a total of 22,800 EPSS spectra in 10 clinical procedures, covering the entire scanned regions of the esophagus. We validated the capabilities of the clinical method by comparing EPSS data with subsequent pathology at each location where biopsies were taken. For the first two patients, pathology was reported per quadrant not per biopsy. For the other patients, 95 biopsies were collected at EPSS locations given by their distances from the mouthpiece of the endoscope and their angles relative to the start of the EPSS scan. Pathological examination revealed a total of 13 dysplastic sites out of which 9 were high grade dysplasia (HGD). The rest of the sites were diagnosed as non-dysplastic BE.
The diagnostic parameters for each EPSS location were extracted from the backscattering spectra, i.e., the residuals of the parallel and perpendicular spectral components collected by the EPSS instrument. The results are presented in the form of pseudo-color maps. Double blind comparison of the EPSS maps with the biopsy reports revealed 11 true positive (TP) sites, 3 false positive (FP) sites, 80 true negative (TN) sites, and 1 false negative (FN) site. Thus EPSS measurements are characterized by sensitivity of 92% and specificity of 96%.
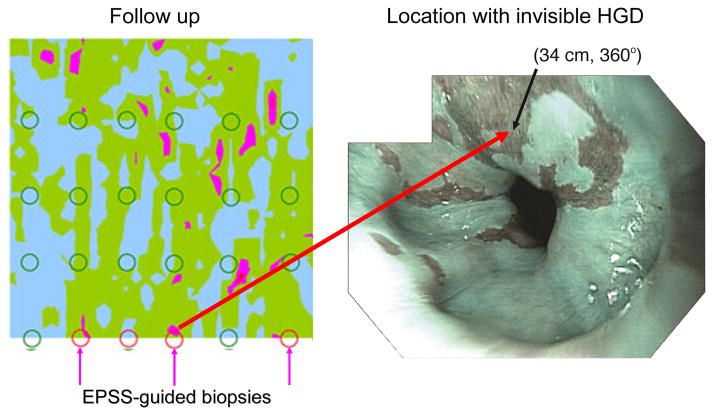
Several BE patient enrolled in our study who underwent routine endoscopy and biopsy with EPSS, pathology revealed no dysplasia and the patients were dismissed. However, in some of these patients the EPSS scan indicated probable sites of focal dysplasia, which were located in regions where biopsies had not been taken. One of the patients was recalled and biopsies were taken at the three sites indicated by EPSS in addition to the standard-of-care protocol. Pathology confirmed HGD in all three EPSS directed biopsies and one more HGD at a point located between two EPSS indicated sites (Fig. 4). The latter site, considered to be a false negative, is very close to the sites indicated by EPSS and may arise from imperfect correspondence of actual biopsy site with EPSS mapped site (a problem which will be addressed in future instrument and algorithm development). The patient now has been given radio frequency ablation (RFA) treatment.
Fig. 4.
Biopsies taken during the initial and follow-up endoscopy procedures for patient A, overlaid on the EPSS map acquired during the initial procedure (left panel). Three follow-up biopsies were guided by the EPSS map and pathology confirmed HGD for each (indicated at 360°). High-resolution endoscopic (HRE) image of a location with invisible HGD (right panel) with narrow band imaging (NBI) enabled. Video capture was acquired in subject A at one of the locations where invisible dysplasia was missed by visual examination by HRE with NBI, but located by EPSS, and later confirmed by pathology. The site is marked by an arrow. Note that the site is visually indistinguishable from the surrounding nondysplastic BE tissue.
These focal dysplasias, which were missed by standard-of-care procedures, which blindly biopsy a tiny fraction of esophageal tissue according to a prescribed protocol, but were caught and confirmed by the capability of EPSS to examine the entire esophageal epithelium millimeter-by-millimeter and detect dysplastic cells – enabling early treatment and in all likelihood saving patients’ esophagi, and perhaps their lives.
The frequency of dysplasia in our patient sample is consistent with that of the pre-screened patient population referred to the BIDMC IEC for confirmation and treatment but is higher than would be expected in the general BE patient population. In fact, the rarity of HGD detection in the general population of BE patients underscores the importance of having a more comprehensive and effective method for gastroesophageal cancer screening.
III. Coherent CLASS Microscopy
As discussed in the Introduction, combing LSS with optical scanning can also be used for the microscopic imaging of internal cell structure. Indeed, by combining LSS with scanning confocal microscopy we recently developed confocal light absorption and scattering spectroscopic (CLASS) microscopy [16,17]. CLASS can measure internal cell structures much smaller than the diffraction limit without damaging the cell or requiring contrast agents, which are common to conventional microscopy and which may affect cell function.
However, what happens with the LSS spectrum when it is collected not just in a backscattering geometry, but with a realistic lens over a finite range of collection angles has not thoroughly been investigated until now. Moreover, LSS is now often used in microscopy where the averaging over a large range of angles usually results in a significant reduction or even disappearance of the structure in the light scattering spectrum.
We found that, in the case of large NA optics, pertinent for high resolution microscopic imaging, a coherent CLASS spectrum exhibits very clear oscillations even when the incoherent CLASS spectrum becomes virtually structure-free. This finding inspired us to extend the concept of CLASS microscopy such that, by using a supercontinuum laser light source in combination with a single mode fiber to preserve the source coherence, we could exploit this important effect. A new coherent CLASS microscope provides dramatically higher spectral contrast compared to the existing incoherent CLASS microscope.
A. Theory of Coherent CLASS Microscopy
To calculate the CLASS spectrum produced with a coherent light source, i.e., the C-CLASS spectrum of a single scatterer ÎC we use a scalar wave model similar to the one developed by Weise et al. [19] and Aguilar et al. [20]. In this model the incident and scattered waves are expanded into a set of plane waves with directions limited by the numerical aperture of the objective.
The amplitude of the signal from a single scatterer is,
| (1) |
where R is a position vector of the scatterer relative to the focus, λ is the wavelength of both the incident and the scattered light (since only elastic scattering is considered), k̂ is a unit vector in the direction of propagation of the incident light, k̂′ is a unit vector in the direction of propagation of the scattered light, P(k̂) is the objective pupil function (the same pupil function is used twice to describe light delivery and collection), and f (δ/λ, n, k̂, k̂′) is the far field scattering amplitude of the wave scattered in direction k̂′ created by the incident wave coming from the direction k̂, Ω is the solid angle subtended by the objective, and is related to its numerical aperture, NA, δ is the particle diameter and n is its relative refractive index. We use Mie theory to calculate the amplitude f (δ/λ, n, k̂, k̂′).
The calculations can be simplified by considering a particle at the center of the focus, i.e. when R = 0. Then the phase term in Eq. (1) is unity and we obtain
| (2) |
To compare with the measured C-CLASS spectrum of a single scatterer, we calculate the scattering intensity, which is the square of the amplitude. This gives the following spectral dependence of the C-CLASS signal:
| (3) |
However, if the source is incoherent (for example an arc lamp) or when a coherent supercontinum laser is used in combination with a multimode fiber, the illumination light at the focal point loses its phase properties and the incoherent intensity ÎI becomes
| (4) |
For the limiting case of backscattering, when the NA is close to 0, we get I = |f (k̂, k̂)|2 for both coherent and incoherent CLASS. However, angular averaging for coherent and incoherent CLASS becomes quite different for a larger NA.
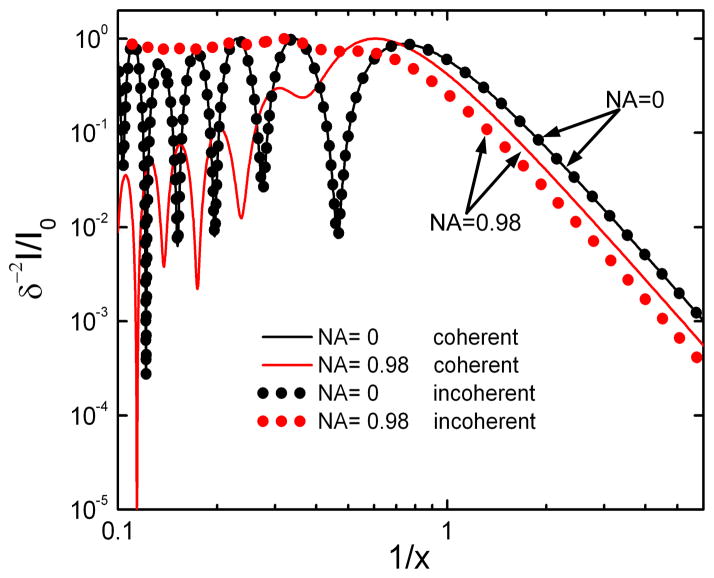
Figure 5 provides a comparison of coherent and incoherent CLASS spectra calculated using Eqs. (3) and (4) for the case of a backscattering geometry (NA = 0) and for a large angle objective (NA = 0.98). All spectra are calculated for a spherical particle with a relative refractive index of 1.06 surrounded by a medium refractive index of 1.36. Those parameters approximate an organelle surrounded by cytoplasm. Spectra are plotted with the inverse size parameter 1/x = λ/(πδ) on a log-log scale. Coherent and incoherent CLASS spectra are virtually identical for backscatter geometry (NA = 0 objective, black line and dots). However, while the incoherent CLASS spectrum for the large angle objective (NA = 0.98) is virtually structureless (gray dots, red online), the coherent CLASS spectrum preserves the majority of the structure and thus information (gray line, red online).
Fig. 5.
Incoherent (dotted lines, color online) and coherent (solid lines, color online) CLASS spectra versus inverse size parameter 1/x = λ/(πδ) plotted on a log-log scale. Coherent and incoherent CLASS spectra are virtually identical for backscattering geometry or NA = 0 objectives. However, while I-CLASS spectrum for the large angle objective (NA = 0.98) is virtually structureless, C-CLASS spectrum preserves the majority of the structure and thus information.
The C-CLASS spectrum from the large angle objective, though red shifted, oscillates with the same frequency as the backscattering spectrum (NA = 0). What is even more important is that the informative AC component of the C-CLASS spectrum is significantly larger than the DC component. That is opposite to the case of the I-CLASS spectrum where the AC component is gradually getting smaller than the DC component for large NA optics, and in the case of NA = 0.98 is only several percent of the DC component. As a result, the SNR of C-CLASS is significantly higher than that of I-CLASS.
The presented theory has approximated light as being fully coherent or fully incoherent. In reality light at the focal plane of a microscope is always partially coherent. The degree of coherence depends on a number of factors such as the coherence of the light source, the pinhole size, and the properties of the optical components along the light path. By using a supercontinuum laser as a light source and by coupling it with the rest of the system using a single mode optical fiber, we can increase the degree of coherence of the system. This allows the CLASS microscope to employ a large NA objective needed for (a) high resolution imaging, (b) reduction of unwanted interference from out-of-focus objects, and (c) increase in power, which is proportional to the fourth power of the objective NA.
B. Experimental Setup
The design of the prototype coherent CLASS scanning microscope is shown in Fig. 6. The system utilizes an Olympus FluoView 1000 scanning unit and an Olympus IX81 inverted microscope frame.
Fig. 6.
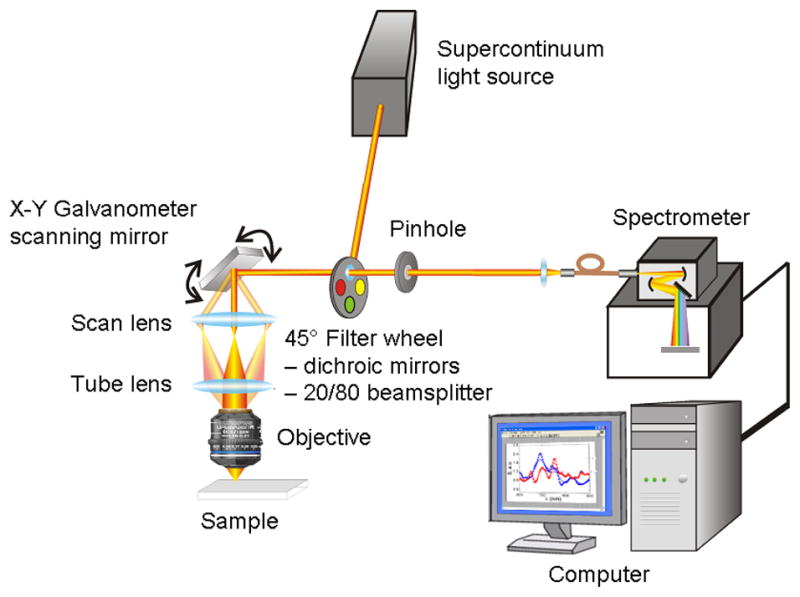
Schematic of the coherent CLASS scanning microscope.
Coherent light from the broadband supercontinuum laser (Fianium SC-450-4) passes through a motorized filter wheel and a fast 1x2 MEMS fiber optic switch (Thorlabs OSW12-633E) before it is partially reflected by the 20/80 beamsplitter, mounted on a 45° primary filter wheel, to the sample. The reflected portion of the beam is rapidly scanned with an X-Y galvanometer scanning mirror. After being expanded by a scan lens and collimated with a tube lens the beam fills the back aperture of an achromatic high NA (1.4) microscope objective (Olympus UPLSAPO 60XW) with very small chromatic aberration (focus position varies within 0.25 μm from 400 nm to 900 nm). The light focused on the sample by the objective is backscattered and is collected by the same objective. After being descanned by the same X-Y galvanometer scanning mirror, scattered light is transmitted through the 20/80 beamsplitter toward the collection pinhole. The collection pinhole blocks most of the light coming from regions above and below the focal plane, allowing only the light scattered from a small focal volume to pass through. The light that passes through the pinhole, is collected by an optical fiber for delivery to an imaging spectrograph (Princeton Instruments Acton SP-2300i) with a thermo-electrically-cooled CCD detector (Andor iXonEM 885 EMCCD), which is coupled to a computer.
The instrument is capable of scanning intact live cells and tissues with a broadband coherent beam, detecting light scattered by various small regions of the target and relating spectroscopic scattering signature of the regions with various organelles present in that region. The wavelength of the supercontinuum laser source, the quantum efficiency of the CCD and the bandwidth of the spectrograph set the spectral range of the microscope to be from 450 nm to 900 nm.
Our estimates show that the spatial resolution of the instrument will be 0.2 μm in the lateral direction and 1 μm in the axial direction at a 600 nm wavelength. Collecting a single C-CLASS pixel spectrum takes approximately 5 ms. This allows obtaining a 128 × 128 image in less than 90 seconds. Although the X-Y galvanometer scanning mirror can scan at a much faster rate, the time is limited by the speed of the 35 MHz Andor iXonEM 885 EMCCD used to detect spectra at every spatial location. Our analysis of the energy budget of the instrument (see Table 1) shows that we have enough signal to operate in the shot noise regime and achieve a SNR greater than 60.
TABLE I.
Instrument Energy Budget
| Subsystem | Component | Energy Reduction | Passed Energy |
|---|---|---|---|
| Delivery | Supercontinuum laser | 40 mW (visible range) | |
| 50/50 beamsplitter | 0.5 | ||
| 20/80 beamsplitter | 0.2 | 5 mW | |
|
| |||
| Scanning head and target | Scanning mirror | 0.9 | 1 mW |
| Lens | 0.8 | ||
| Objective | 0.7 | ||
| Scatter | 10−6 | 1.4 · 10−7 | |
| 20/80 beamsplitter | 0.8 | ||
|
| |||
| Collection | Confocal pinhole | 0.8 | |
| Collection fiber | 0.8 | ||
| Grating efficiency | 0.7 | ||
| Per CCD pixel | 10−3 | ||
| CCD quantum efficiency | 0.25 | ||
| Collection time (5 msec) | 0.005 | 2.4 · 10−13 mW 800 photons/5 ms |
|
| CCD gain | 0.5 | 400 counts/5 ms | |
| Pixel binning | 10 | 4,000 counts/5 ms | |
The spectral resolution of the instrument is mainly defined by the characteristics of the spectrograph and the width of the entrance slit (pixels of the imaging CCD serve as the exit slits and are much smaller than the entrance slit). Then, for the first order spectrum, the spectrometer bandpass resolution is BP = W/Fn where W is the entrance slit width, n is the groove density and F is the focal length. For our system W = 80 μm, n = 50 mm−1, and F = 300 mm. This gives BP ≅ 5 nm. Since one pixel of the CCD is approximately (900 nm – 450 nm)1000 = 0.45 nm, we bin every ten pixels to increase the SNR while preserving the spectral resolution of the microscope.
C. SNR Analysis for C-CLASS and I-CLASS
To compare the effect of SNR on particle sizing in both I-CLASS and C-CLASS approaches we first need to evaluate SNR. As can be seen from the previous section, the collected signal in both I-CLASS and C-CLASS can be presented in the form of a sum of the AC and DC components of the intensity. Both the oscillatory AC component and the background DC component contribute to the noise; however, only the oscillatory AC component carries information about the size of the scatterers. Therefore, we write the SNR as the ratio of the AC component to the overall measured noise:
| (5) |
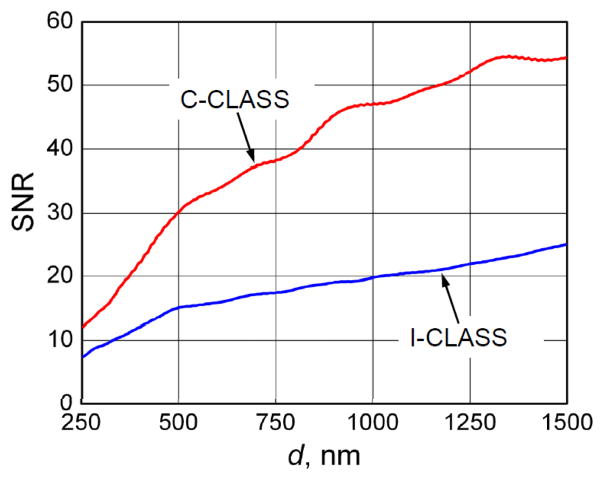
where q is the product of the quantum efficiency of the CCD detector and the efficiency of the spectrograph, IAC is the AC part of the collected signal (photons/spot/second), t is the integration time per spot, IDC is the DC part of the signal, Nd is the dark current of the detector (electrons/spot/second), and Nr is the read noise (electrons RMS/spot). To minimize the effect of the C-CLASS and I-CLASS detectors we have chosen characteristics of a standard, high-end CCD camera: Nd = 0.01 electrons/spot/sec, Nr = 10 electrons RMS/spot and in combination with a good imaging spectrograph, q = 0.5. In the case of I-CLASS detection, IAC ≪ IDC which significantly reduces the efficiency of the I-CLASS technique, however in the case of C-CLASS IAC > IDC.
We should emphasize here that when large imaging areas are scanned rapidly the SNR for individual wavelengths may not be particularly high. However, CLASS spectroscopic measurements consist of approximately 75 measurements at different wavelengths (500 nm to 800 nm spectral range with 4 nm spectral resolution). Such multiple measurements greatly improve statistical accuracy compared with a single measurement and allow accurate particle size reconstruction even for a relatively low SNR. A rigorous analysis which includes correlations between wavelengths does not change this conclusion.
To calculate SNR for C-CLASS and compare it with I-CLASS we first experimentally measured the energy budget for the existing I-CLASS instrument and estimated the energy budget for the proposed C-CLASS instrument. The energy budget estimate for the C-CLASS instrument is provided in Table 1. This estimate also appears to be in good agreement with the new experimental demonstration of the C-CLASS concept provided in the next section.
Based on those measurements and estimates we conclude that both systems are shot-noise limited. Using Eq. (5) we calculated SNR for different sizes of the scatterers for both C-CLASS and I-CLASS approaches. The results of these calculations are presented in Fig. 7
Fig. 7.
Calculated SNR for different size scatterers.
D. Particle Sizing in C-CLASS and I-CLASS
To establish the effect of SNR on particle sizing in both I-CLASS and C-CLASS approaches we performed numerical simulations.
To better approximate realistic experimental conditions, in addition to the spectral and size dependence of the signal, we also need to take into account possible displacement of the particle from the center of the focus. We should note that it is always possible to find the point in the image with Δr ≈ 0 and thus the lateral displacement contribution to the phase term in Eq. (1) can be neglected. To take into account Δz displacement of the scatterer from the focal plain along the vertical axis we modified Eqs. (3) and (4), retaining Δz contribution to the phase terms. This gives the following spectral and vertical displacement dependence for the C-CLASS and I-CLASS spectra
| (6) |
| (7) |
To evaluate the accuracy of the size reconstruction for C-CLASS and I-CLASS we performed the following numerical experiment for a δ0 = 1 μm diameter particle. We first calculated 106 spectra and 106 spectra with random axial displacements of the scatterer in the range of −1000nm < Δz < 1000nm. For each axial displacement, we calculated random positions where Δz0 = 1 μm and X(i) is a random number between 0 and 1.
We then added shot noise to the C-CLASS and I-CLASS spectra using Eq. (5) and calculated 106 simulated experimental spectra of each type
| (8) |
For each of these noisy simulated experimental spectra, particle diameter δ(i) and axial displacement Δz(i) can be reconstructed by minimizing the following expression:
| (9) |
where are simulated experimental C-CLASS orI-CLASS spectra from Eq. (8) and are modeled C-CLASS or I-CLASS spectra described by Eqs. (6) and (7).
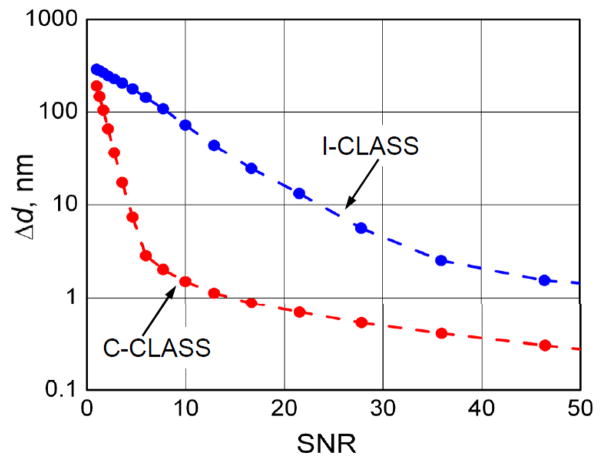
Minimization of the expression in Eq. (9) is performed by: (a) compiling 2D look-up tables with δ changing from 500 nm to 1500 nm in 1 nm steps and Δz changing from -1000 nm to 1000 nm in 10 nm steps, and (b) finding combination of δ and Δz which gives the smallest value of the expression. We then calculated distributions of reconstructed scatterer’s sizes δ and plotted the standard deviation Δδ for 1 μm scatterer as a function of SNR for both I-CLASS and C-CLASS (see Fig. 8). It is easy to see that C-CLASS gives dramatically more accurate results for the same values of SNR.
Fig. 8.
Numerical simulation of particle sizing accuracy for I-CLASS and C-CLASS as a function of the measurement SNR. Dotted lines are provided to guide the eye.
IV. Experimental Demonstration of C-CLASS Concept
We devised an experiment which approximates a C-CLASS measurement using our existing I-CLASS system, thus providing a preliminary proof of concept of C-CLASS. To achieve this, we replaced the multimode illumination fiber with a single mode fiber and removed the illumination confocal pinhole. We also replaced the achromatic reflective objective (NA = 0.5, 36X magnification; Ealing 25-0522) with an achromatic high NA (1.4) refractive objective (Olympus UPLSAPO 60XW) with very small chromatic aberration (focus position varies within 0.25 μm from 400 nm to 900 nm). We also selected an iris diaphragm to match the acceptance angle of the new objective. Though this setup approximates only some basic features of the proposed C-CLASS system, such as particle sizing and SNR, it nevertheless enables us to demonstrate in principle the improvements that can be expected using C-CLASS.
Using this “C-CLASS Concept” setup we performed experiments with polystyrene beads in glycerol to compare the accuracy of particle sizing for C-CLASS vs. I-CLASS techniques. This I-CLASS measurement is performed with the same high NA objective used in the “C-CLASS Concept” to achieve the same spatial resolution with both systems.
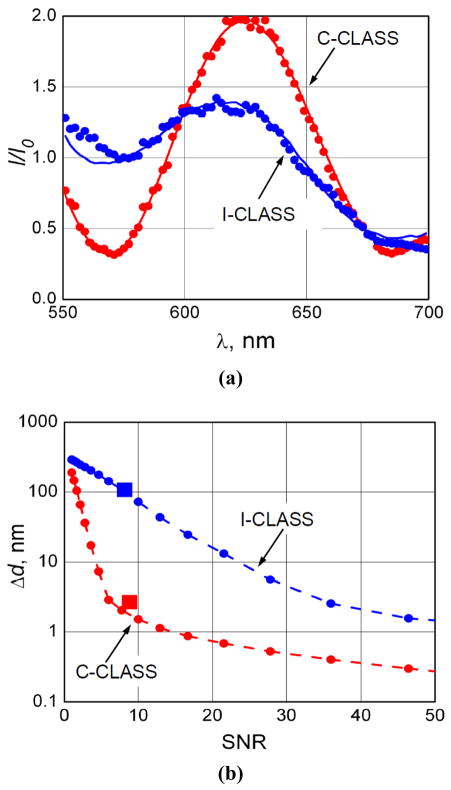
Figure 9a presents a typical C-CLASS spectrum collected with the concept setup and I-CLASS spectrum collected with an existing CLASS microscope. Both experimental spectra are for 1053 nm ± 10 nm manufacturers’ nominal diameter polystyrene microspheres in glycerol. Model fits are based on Eqs. (6) and (7) and depend not only on the diameter of the scatterers but also on the relative axial position and refractive indices of both scatterers and surrounding media. The typical fit for C-CLASS is very good and the extracted diameter of 1052 nm is very close to the manufacturers’ nominal diameter. What is even more encouraging is the precision of the reconstructed refractive indices. Reconstructed refractive index of the microspheres is 1.59 and of the surrounding media is 1.44, which are exactly the corresponding refractive indices of polystyrene and glycerol aqueous solution used in the experiments. The I-CLASS extracted diameter of 1029 nm is significantly less accurate.
Fig. 9.
Experimental results. (a) Typical experimental CLASS spectra (dots) and model fits (solid curves) for a polystyrene microsphere in glycerol. Manufacturer’s nominal diameter for microsphere is 1053 nm ± 10 nm. Model fit for I-CLASS data gives 1029 nm diameter; model fit for “C-CLASS Concept” data gives 1052 nm diameter. Refractive indices of microsphere and surrounding medium reconstructed from “C-CLASS Concept” data are 1.59 and 1.44, which agree with the known refractive indices of polystyrene and aqueous glycerol solution. (b) Experimental values of particle sizing accuracy (squares) overlaid on calculated values from Fig. 8.
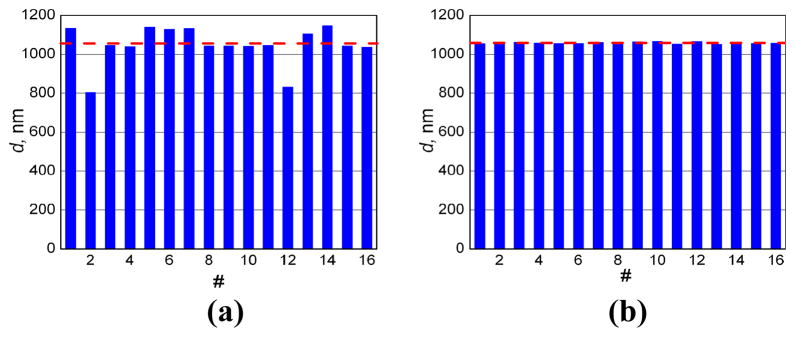
We also compared the accuracy of particle sizing for the C-CLASS vs. I-CLASS techniques using measurements on 16 polystyrene microspheres with manufacturers’ nominal diameter of 1053 nm ± 10 nm (Fig. 10). Diameters extracted from I-CLASS measurements produce average size is 1046 nm with standard deviation is 99 nm. Increase in standard deviation over older I-CLASS measurements is due to the much larger NA objective used here. However, even with this very large NA objective (which allows significantly improve spatial resolution of the microscope and reduces the illumination volume by more than an order of magnitude) C-CLASS measurements yielded average diameter of 1058 nm with standard deviation of 5 nm, an extremely accurate results taking into account manufacturers’ uncertainty and the crudeness of the experimental system.
Fig. 10.
Diameters of 16 polystyrene microspheres with manufacturers’ nominal diameter of 1053 nm ± 10 nm, extracted from I-CLASS and C-CLASS measurements. (a) I-CLASS measurements: average size is 1046 nm, standard deviation is 99 nm; (b) C-CLASS measurements: average diameter is 1058 nm, standard deviation is 5 nm. Dashed line is provided to guide the eye and is at the manufacturers’ nominal diameter of 1053 nm.
We also compared this experimental accuracy of particle sizing for both I-CLASS and C-CLASS techniques with the theoretical predications from Fig. 8. The new accuracy vs. SNR curves, with experimental points present, are provided in Fig. 9b and show reasonable agreement demonstrating that expected significant increase in the accuracy of C-CLASS technique vs. I-CLASS is not only an experimental reality but is also well understood.
V. Discussion and Conclusion
There is a significant need for tools that can detect changes on submicrometer scale in live cells without damaging them or using exogenous markers which could affect cell function. Because light can be nondestructive, optical techniques appear to be good candidates to fulfill this need both for clinical diagnosis and for cell biology applications. However, optical techniques often lack contrast in cells and thus require the introduction of fluorophores or other exogenous compounds (staining). Also, they are diffraction limited and cannot resolve objects much smaller than a wavelength without complex subdiffraction microscopy approaches. The scanning spectral imaging techniques described here employ LSS as a native optical marker and are capable of rapid imaging of cells and tissues at the same time. These techniques posses significant promise for the non-invasive detection of early cancerous changes in tissue and improvement in contrast and resolution of cell biology.
The clinical endoscopic technique reviewed in this article, EPSS, can rapidly survey large areas of tissue to discover invisible dysplasia, which is a major advantage over single point approaches not suitable for guiding biopsy in realistic clinical settings. This endoscopic scanning LSS-based technique offers great promise for the early detection of dysplasia in various gastrointestinal organs.
A similar idea is employed in the novel Coherent Confocal Light Absorption and Scattering Spectroscopic (C-CLASS) scanning technique described in this article. It can be used for non-invasive dynamic monitoring of subcellular structure without the need for exogenous imaging agents and can provide a valuable tool for use in multiple areas of biomedical research. The instrument scans biological cells with a coherent broadband supercontinuum focused laser beam and collects elastically scattered light using a confocal arrangement. Collected light, elastically scattered by various subcellular organelles and structures, provides real time information about the morphological, biochemical and physical properties of various regions of the living cell and their function.
Since entirely non-invasive devices capable of probing cellular composition on a sub-cellular scale, both for structure and function, are rather scarce, these new tools will provide unique capabilities to study functions of viable cells, which are beyond the capabilities of other techniques.
Acknowledgments
This work was supported by the National Science Foundation grants CBET-0922876 and CBET-0943180, the National Institutes of Health grants R01 EB003472, R01 EB006462, and R33 RR017361, and in part by the Department of Veterans Affairs, Office of Research and Development.
The authors thank J. Leyden, N. Ozden and A. Sacks for the help with conducting clinical studies. This work was carried out at the BIDMC Biomedical Imaging and Spectroscopy Laboratory, Harvard Medical School.
Biographies

Le (Tony) Qiu received the B.S. degree in physics from the Peking University in China in 2004 and the Ph.D. degree in physics from Boston University in 2009. He is currently Instructor at Harvard University and Group Leader at the Biomedical Imaging and Spectroscopy Laboratory, BIDMC directed by Dr. Perelman. His interests include the application of light scattering spectroscopy and imaging techniques in the fields of biology and medicine.

Vladimir Turzhitsky received the B.S. in biomedical engineering from Rensselaer Polytechnic Institute, Troy, NY in 2004, and his M.S. and Ph.D. in biomedical engineering from Northwestern University, Evanston IL in 2006 and 2009, respectively. He then continued at Northwestern University as a Postdoctoral fellow. Currently, he is a Postdoctoral Fellow at Harvard University and at the Biomedical Imaging and Spectroscopy Laboratory, BIDMC. His interests include the development of light scattering and imaging techniques in the fields of biology and medicine.

Ram Chuttani received the B.S. and M.B.B.S. degrees from University of Delhi in 1978 and 1983 respectively. He is Chief of Endoscopy and Director of Gastrointestinal Endoscopy at Beth Israel Deaconess Medical Center and Assistant Professor of Medicine at Harvard Medical School. He is a recognized expert gastroenterologist with extensive experience in Barrett’s esophagus. As of late, his major research interests have been application of novel optical techniques, such as confocal microscopy and multispectral imaging to early detection of dysplasia in Barrett’s esophagus.

Douglas K. Pleskow received M.D. degree in 1982 from State University of New York at Buffalo. He is currently Associate Clinical Professor of Medicine at Harvard Medical School and Director of Colon Cancer Center and Co-Director of GI Endoscopy at Beth Israel Deaconess Medical Center. He is also a Fellow of American Gastroenterological Association. He is an expert in complex gastrointestinal problems that require therapeutic endoscopic procedures, all aspects of biliary endoscopy, endoscopic ultrasound, and pancreatic diseases. His major research interests have been application of optics and spectroscopy to early detection of precancerous changes in Barrett’s esophagus, study of serologic markers in pancreatic disease, therapeutic pancreaticobiliary endoscopy and endoscopic ultrasound.
Jeffrey D. Goldsmith received M.D. degree in 1996 from Wayne State University School of Medicine. He is currently Assistant Professor of Pathology at Harvard Medical School. His present research interests involve application of optics to pathology and medicine.
Lianyu Guo is Postdoctoral Fellow at Harvard University and at the Biomedical Imaging and Spectroscopy Laboratory, BIDMC. Her interests include the application of optics in the fields of biology and medicine.
Edward Vitkin received his M.S. degree from the Belarus State University in 1961 and the Ph.D. degree in physics from the Institute of Physics Academy of Sciences in Minsk in 1968.
He was a Leading Research Scientist at the Laboratory of Optics of Nonequilibrium Media at the Institute of Physics Academy of Sciences till 2001 working on gas dynamics spectroscopy of jet plumes. He is currently a Lecturer at Harvard University and Senior Scientist at the Biomedical Imaging and Spectroscopy Laboratory at BIDMC. His current area of interests includes light transport in biological tissue and applications to cell biology.

Irving Itzkan received the Bachelor degree in engineering physics from Cornell University, Ithaca, NY, in 1952, the Masters degree in electrical engineering from Columbia University, New York, NY, in 1961, and the Ph.D. degree in physics from New York University, New York, NY, in 1969.
He is currently a Lecturer at Harvard University and Senior Scientist at the Biomedical Imaging and Spectroscopy Laboratory at BIDMC. Prior to that he was a Senior Scientist in the Massachusetts Institute of Technology Laser Biomedical Research Center from 1988 to 2000 where his principal research interest was using optical spectroscopy to diagnose disease. From 1956 to 1969, he was with Sperry Rand and from 1969 to 1985, with the Avco–Everett Research Laboratory where he worked on many different aspects of laser research. His present research interests involve application of optics to cell biology.

Eugene B. Hanlon was conferred the Ph.D. degree in physical chemistry by Boston University for studies into the optical and magnetic resonance spectroscopy of molecules in the interfacial state. He continued postdoctoral studies at the University investigating spectroscopic methods for characterizing tissue and laser tissue interactions and developed photo-acoustic spectroscopy for monitoring tissue ablation at Summit Technology, Inc. He has served as a consultant in Raman spectroscopy for commercial concerns in medical and non-medical applications. As a research scientist with the NIH Laser Biomedical Research Resource at MIT he began studies into the spectroscopic diagnosis of Alzheimer’s disease and currently heads the program in optical spectroscopy of neurodegenerative disorders at the Department of Veterans Affairs Medical Research Service in Bedford, MA. His current research interests are in the area of laser and molecular spectroscopy applications in clinical medicine and medical research. Dr. Hanlon was a Zenith Award investigator, Alzheimer’s Disease and Related Disorders Association, and is a member of the Optical Society of America and past member the American Chemical Society.

Lev T. Perelman received the Ph.D. degree in physics from the Institute of Physics Academy of Sciences in Minsk in 1989. He is currently an Associate Professor at Harvard University where he is also a faculty in Biological and Biomedical Sciences Program. He is also the Director of the Biomedical Imaging and Spectroscopy Laboratory at BIDMC. Prior to that he was a Principal Research Scientist at the Massachusetts Institute of Technology Laser Biomedical Research Center where his research interest was using optical spectroscopy to diagnose disease. He conceived and developed biomedical light scattering spectroscopy (LSS) recently applied to non-invasive detection of early precancerous changes in epithelial tissues and tissue characterization on sub-cellular scale. His present research interest involves application of optics to cell biology and detection of disease.
Contributor Information
Le Qiu, Biomedical Imaging and Spectroscopy Laboratory, Department of Obgyn and Reproductive Biology, Division of Gastroenterology, Department of Medicine, and Department of Pathology, Beth Israel Deaconess Medical Center, Harvard University, Boston, MA 02215 USA.
Vladimir Turzhitsky, Biomedical Imaging and Spectroscopy Laboratory, Department of Obgyn and Reproductive Biology, Division of Gastroenterology, Department of Medicine, and Department of Pathology, Beth Israel Deaconess Medical Center, Harvard University, Boston, MA 02215 USA.
Ram Chuttani, Biomedical Imaging and Spectroscopy Laboratory, Department of Obgyn and Reproductive Biology, Division of Gastroenterology, Department of Medicine, and Department of Pathology, Beth Israel Deaconess Medical Center, Harvard University, Boston, MA 02215 USA.
Douglas Pleskow, Biomedical Imaging and Spectroscopy Laboratory, Department of Obgyn and Reproductive Biology, Division of Gastroenterology, Department of Medicine, and Department of Pathology, Beth Israel Deaconess Medical Center, Harvard University, Boston, MA 02215 USA.
Jeffrey D. Goldsmith, Biomedical Imaging and Spectroscopy Laboratory, Department of Obgyn and Reproductive Biology, Division of Gastroenterology, Department of Medicine, and Department of Pathology, Beth Israel Deaconess Medical Center, Harvard University, Boston, MA 02215 USA
Lianyu Guo, Biomedical Imaging and Spectroscopy Laboratory, Department of Obgyn and Reproductive Biology, Division of Gastroenterology, Department of Medicine, and Department of Pathology, Beth Israel Deaconess Medical Center, Harvard University, Boston, MA 02215 USA.
Edward Vitkin, Biomedical Imaging and Spectroscopy Laboratory, Department of Obgyn and Reproductive Biology, Division of Gastroenterology, Department of Medicine, and Department of Pathology, Beth Israel Deaconess Medical Center, Harvard University, Boston, MA 02215 USA.
Irving Itzkan, Biomedical Imaging and Spectroscopy Laboratory, Department of Obgyn and Reproductive Biology, Division of Gastroenterology, Department of Medicine, and Department of Pathology, Beth Israel Deaconess Medical Center, Harvard University, Boston, MA 02215 USA.
Eugene B. Hanlon, Department of Veterans Affairs, Medical Research Service and Geriatric Research Education and Clinical Center, Bedford, MA 01730 USA
Lev T. Perelman, Email: ltperel@bidmc.harvard.edu, Biomedical Imaging and Spectroscopy Laboratory, Department of Obgyn and Reproductive Biology, Division of Gastroenterology, Department of Medicine, and Department of Pathology, Beth Israel Deaconess Medical Center, Harvard University, Boston, MA 02215 USA (phone: 617-667-4230; fax: 617-667-4230)
References
- 1.Yodh A, Chance B. Spectroscopy and imaging with diffusing light. Physics Today. 1995 Mar;48:34–40. [Google Scholar]
- 2.Ntziachristos V, Ripoll J, Wang LHV, Weissleder R. Looking and listening to light: the evolution of whole-body photonic imaging. Nature Biotechnology. 2005 Mar;23:313–320. doi: 10.1038/nbt1074. [DOI] [PubMed] [Google Scholar]
- 3.Vogel A, Venugopalan V. Mechanisms of pulsed laser ablation of biological tissues. Chemical Reviews. 2003 Feb;103:577–644. doi: 10.1021/cr010379n. [DOI] [PubMed] [Google Scholar]
- 4.Albagli D, et al. Laser-induced thermoelastic deformation - a 3-dimensional solution and its application to the ablation of biological tissue. Medical Physics. 1994 Aug;21:1323–1331. doi: 10.1118/1.597202. [DOI] [PubMed] [Google Scholar]
- 5.Albagli D, et al. Photomechanical basis of laser-ablation of biological tissue. Optics Letters. 1994 Nov;19:1684–1686. doi: 10.1364/ol.19.001684. [DOI] [PubMed] [Google Scholar]
- 6.Perelman LT, et al. Observation of periodic fine structure in reflectance from biological tissue: A new technique for measuring nuclear size distribution. Physical Review Letters. 1998 Jan 19;80:627–630. [Google Scholar]
- 7.Backman V, et al. Detection of preinvasive cancer cells. Nature. 2000 Jul 6;406:35–36. doi: 10.1038/35017638. [DOI] [PubMed] [Google Scholar]
- 8.Gurjar RS, et al. Imaging human epithelial properties with polarized light-scattering spectroscopy. Nature Medicine. 2001 Nov;7:1245–1248. doi: 10.1038/nm1101-1245. [DOI] [PubMed] [Google Scholar]
- 9.Hunter M, et al. Tissue self-affinity and polarized light scattering in the born approximation: a new model for precancer detection. Physical Review Letters. 2006 Sep 29;97:138102. doi: 10.1103/PhysRevLett.97.138102. [DOI] [PubMed] [Google Scholar]
- 10.Wallace MB, et al. Endoscopic detection of dysplasia in patients with Barrett’s esophagus using light-scattering spectroscopy. Gastroenterology. 2000 Sep;119:677–682. doi: 10.1053/gast.2000.16511. [DOI] [PubMed] [Google Scholar]
- 11.Sokolov K, Drezek R, Gossage K, Richards-Kortum R. Reflectance spectroscopy with polarized light: is it sensitive to cellular and nuclear morphology. Optics Express. 1999;5:302–317. doi: 10.1364/oe.5.000302. [DOI] [PubMed] [Google Scholar]
- 12.Mourant JR, et al. Spectroscopic diagnosis of bladder cancer with elastic light scattering. Lasers in Surgery and Medicine. 1995;17:350–357. doi: 10.1002/lsm.1900170403. [DOI] [PubMed] [Google Scholar]
- 13.Lovat LB, et al. Elastic scattering spectroscopy accurately detects high grade dysplasia and cancer in Barrett’s oesophagus. Gut. 2006 Aug;55:1078–1083. doi: 10.1136/gut.2005.081497. [DOI] [PMC free article] [PubMed] [Google Scholar]
- 14.Terry NG, et al. Detection of Dysplasia in Barrett’s Esophagus With In Vivo Depth-Resolved Nuclear Morphology Measurements. Gastroenterology. 2011 Jan;140:42–50. doi: 10.1053/j.gastro.2010.09.008. [DOI] [PMC free article] [PubMed] [Google Scholar]
- 15.Qiu L, et al. Multispectral scanning during endoscopy guides biopsy of dysplasia in Barrett’s esophagus. Nature Medicine. 2010 May;16:603–606. doi: 10.1038/nm.2138. [DOI] [PMC free article] [PubMed] [Google Scholar]
- 16.Itzkan I, et al. Confocal light absorption and scattering spectroscopic microscopy monitors organelles in live cells with no exogenous labels. Proc Natl Acad Sci U S A. 2007 Oct 30;104:17255–17260. doi: 10.1073/pnas.0708669104. [DOI] [PMC free article] [PubMed] [Google Scholar]
- 17.Fang H, et al. Confocal light absorption and scattering spectroscopic microscopy. Applied Optics. 2007 Apr 1;46:1760–1769. doi: 10.1364/ao.46.001760. [DOI] [PubMed] [Google Scholar]
- 18.Georgakoudi I, et al. Fluorescence, reflectance, and light-scattering spectroscopy for evaluating dysplasia in patients with Barrett’s esophagus. Gastroenterology. 2001 Jun;120:1620–1629. doi: 10.1053/gast.2001.24842. [DOI] [PubMed] [Google Scholar]
- 19.Weise W, Zinin P, Wilson T, Briggs GAD, Boseck S. Imaging of spheres with the confocal scanning optical microscope. Optics Letters. 1996 Nov;21:1800–1802. doi: 10.1364/ol.21.001800. [DOI] [PubMed] [Google Scholar]
- 20.Aguilar JF, Lera M, Sheppard CJR. Imaging of spheres and surface profiling by confocal microscopy. Applied Optics. 2000 Sep;39:4621–4628. doi: 10.1364/ao.39.004621. [DOI] [PubMed] [Google Scholar]


