Abstract
Objectives:
We sought to identify characteristics of individuals with mild cognitive impairment (MCI) that are associated with a relatively high probability of reverting back to normal cognition, and to estimate the risk of future cognitive decline among those who revert.
Methods:
We first studied 3,020 individuals diagnosed with MCI on at least 1 visit to an Alzheimer's Disease Center in the United States. All underwent standardized Uniform Data Set evaluations at their first visit with an MCI diagnosis and on a subsequent visit, about 1 year later, at which cognitive status was reassessed. Multiple logistic regression was used to identify predictors of reverting from MCI back to normal cognition. We then estimated the risk of developing MCI or dementia over the next 3 years among those who had reverted, compared with individuals who had not had a study visit with MCI.
Results:
About 16% of subjects diagnosed with MCI reverted back to normal or near-normal cognition approximately 1 year later. Five characteristics assessed at the first MCI visit contributed significantly to a model predicting a return to normal cognition: Mini-Mental State Examination (MMSE) score, Clinical Dementia Rating (CDR) score, MCI type, Functional Activities Questionnaire (FAQ) score, and APOE ϵ4 status. Survival analysis showed that the risk of retransitioning to MCI or dementia over the next 3 years was sharply elevated among those who had MCI and then improved, compared with individuals with no history of MCI.
Conclusions:
Even in a cohort of patients seen at dementia research centers, reversion from MCI was fairly common. Nonetheless, those who reverted remained at increased risk for future cognitive decline.
Mild cognitive impairment (MCI) is often regarded as an intermediate state on a one-way path from normal cognition to dementia.1 However, several longitudinal epidemiologic studies have found that transition from an MCI diagnosis back to normal cognition is fairly common.2–9 Estimates of transition from MCI back to normal cognition have been quite varied, ranging from 4% to 15%2–5 in clinic-based studies and 29% to 55%6–9 in population-based studies, depending in part on duration of follow-up. To date, few, if any, studies have focused on the subset of subjects who return to normal cognition after an MCI diagnosis. With increasing emphasis on the need to treat incipient dementia at an early stage,10 it will be important to know which individuals with MCI have a favorable prognosis.
The present study had 2 main aims. First, we sought to identify factors associated with increased likelihood of reverting from MCI to normal cognition. We hypothesized that factors that have previously been found to be associated with the progression from MCI to dementia would have the opposite association with the probability of reversion from MCI to normal cognition. We also hypothesized that subjects whose primary etiologic diagnosis was thought to be a transitory process, such as medication effects or medical illness, would revert back more often. Second, we sought to describe the longer-term risk of future cognitive decline among those who initially had MCI and then improved. We hypothesized that they would remain at increased risk for retransitioning to cognitive impairment.
METHODS
Subjects included in this study were part of the National Alzheimer's Coordinating Center Uniform Data Set (NACC UDS), described previously.11 Briefly, UDS subjects were seen at 1 of the 33 current or past Alzheimer's Disease Centers (ADCs) funded by the National Institute on Aging. ADCs conduct research and provide clinical evaluation and treatment for patients with MCI, dementia due to Alzheimer disease (AD), and other dementias. Cognitively normal controls are also recruited to participate in the UDS.
All patients were evaluated at each ADC visit by means of the UDS, which included standardized data collection forms that capture information on demographic and clinical subject characteristics.
Standard protocol approvals, registrations, and patient consents.
Written informed consent was obtained from all participants and their study partners. Research using the NACC database was approved by the Institutional Review Board at the University of Washington.
Aim 1: Identify risk factors.
The study sample for this aim consisted of 3,020 subjects aged 65 years or older who 1) were diagnosed with MCI according to standard criteria12 during at least 1 ADC visit between September 2005 and June 2011 and 2) had cognitive status reassessed at a subsequent ADC visit about 1 year (±6 months) later.
Data.
Those meeting criteria for MCI had a cognitive complaint (self-reported or informant-reported), had decline beyond normal aging, did not have dementia, had clinician-judged cognitive decline, and had essentially normal daily function. Cognitive status at the first study visit was further categorized into 4 MCI subtypes: amnestic single domain (memory impairment only), amnestic multiple domain (memory plus at least 1 other domain), nonamnestic single domain (impairment in 1 of language, attention, executive function, or visuospatial ability), or nonamnestic multiple domain (impairment in at least 2 of language, attention, executive function, and visuospatial ability).13,14 At the follow-up visit, about 1 year later, cognitive status was reassessed and categorized as normal cognition; impaired, but not meeting criteria for MCI; MCI; or dementia. Preliminary analyses suggested that some ADCs used the “impaired, not MCI” category frequently, whereas other ADCs never used this designation. Accordingly, study participants classified as either normal cognition or “impaired, not MCI” were combined for analysis into a single “< MCI” category denoting normal or near-normal cognition, defined as those with no impairment or any impairment falling below the MCI criteria threshold.
Candidate risk factors for transitioning to < MCI, staying at MCI, or progressing to dementia were drawn from data collected at the first visit. The demographic characteristics assessed were age, sex, race, educational attainment, and marital status.
Clinician-judged symptoms included years since cognitive decline began, as well as clinically significant decline relative to previously attained abilities in memory, judgment or problem solving, language, visuospatial function, and attention or concentration. Subject- or informant-reported decline in memory relative to previously attained abilities was also evaluated.
In addition to differentiating subjects by MCI subtype, the primary etiologic diagnosis was also used to classify subjects, including the following diagnoses: National Institute of Neurological and Communicative Disorders and Stroke–AD and Related Disorders Association (NINDS-ADRDA) probable or possible AD,15 Parkinson disease,16 vascular dementia,17 depression,18 dementia with Lewy bodies,19 and all other diagnoses, excluding “unknown.” The presumed etiology of MCI was classified as a potentially transitory condition if it was cognitive dysfunction due to medical illness, cognitive dysfunction due to medication, depression or other major psychiatric disorder, or hydrocephalus.
Cognition was measured by the Mini-Mental State Examination (MMSE).20 Functional abilities were ascertained with the Functional Activities Questionnaire (FAQ),21 which rates the subject's ability to conduct 10 instrumental activities of daily living at 1 of 4 levels: “normal,” “has difficulty but does by self,” “requires assistance,” and “dependent.” A total score was calculated by adding the scores for each of the 10 activities. If more than 5 of the responses were not applicable or left blank, the total score was considered missing. For subjects with 1 to 5 missing responses, the total score was calculated by prorating the available responses. The Clinical Dementia Rating (CDR) scale sum-of-boxes score22 served as a global measure of severity of impairment.
The transition rate for subjects with at least 1 APOE ϵ4 allele was compared to that of noncarriers.
The comorbid conditions examined were assessed by means of the modified Hachinski Ischemic Score (HIS), history of stroke, history of diabetes, and depression as measured by the Geriatric Depression Scale (GDS)23 total score. The total score is the sum of all the questions, prorated in the presence of 3 or fewer missing responses.
Finally, center-level factors were considered. These were whether the diagnosis was made by a consensus or a single clinician as well as differences among the individual ADCs themselves.
Statistical analysis.
The relationship between each candidate risk factor and the proportion of subjects who had a diagnosis of < MCI at their next ADC visit was initially tested for statistical significance with a χ2 test. If the response or measure was missing for a given predictor, then the subject was excluded from the analysis for that characteristic.
Multivariable analyses involved 4 steps. First, APOE ϵ4 status, MMSE score, and FAQ total score were imputed for subjects with missing data on these variables, by means of multiple imputation by chained equations.24,25 APOE ϵ4 status was imputed for 979 subjects (32%), MMSE score for 80 subjects (3%), and FAQ total score for 87 subjects (3%). All other risk factors were used as predictors in the imputation process. Ten imputed values were generated for each subject with missing data, yielding 10 complete datasets. The main advantages of using multiple imputation over the complete case sample were 1) to increase power to detect associations in a multiple regression model by using the partial information available on some subjects and 2) to anticipate the likely possibility that the presence of missing scores was not completely random, but that, among subjects with similar known characteristics, the distribution of missing values would resemble that of known values.
Second, backward-elimination was used with logistic regression on the complete-cases dataset, starting with all risk factors that initial bivariate analyses had shown to be statistically significantly associated with improvement and serially excluding the least important one until the Akaike's Information Criterion (AIC) was minimized. This strategy sought to identify a parsimonious set of patient characteristics, each of which contributed to identifying patients with a relatively high probability of improvement. The AIC measures goodness of fit by evaluating the tradeoff between the information explained by the model and its residual variance.26
Third, logistic regression models involving the risk factors selected in step 2 were fitted by generalized estimating equations (GEEs)27 to allow for nonindependence of subjects within ADCs, using an independence correlation structure and robust standard errors. Such a model was fitted for each of the 10 complete datasets resulting from the imputation in step 1.
Finally, results of the 10 parallel analyses were combined according to Rubin's rules28 to obtain summary adjusted odds ratios (ORs) and confidence limits.
Aim 2: Describe risk of future cognitive decline.
To address the second aim, the study sample consisted of all 4,412 UDS participants aged 65 years or older who 1) had made at least 2 visits to an ADC before June 1, 2011; 2) had either MCI or < MCI (but not dementia) on the first visit; and 3) had < MCI on the second visit. The second visit was termed the index visit, and the first visit was termed the preindex visit. Of these 4,412, 694 of them had MCI on the preindex visit—that is, they had reverted to normal or near-normal cognition by the time of the index visit. The remaining 3,718 subjects had < MCI on both visits.
Data.
Information collected on these subjects was as described for aim 1. Subjects were followed approximately annually according to UDS protocol until the earliest of 1) development of MCI or dementia; 2) 3 years after their index visit; 3) June 1, 2011; 4) death; or 5) discontinued participation in the UDS. All of these except 1) were treated as censoring events.
Statistical analysis.
Survival analysis was used to estimate time to MCI or dementia after the index visit, in relation to whether the subject had MCI or < MCI on the preindex visit. Cox proportional-hazards regression yielded estimates of the hazard ratio for development of MCI or dementia in relation to presence or absence of MCI on the preindex visit, controlling for several known risk factors for cognitive decline. These analyses were carried out in 2 ways: 1) using all subjects who had complete data on whichever covariates entered each model; and 2) restricting the analysis to subjects who had complete data on all covariates.
RESULTS
Risk factor identification.
Of the 3,020 subjects with MCI on their initial study visit, 483 (16%) had a diagnosis of < MCI, 1,941 (64%) had MCI, and 596 (20%) had progressed to dementia at their next visit approximately 1 year later. Table 1 shows the proportion transitioning to each cognitive state in relation to each demographic characteristic, whereas table 2 shows the proportion transitioning in relation to each clinical characteristic. Tables e-1 and e-2 on the Neurology® Web site at www.neurology.org provide results for additional clinical characteristics and comorbid conditions. In keeping with the study's focus on reversion rather than progression of MCI, the p values presented in tables 1 and 2 pertain only to the null hypothesis of no difference in the proportion of subjects transitioning to < MCI, not an overall difference among the 3 cognitive states.
Table 1.
Frequency and proportion of transitioning from MCI to < MCI, MCI again, or dementia at next visit (n = 3,020), by demographic characteristic
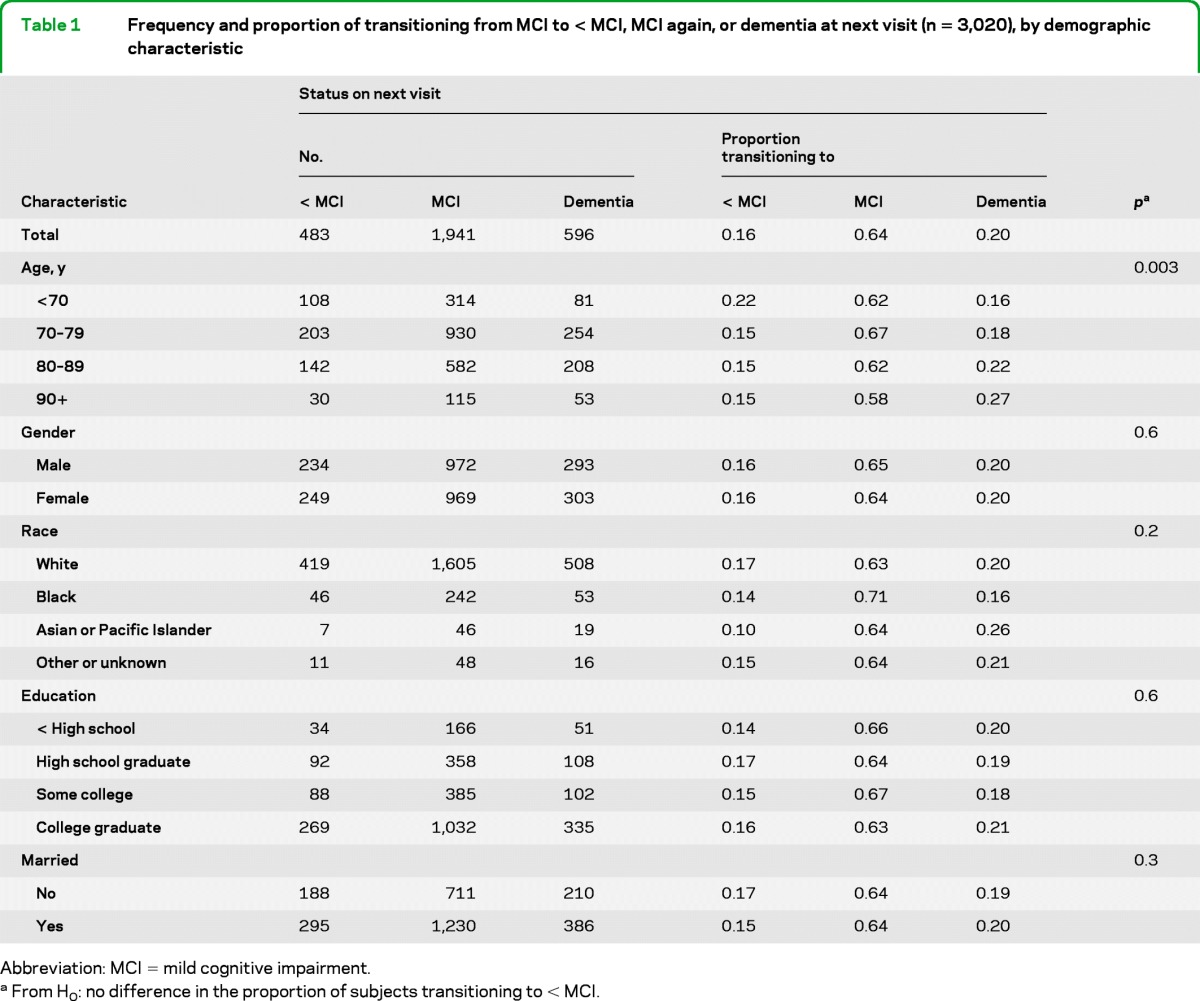
Abbreviation: MCI = mild cognitive impairment.
From H0: no difference in the proportion of subjects transitioning to < MCI.
Table 2.
Frequency and proportion transitioning from MCI to < MCI, MCI again, or dementia at next visit (n = 3,020), by clinical characteristic
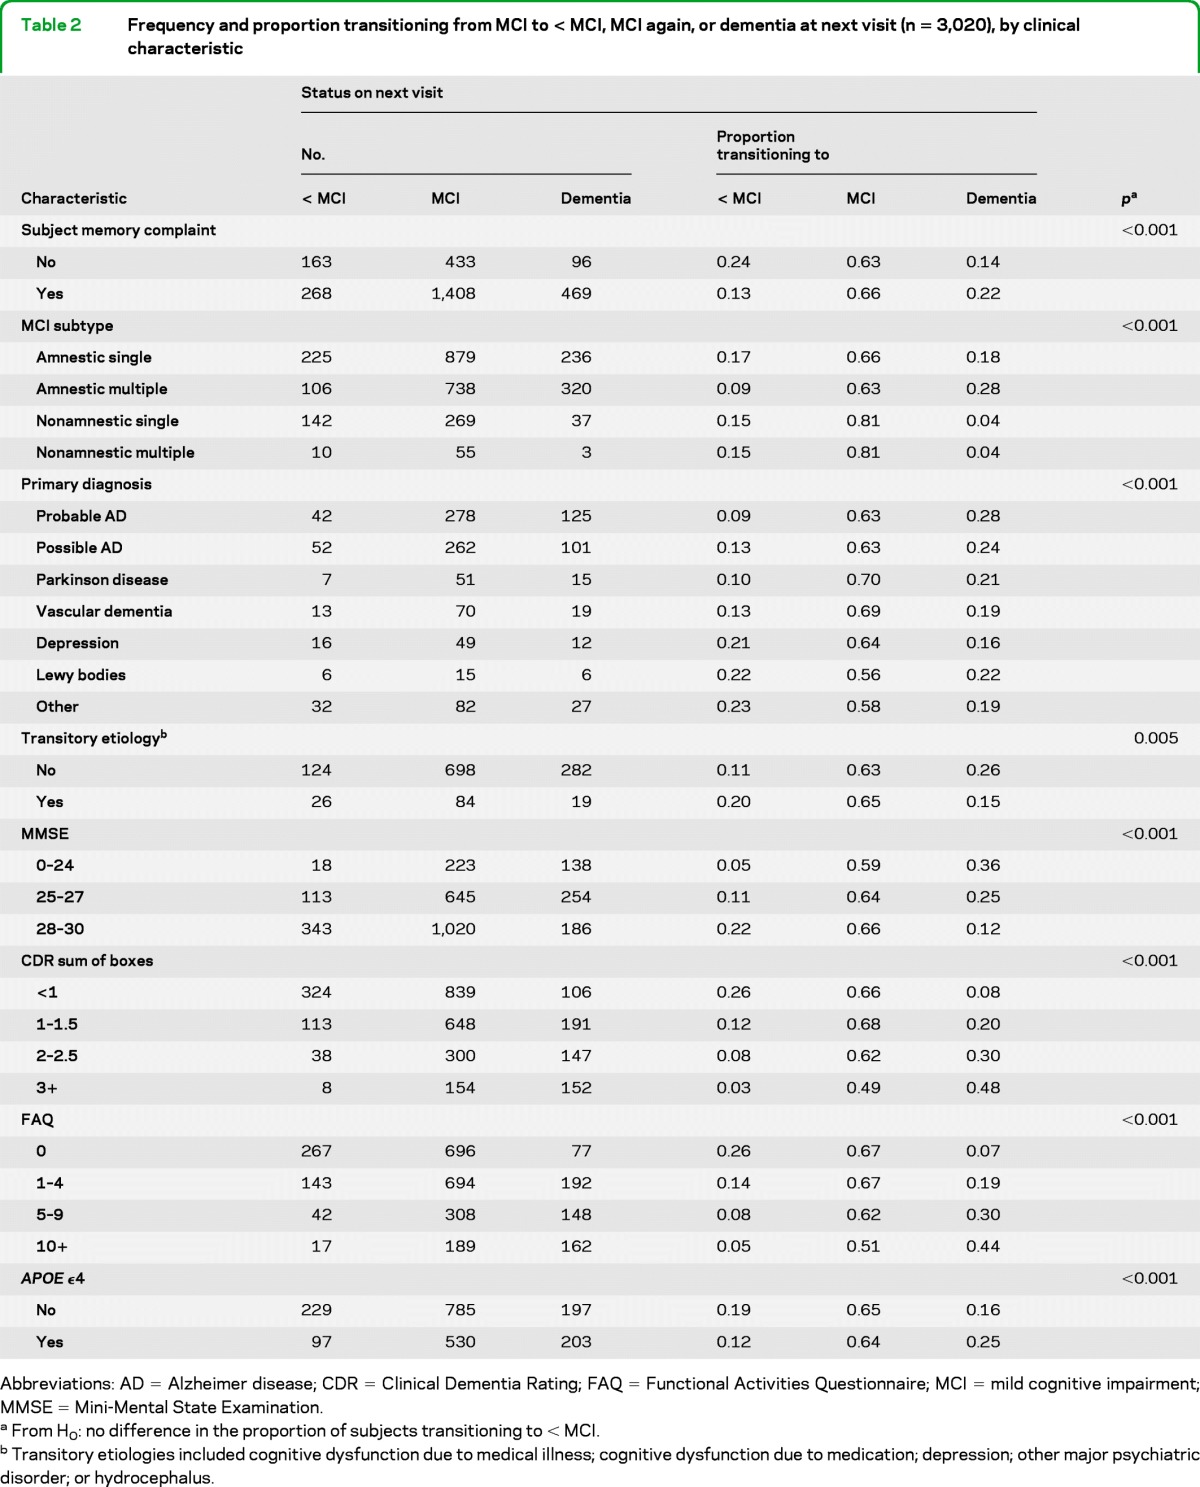
Abbreviations: AD = Alzheimer disease; CDR = Clinical Dementia Rating; FAQ = Functional Activities Questionnaire; MCI = mild cognitive impairment; MMSE = Mini-Mental State Examination.
From H0: no difference in the proportion of subjects transitioning to < MCI.
Transitory etiologies included cognitive dysfunction due to medical illness; cognitive dysfunction due to medication; depression; other major psychiatric disorder; or hydrocephalus.
In general, risk factors associated with progression to dementia were inversely associated with improvement to < MCI. Those more often reverting to < MCI were younger, had more recent symptom onset (results not shown), did not have clinician-reported decline in memory or decline in judgment or problem-solving (results not shown), did not self-report memory decline, and did not have an APOE ϵ4 allele. Nonetheless, there were a few exceptions to this pattern. For example, nonamnestic multiple-domain MCI subjects were less likely than amnestic memory–only MCI subjects to progress to dementia, but they also were less likely to revert to < MCI.
The degree of cognitive impairment on the first MCI visit was strongly associated with cognitive status on the next visit: subjects with higher MMSE scores or lower CDR sum-of-boxes scores more often improved than did more impaired subjects. Similarly, subjects with few functional impairments more often improved than those with a greater degree of functional impairment.
As hypothesized, subjects whose MCI was attributed to an etiology of a transitory condition more often reverted to < MCI; however, a presumed etiologic diagnosis had not been recorded for nearly 3/5 of the subjects.
Frequency of reverting to < MCI also varied significantly among the ADCs (p < 0.001 for a global difference; results not shown).
The results of the multivariable analysis are presented in table 3. The estimated ORs listed in the table refer to associations with improvement to < MCI, not with progression to dementia. Whether MCI was ascribed to a transitory condition was omitted from the multivariable analysis because it was so often unknown or missing.
Table 3.
Three logistic regression models for odds of reversion to normal or near-normal cognition after an MCI visit: complete-case, multiple imputation (MI), and MI followed by GEE analysis accounting for individual ADC effects
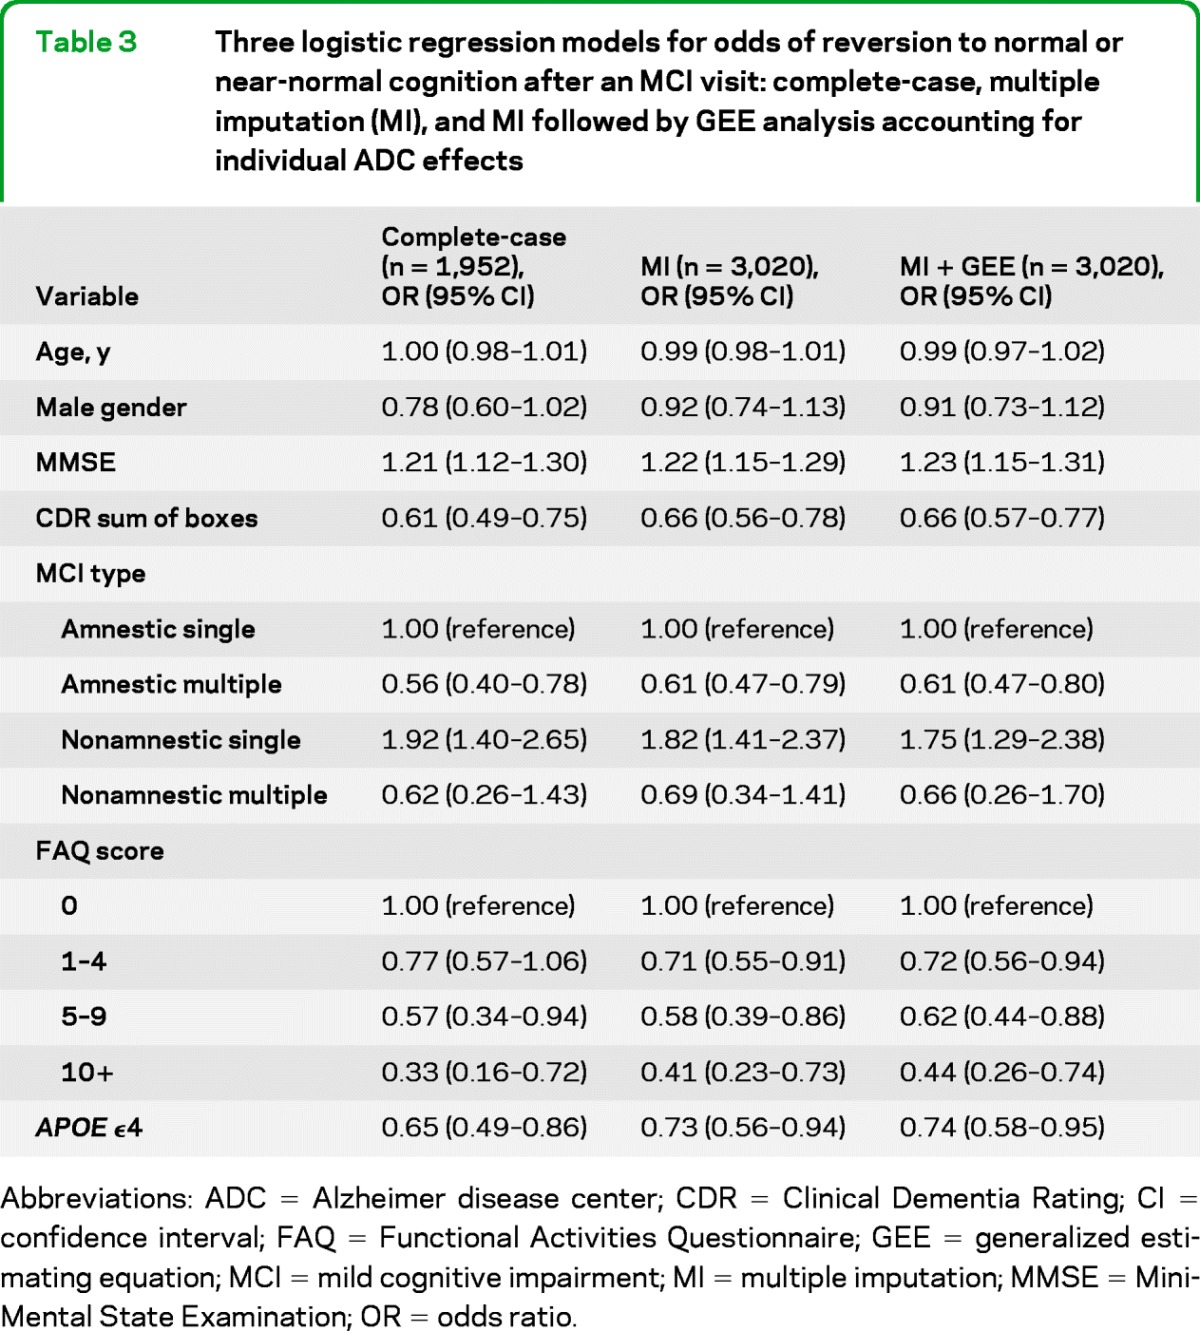
Abbreviations: ADC = Alzheimer disease center; CDR = Clinical Dementia Rating; CI = confidence interval; FAQ = Functional Activities Questionnaire; GEE = generalized estimating equation; MCI = mild cognitive impairment; MI = multiple imputation; MMSE = Mini-Mental State Examination; OR = odds ratio.
Reversion to < MCI differed by MCI type, being more common in amnestic MCI and when multiple cognitive domains were impaired. Both MMSE and CDR sum-of-boxes were statistically significant predictors of reverting to < MCI, even though each OR was adjusted for the other. Similarly, having fewer functional impairments as measured by the FAQ was predictive of a return to < MCI. Finally, presence of an APOE ϵ4 was negatively associated with reversion to < MCI.
Risk of subsequent cognitive decline.
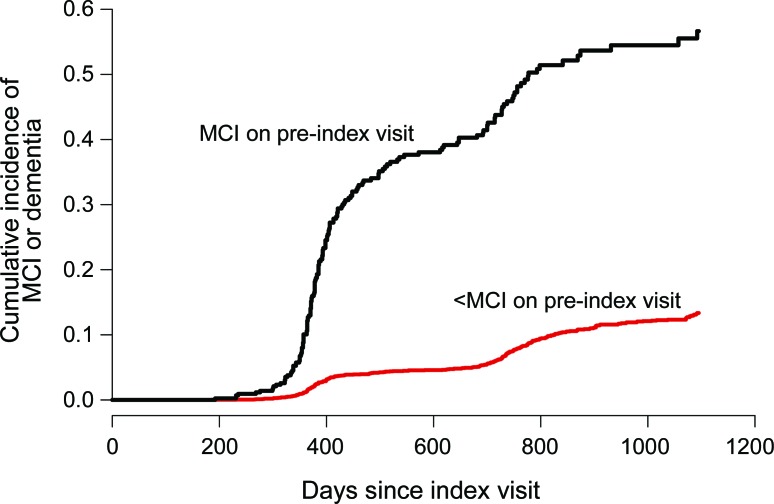
As shown in the figure, subjects who had MCI on their preindex visit but then improved to < MCI were much more likely to develop MCI again or to progress to dementia over the subsequent 3 years than were those without a history of MCI. In this sample, more than half of those who had reverted from MCI to < MCI went on to develop MCI or dementia again within the subsequent 3 years. The cumulative incidence curve for the < MCI group combines patients with normal cognition and those with mild impairment not meeting criteria for MCI; however, as noted above, preliminary analyses suggested that distinction was not made consistently across ADCs.
Figure. Cumulative incidence of progression to mild cognitive impairment (MCI) or dementia after index visit with < MCI, stratified by cognitive status on preindex visit.
Table 4 shows that the sharply higher risk of retransitioning to MCI or dementia among those with MCI on the preindex visit was not explained by controlling for several combinations of known risk factors for cognitive decline. Even in models that included all 7 covariates shown, the hazard ratio for subsequent development of MCI or dementia in relation to a history of MCI was 5.22 (95% confidence interval, 4.16–6.56).
Table 4.
Hazard ratios for risk of subsequent cognitive decline in relation to presence or absence of MCI on the pre-index visit
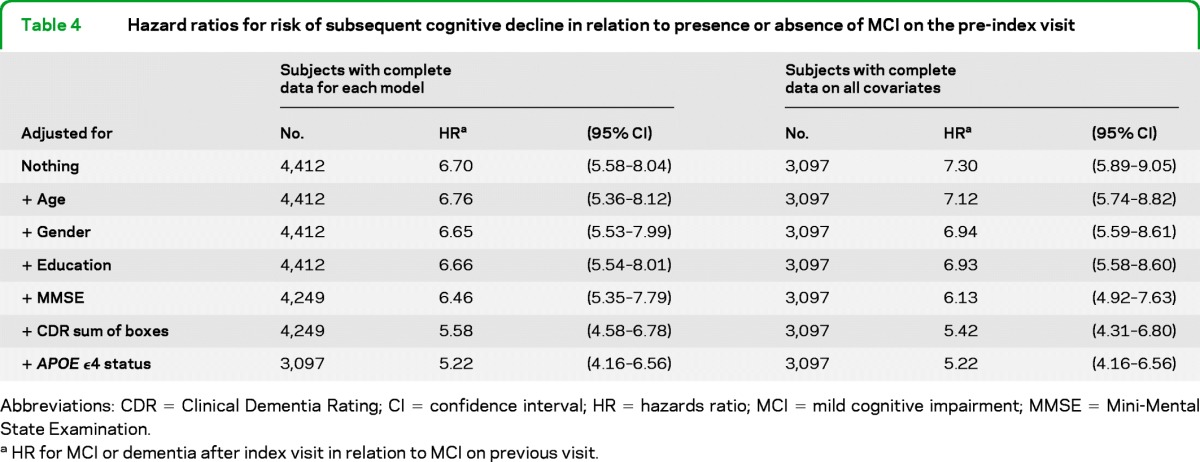
Abbreviations: CDR = Clinical Dementia Rating; CI =confidence interval; HR = hazards ratio; MCI = mild cognitive impairment; MMSE = Mini-Mental State Examination.
HR for MCI or dementia after index visit in relation to MCI on previous visit.
DISCUSSION
In this sample of subjects seen at ADCs, reverting from MCI back to normal or near-normal cognition a year later was fairly common: 16% reverted to < MCI, only slightly fewer than the 20% who progressed to dementia.
These results are similar to previously reported estimates of the rate of reversion in MCI. For example, in the Nun Study, 14.5% of subjects with MCI returned to normal cognition after 11 years of follow-up.3 Subjects more often stayed in their current cognitive state than transitioned to another, which was observed among the ADC subjects as well. Both studies may have underestimated the proportion of subjects returning to normal cognition, as clinicians are not blinded to previous patient diagnoses; clinicians may be disinclined to assign a diagnosis of normal cognition for a patient previously diagnosed as MCI.
Several characteristics were significantly associated with increased odds of improved cognition approximately 1 year later. These included nonamnestic MCI, especially single-domain; less severe MCI, as described by high MMSE score or low CDR sum-of-boxes score; not having an APOE ϵ4 allele; and the clinical attribution of MCI to a transitory condition, such as underlying medical illness or medication. Each of these characteristics (except attribution to a transitory condition) contributed significantly to a multivariable logistic model predicting reversion, suggesting that each factor is important in its own right. Unfortunately, the large amount of missing data on presumed etiology of MCI precluded more detailed analysis of the possible importance of that factor.
The survival analysis results from this study strongly suggested that patients who meet criteria for MCI and then improve remain at increased risk for retransitioning to MCI or dementia over the longer term. This finding held true even after controlling for several covariates associated with cognitive decline. One explanation may be that cognition often varies within individuals over time, so a patient who is just over the threshold to qualify as having MCI may later drop below that threshold if the timing of the next follow-up visit happens to fall during a period of relatively better cognition. Meanwhile, the underlying neurodegenerative process that accounted for the first episode of MCI may remain active and lead to long-term cognitive decline despite day-to-day fluctuations. Likewise, measurement error is inescapable in assessment of cognitive function and may also contribute to variation in classification of a patient's cognitive state over time.
This study had several strengths, including a large sample size, availability of many demographic and clinical characteristics from standardized assessments, and wide geographic scope; however, there were also some limitations. First, we were unable to distinguish reliably between normal cognition and “impaired, not MCI” at the follow-up visit, because of the inconsistent use of the latter category among the ADCs. As noted above, there was also a high frequency of missing data on the presumed MCI etiology at the first visit, as well as on APOE genotype. In addition, ADC subjects constitute a large multicenter case series, not a truly population-based sample; thus, the generalizability of results from ADC subjects to other clinical populations is unknown. Finally, we performed many tests of significance in this analysis, which increases the chance of a Type I error: falsely rejecting the null hypothesis that there is no association between the risk factor and the probability of reversion.
These findings contribute to a dilemma for clinicians who care for patients with MCI. As new treatments of the underlying neurodegenerative process are developed, it will be of critical importance to select candidates for trials who are most likely to be in the early stages of neurodegeneration. Patients with a high likelihood of reverting to normal or near-normal cognition on their own may reap little benefit from antidementia treatments while still being exposed to side effects, risks, and costs. Also, enrolling trial participants who are unlikely to have the targeted disease could affect the results of the trial in terms of both efficacy and risk. Conversely, patients who do revert to normal cognition may experience only a temporary remission of cognitive impairment.
To help resolve this dilemma, we hope that future research may be able to identify a subset of patients with MCI who are likely to recover and not relapse and who thus could be spared unnecessary antidementia treatments.
Supplementary Material
ACKNOWLEDGMENT
The authors thank the NACC Intramural Research Committee members for their suggestions and feedback and George Thomas for database support.
GLOSSARY
- AD
Alzheimer disease
- ADC
Alzheimer's Disease Center
- CDR
Clinical Dementia Rating
- FAQ
Functional Activities Questionnaire
- MCI
mild cognitive impairment
- MI
multiple imputation
- MMSE
Mini-Mental State Examination
- OR
odds ratio
Footnotes
See page 1599
Supplemental data at www.neurology.org.
AUTHOR CONTRIBUTIONS
T.D. Koepsell contributed to study concept and design and interpretation of data, performed statistical analysis, and edited the manuscript for content. S.E. Monsell contributed to the study concept and design, interpretation of data, and drafting the manuscript.
DISCLOSURE
T.D. Koepsell reports no disclosures. S.E. Monsell receives research support from the NIH. Go to Neurology.org for full disclosures.
REFERENCES
- 1. Morris JC, Storandt M, Miller JP, et al. Mild cognitive impairment represents early-stage Alzheimer disease. Arch Neurol 2001; 58: 397– 405 . [DOI] [PubMed] [Google Scholar]
- 2. Gallassi R, Oppi F, Poda R, et al. Are subjective cognitive complaints a risk factor for dementia? Neuro Sci 2010; 31: 327– 336 . [DOI] [PubMed] [Google Scholar]
- 3. Tyas SL, Salazar JC, Snowdon DA, et al. Transitions to mild cognitive impairments, dementia, and death: findings from the Nun Study. Am J Epidemiol 2007; 165: 1231– 1238 . [DOI] [PMC free article] [PubMed] [Google Scholar]
- 4. de Jager CA, Budge MM. Stability and predictability of the classification of mild cognitive impairment as assessed by episodic memory test performance over time. Neurocase 2005; 11: 72– 79 . [DOI] [PubMed] [Google Scholar]
- 5. Nordlund A, Rolstad S, Klang O, Edman A, Hansen S, Wallin A. Two-year outcome of MCI subtypes and aetiologies in the Goteborg MCI study. J Neurol Neurosurg Psychiatry 2010; 81: 541– 546 . [DOI] [PubMed] [Google Scholar]
- 6. Ganguli M, Dodge HH, Shen C, DeKosky ST. Mild cognitive impairment, amnestic type: an epidemiologic study. Neurology 2004; 63: 115– 121 . [DOI] [PubMed] [Google Scholar]
- 7. Larrieu S, Letenneur L, Orgogozo JM, et al. Incidence and outcome of mild cognitive impairment in a population-based prospective cohort. Neurology 2002; 59: 1594– 1599 . [DOI] [PubMed] [Google Scholar]
- 8. Fisk JD, Merry HR, Rockwood K. Variations in case definition affect prevalence but not outcomes of mild cognitive impairment. Neurology 2003; 61: 1179– 1184 . [DOI] [PubMed] [Google Scholar]
- 9. Ganguli M, Snitz BE, Saxton JA, et al. Outcomes of mild cognitive impairment by definition: a population study. Arch Neurol 2011; 68: 761– 767 . [DOI] [PMC free article] [PubMed] [Google Scholar]
- 10. Jack CR, Jr, Knopman DS, Jagust WJ, et al. Hypothetical model of dynamic biomarkers of the Alzheimer's pathological cascade. Lancet Neurol 2010; 9: 119– 128 . [DOI] [PMC free article] [PubMed] [Google Scholar]
- 11. Beekly DL, Ramos EM, Lee WW, et al. The National Alzheimer's Coordinating Center (NACC) database: the Uniform Data Set. Alzheimer Dis Assoc Disord 2007; 21: 249– 258 . [DOI] [PubMed] [Google Scholar]
- 12. Petersen RC, Morris JC. Mild cognitive impairment as a clinical entity and treatment target. Arch Neurol 2005; 62: 1160– 1163, discussion 1167 . [DOI] [PubMed] [Google Scholar]
- 13. Petersen RC, Doody R, Kurz A, et al. Current concepts in mild cognitive impairment. Arch Neurol 2001; 58: 1985– 1992 . [DOI] [PubMed] [Google Scholar]
- 14. Petersen RC. Mild cognitive impairment as a diagnostic entity. J Intern Med 2004; 256: 183– 194 . [DOI] [PubMed] [Google Scholar]
- 15. McKhann G, Drachman D, Folstein M, Katzman R, Price D, Stadlan EM. Clinical diagnosis of Alzheimer's disease: report of the NINCDS-ADRDA Work Group under the auspices of Department of Health and Human Services Task Force on Alzheimer's Disease. Neurology 1984; 34: 939– 944 . [DOI] [PubMed] [Google Scholar]
- 16. Litvan I, Bhatia KP, Burn DJ, et al. Movement Disorder Society Scientific Issues Committee report: SIC Task Force appraisal of clinical diagnostic criteria for Parkinsonian disorders. Mov Disord 2003; 18: 467– 486 . [DOI] [PubMed] [Google Scholar]
- 17. Roman GC, Tatemichi TK, Erkinjuntti T, et al. Vascular dementia: diagnostic criteria for research studies: report of the NINDS-AIREN International Workshop. Neurology 1993; 43: 250– 260 . [DOI] [PubMed] [Google Scholar]
- 18. American Psychiatric Association Diagnostic criteria from DSM-IV. Washington, DC: American Psychiatric Association; 1994 [Google Scholar]
- 19. McKeith IG, Dickson DW, Lowe J, et al. Diagnosis and management of dementia with Lewy bodies: third report of the DLB Consortium. Neurology 2005; 65: 1863– 1872 . [DOI] [PubMed] [Google Scholar]
- 20. Folstein MF, Folstein SE, McHugh PR. “Mini-mental state:” a practical method for grading the cognitive state of patients for the clinician. J Psychiatr Res 1975: 189–198 [DOI] [PubMed] [Google Scholar]
- 21. Pfeffer RI, Kurosaki TT, Harrah CH, Jr, Chance JM, Filos S. Measurement of functional activities in older adults in the community. J Gerontol 1982; 37: 323– 329 . [DOI] [PubMed] [Google Scholar]
- 22. Morris JC. The Clinical Dementia Rating (CDR): current version and scoring rules. Neurology 1993; 43: 2412– 2414 . [DOI] [PubMed] [Google Scholar]
- 23. Sheikh JI, Yesavage JA. Geriatric Depression Scale (GDS): recent evidence and development of a shorter version. Clin Gerontol 1986; 5: 165– 173 . [Google Scholar]
- 24. van Buuren S. Multiple imputation of discrete and continuous data by fully conditional specification. Stat Methods Med Res 2007; 16: 219– 242 . [DOI] [PubMed] [Google Scholar]
- 25. Little RJA, Rubin DB. Statistical Analysis with Missing Data. New York: J. Wiley & Sons; 1987 [Google Scholar]
- 26. Burnham KP, Anderson DR. Model Selection and Multimodel Inference: A Practical Information–Theoretic Approach, 2nd ed New York: Springer; 2002 [Google Scholar]
- 27. Liang KY, Zeger S. Longitudinal data analysis using generalized linear models. Biometrika 1973; 1: 13– 22 . [Google Scholar]
- 28. Rubin DB, Schenker N. Multiple imputation in health-care databases: an overview and some applications. Stat Med 1991; 10: 585– 598 . [DOI] [PubMed] [Google Scholar]
Associated Data
This section collects any data citations, data availability statements, or supplementary materials included in this article.


