

Abstract
Background. The relationships between soluble CD14 (sCD14), endotoxin (lipopolysaccharide [LPS]), and progression of atherosclerosis have not been defined in human immunodeficiency virus (HIV) infection.
Methods. We retrospectively assessed serum sCD14 and LPS levels of 91 subjects in a prospective 3-year study of carotid artery intima-media thickness (CIMT) (AIDS Clinical Trials Group [ACTG] 5078), where subjects were enrolled as risk factor–controlled triads of HIV-uninfected (n = 36) and HIV-infected individuals with (n = 29) or without (n = 26) protease inhibitor (PI)–based therapy for ≥2 years. The primary end point was the yearly rate of change of CIMT (ΔCIMT).
Results. In multivariate analysis of the HIV-infected subjects, each 1 µg/mL above the mean of baseline serum sCD14 corresponded to an additional 1.52 µm/y (95% confidence interval, .07–2.98; P = .04) in the ΔCIMT. Every 100 pg/mL above the mean of baseline serum LPS corresponded to an additional 0.49 µm/y (95% confidence interval, .18–.81; P = .003) in the ΔCIMT. However, in univariate analysis in the HIV-uninfected group sCD14 (P = .33) and LPS (P = .27) levels were not associated with higher ΔCIMT. HIV infection and PI therapy were not associated with baseline serum LPS and sCD14 levels (P > .1).
Conclusions. Our data are among the first to suggest that serum biomarkers of microbial translocation (LPS) and macrophage activation (sCD14) predict subclinical atherosclerosis progression in HIV-infected persons.
(See the editorial commentary by Crowe and Hoy, on pages 1491–3.)
With improved survival, cardiovascular disease has become an increasingly important cause of morbidity and mortality among persons infected with human immunodeficiency virus (HIV) type 1 [1], underscoring the need to better understand the contributors to cardiovascular disease risk. Evidence from clinical studies supports a link between endotoxemia and the development of atherosclerosis and metabolic complications in humans [2, 3]. HIV pathogenesis is characterized by a chronic state of immune activation, which is an independent predictor of disease progression in untreated persons [4]. Although bacterial translocation from the gut has been implicated as a possible cause of this immune activation and thus disease progression [4, 5], its role in the progression of atherosclerosis in HIV-infected persons receiving antiretroviral therapy (ART) remains largely unknown. Previous studies have shown increased serum lipopolysaccharide (LPS) levels in persons with viremia compared with healthy volunteers [6, 7]. LPS is thought to induce systemic immune activation by binding to CD14+ monocytes and macrophages, which consequently produce soluble CD14 (sCD14) [8–10]. Thus, levels of LPS and sCD14 have been used as biomarkers of bacterial translocation and macrophage activation, respectively, but have not been previously studied in of the context of atherosclerosis in HIV infection [5]. In addition, the effect of ART, including protease inhibitor (PI) drugs, on levels of these biomarkers remains largely unknown.
Measurement of carotid artery intima-media thickness (CIMT) using noninvasive B-mode ultrasound is well documented as a measure of subclinical atherosclerosis [11–13], and we used the yearly rate of change in CIMT (ΔCIMT) as the primary end point for this study. Serum sCD14 and LPS levels were determined on cryopreserved samples, and these biomarkers were compared between HIV-infected individuals receiving PI-based treatment, HIV-infected individuals receiving non–PI-based treatment, and HIV-uninfected individuals. The effects of HIV infection and PI treatment on levels of these serum biomarkers over time were evaluated. Finally, we examined the association between baseline serum sCD14 and LPS with the progression of atherosclerosis as evaluated by the yearly rate of change in CIMT in each of these groups.
MATERIALS AND METHODS
Study Design
A5078 was a prospective, matched cohort study that was designed to investigate the roles of PI therapy and HIV infection on the progression of atherosclerosis; the study design and primary results have been published elsewhere [11, 12]. The study enrolled 133 individuals in 45 triads (groups of 3 individuals matched by age, sex, race or ethnicity, smoking status, blood pressure, and menopause status); detailed inclusion and exclusion criteria have been described elsewhere [11, 12]. Each triad consisted of 1 individual from each of the following groups: (1) HIV-infected individuals with continuous use of PI-based therapy for ≥2 years, (2) HIV-infected individuals receiving ART without prior PI use, and (3) HIV-uninfected individuals. Atherosclerosis, measured as CIMT, was determined at weeks 0, 24, 48, 72, 96, and 144 in the 3 groups, as described elsewhere [11–13]. Using 182 cryopreserved samples from 91 subjects in this prospective study, serum sCD14 and LPS levels were measured in 2 specimens from week 0 and week 96 (if there was no week 144 specimen) or 144. Among the 91 subjects, 41 triads were represented, of which 15 were complete. We investigated whether there are associations between PI-based treatment, HIV infection, CIMT, serum sCD14, and serum LPS.
Data Collection
The CIMT at the far wall of the right distal common carotid artery was measured at baseline and longitudinally [9–11]. Baseline variables of fasting blood glucose levels, blood lipid levels, cardiovascular disease–related measurements, blood CD4+ T-cell counts, plasma HIV RNA levels, and serum levels of metabolic markers, including homocysteine, high-sensitivity C-reactive protein (hs-CRP), and insulin, had been previously determined [11, 12]. Metabolic syndrome was defined by National Cholesterol Education Program criteria [14]. Serum sCD14 levels were quantified by enzyme-linked immunosorbent assay (ELISA) in accordance with the manufacturer's protocol (Quantikine ELISA; R&D Systems). The limit of detection of this assay was 125 pg/mL and the intra- and interassay variability were 3.5% ± 1.37% and 5.0% ± 2.8%, respectively. Serum LPS levels were measured using the PyroGene Recombinant Factor C Assay Limulus assay (Lonza), as described elsewhere [15]. The limit of detection of this assay was 0.01 endotoxin units/mL, and the intra- and interassay variability were 5.2% ± 3.37% and 10.1% ± 3.4%, respectively.
Power Calculations
The primary objective evaluated 2 pairwise differences in yearly rates of change between groups. Based on available A5078 data, we assumed 30 evaluable subjects per group. Using a 2-sided, .05-level, 2-sample t test with 2 comparisons, we had the ability detect a difference of 0.8 times the common standard deviation of the yearly rate of change in the outcome with 80% power.
Statistical Methods
Subjects were matched within triads. Matched analysis comparing the 2 HIV groups (18 triad pairs) assessed for an effect of PI therapy on the yearly rate of change in sCD14 and LPS. The HIV/non-PI and HIV-uninfected groups (21 triad pairs; or combined HIV group vs uninfected group if there was no difference between the 2 HIV groups) were compared to assess the effect of HIV infection on the yearly rate of change in sCD14 and LPS. A variation on the Wilcoxon signed-rank test was used to compare the 2 HIV-infected subjects with the HIV-uninfected control subject in each triad [16]. Mixed-models linear regression analyses with the triad as a random effect were used to evaluate whether baseline measurements of serum sCD14, serum LPS, and CIMT were associated with baseline covariates. Associations between the yearly rate of change in CIMT and baseline covariates were examined using a repeated measures analysis. Covariates univariately associated with the outcome (P < .05) were examined together using the backward elimination method to build the final multivariate model. SAS software (version 9.2 PROC MIXED) was used for all regression analyses.
RESULTS
Comparison of Baseline Characteristics of Subjects
Baseline data from the 91 subjects in this study are summarized in Table 1. Twenty-four subjects (26%) had 96 weeks of follow-up, and 67 (74%) had 144 weeks. The age, race or ethnicity, and group membership of the subjects who dropped out of the study after week 96 did not differ from those who completed the week 144 visit. In the 55 HIV-infected subjects, the median blood CD4+ T-cell count was 488 cells/mm3, and 84% had HIV plasma viremia <50 copies/mL (maximum, 379 copies/mL). The median duration of PI use was 190 weeks at baseline in the HIV-infected PI group. The HIV-infected groups had comparable CD4+ T-cell counts, nadir CD4+ T-cell counts, plasma viremia, and usage of nucleoside reverse transcriptase inhibitors at baseline. Overall, these data indicate that there were no major differences in anthropometric characteristics between the 3 groups in our study and that the 2 HIV-infected groups were comparable in terms of CD4+ T-cell counts and plasma viremia.
Table 1.
Baseline Subject Variables by Group
| HIV Infected |
||||
|---|---|---|---|---|
| Variable | Total (n = 91) | PI Treatment (n = 29) | Non-PI Treatment (n = 26) | HIV Uninfected (n = 36) |
| Sex | ||||
| Male | 84 (92) | 28 (97) | 24 (92) | 32 (89) |
| Female | 7 (8) | 1 (3) | 2 (8) | 4 (11) |
| Race or ethnicity | ||||
| White non-Hispanic | 69 (76) | 23 (79) | 19 (73) | 27 (75) |
| Hispanic (regardless of race) | 17 (19) | 4 (14) | 5 (19) | 8 (22) |
| Asian, Pacific Islander | 3 (3) | 0 (0) | 2 (8) | 1 (3) |
| Other/unknown | 2 (2) | 2 (7) | 0 (0) | 0 (0) |
| Age, median (IQR), y | 41 (36–45) | 41 (38–45) | 41 (36–47) | 40 (36–45) |
| BMI, median (IQR), kg/m2 | 24.70 (23.40–27.60) | 25.50 (23.60–27.60) | 24.20 (22.00–26.60) | 25.00 (23.75–27.95) |
| Waist circumference ≥90 cma | 40 (44) | 17 (59) | 7 (27) | 16 (44) |
| Waist-hip ratio, median (IQR)a | 0.91 (0.86–0.94) | 0.93 (0.92–0.96) | 0.90 (0.86–0.94) | 0.89 (0.83–0.92) |
| Metabolic syndrome | 11 (12) | 9 (31) | 1 (4) | 1 (3) |
| Lipid-lowering medications | 12 (13) | 8 (28) | 4 (15) | 0 (0) |
| Metabolic parameters | ||||
| Fasting blood glucose <126 mg/dl | 91 (100) | 29 (100) | 26 (100) | 36 (100) |
| Total cholesterol ≥200 mg/dL | 43 (47) | 20 (69) | 9 (35) | 14 (39) |
| Direct LDL cholesterol ≥100 mg/dLb | 64 (72) | 22 (81) | 17 (65) | 25 (69) |
| HDL cholesterol <35 mg/dL | 20 (22) | 7 (24) | 6 (23) | 7 (19) |
| Triglycerides ≥150 mg/dL | 39 (43) | 18 (62) | 11 (42) | 10 (28) |
| Non-HDL cholesterol, median (IQR), mg/dL | 149 (128–187) | 184 (134–206) | 135 (118–170) | 145 (125–172) |
| Insulin, median (IQR), mU/Lc | 6.25 (5.00–8.00) | 7.40 (6.20–14.50) | 5.55 (4.55–7.15) | 6.00 (5.00–7.60) |
| Inflammatory parameters | ||||
| hs-CRP, median (IQR), mg/L | 1.10 (0.50–2.30) | 1.40 (0.80–3.30) | 1.00 (0.40–3.40) | 1.00 (0.50–1.80) |
| Homocysteine, median (IQR), µmol/L | 9.10 (7.40–11.00) | 9.20 (7.90–13.80) | 7.60 (6.35–8.80) | 9.70 (8.70–11.00) |
| HIV disease–related parameters | (n = 55) | (n = 29) | (n = 26) | |
| Baseline CD4+ T-cell count, median (IQR), cells/mm3 | 488 (354–692) | 535 (369–707) | 477 (334–674) | … |
| Nadir CD4+ T-cell count ≤200 cells/mm3d | 20 (38) | 11 (39) | 9 (35) | … |
| HIV RNA <50 copies/mL | 46 (84) | 24 (83) | 22 (85) | … |
| Duration of ART, median (IQR), wke | 156 (123–269) | 250 (152–359) | 117 (60–140) | … |
| Duration of PI use, median (IQR), wkf | 113 (0–238) | 190 (135–259) | 0 (0–0) | … |
| Any ritonavir use | 9 (16) | 9 (31) | 0 (0) | … |
| Any NRTI use | 52 (57.1) | 27 (93.1) | 25 (96.2) | … |
| Any NNRTI use | 28 (30.8) | 8 (27.6) | 20 (76.9) | … |
Abbreviations: ART, antiretroviral therapy; BMI, body mass index; HDL, high-density lipoprotein; HIV, human immunodeficiency virus; hs-CRP, high-sensitivity C-reactive protein; IQR, interquartile range; LDL, low-density lipoprotein NNRTI, nonnucleoside reverse-transcriptase inhibitor; NRTI, nucleoside reverse-transcriptase inhibitor; PI, protease inhibitor.
Except where otherwise indicated, data represent No. (%) of subjects.
a Because of missing data, the sample sizes were n = 90, n = 28, n = 26, and n = 36, respectively.
b Because of missing data, the sample sizes were n = 89, n = 27, n = 26, and n = 36, respectively.
c Because of missing data, the sample sizes were n = 84, n = 27, n = 24, and n = 33, respectively.
d Because of missing data, the sample sizes were n = 53, n = 27, and n = 26, respectively.
e P < .001 (Wilcoxon P value for group differences: HIV infected vs uninfected and HIV/PI vs HIV/non-PI vs uninfected).
f Within the HIV/PI and HIV/non-PI groups, the choice of baseline ART varied. In the PI group, 18 subjects (62%) received a single PI (8 nelfinavir, 8 indinavir, and 2 ritonavir), 3 received lopinavir-ritonavir, and 8 received a dual-PI combination (1 did not include ritonavir). Overall, 12 subjects (41%) within the PI group were receiving ritonavir as part of their therapy. In the non-PI group, 20 (77%) were receiving a combination NNRTIs and nucleoside analogues, 5 (19%) were receiving nucleoside analogues only, and 1 (4%) was receiving no ART.
Comparisons of Metabolic Parameters Between Study Groups
Baseline values for metabolic parameters are also summarized in Table 1. In a matched analysis in 26 triads, subjects in the HIV-infected PI group had higher cholesterol and hs-CRP levels at baseline and at week 96, higher baseline triglyceride levels, and higher low-density lipoprotein cholesterol levels at week 96 than the HIV-uninfected group (all P < .05). Subjects in the HIV-infected non-PI group had higher triglyceride levels at week 96 than the HIV-uninfected group in 21 matched triads (P = .005). In a matched baseline analysis, subjects in the HIV-infected PI group had a higher proportion of metabolic syndrome than the HIV-infected non-PI group (26 triads), who, in turn, had a higher proportion than the HIV-uninfected group (21 triads) (all P < .01). There were no significant trends over time within any group for all the metabolic parameters (P > .05) (Supplementary Table). Overall, these findings show that the HIV-infected subjects in our cohort had a higher rate of metabolic abnormalities than the HIV-uninfected subjects.
HIV Infection and PI Treatment: No Association With Changes in CIMT
A5078 was initially designed to investigate the roles of PI therapy and HIV infection in the progression of atherosclerosis. Consistent with our earlier findings on the entire cohort, there were no statistically significant differences in either baseline CIMT or yearly rates of change in CIMT between the PI and non-PI HIV-infected groups (P > .2) (Table 2). There were also no statistically significant differences in either baseline CIMT or yearly rates of change in CIMT between the combined HIV-infected group and the HIV-uninfected group (P > .4). However, both the combined HIV-infected and HIV-uninfected groups had significantly greater CIMT by 96 or144 weeks compared with baseline CIMT (non-zero yearly rates of change in CIMT) (P < .001). Thus, although there were changes in CIMT over time in HIV-infected and HIV-uninfected groups, there was no significant association of HIV infection and PI therapy on baseline CIMT or its rate of change over the duration of the study.
Table 2.
Summary of Carotid Artery Intima-Media Thickness (CIMT), Soluble CD14 (sCD14), and Lipopolysaccharide (LPS) Results
| HIV Infected |
||||||
|---|---|---|---|---|---|---|
| Characteristic | Total (n = 91) | Total (n = 55) | PI Treatment (n = 29) | Non-PI Treatment (n = 26) | HIV Uninfected (n = 36) | P |
| Baseline CIMT, µm | 707.5 (640.0–767.0) | 715.0 (640.0–771.0) | 752.0 (631.0–778.5) | 701.3 (669.5–760.5) | 684.0 (639.5–758.0) | .48, .56a |
| Rate of change in CIMT, µm/y | 8.6 (0.3–14.1) | 8.6 (−2.3 to 14.0) | 11.6 (1.4–16.0) | 6.3 (−7.0 to 13.3) | 8.6 (3.9–14.4) | .81, .28, .89, .01b |
| Baseline sCD14, µg/mL | 1.8 (1.1–2.6) | 2.3 (1.6–3.0) | 2.4 (1.6–3.3) | 2.3 (1.7–2.8) | 1.2 (0.9–1.8) | <.001, <.001a |
| sCD14 at wk 96 or 144, µg/mL | 2.0 (1.3–2.5) | 2.2 (1.8–2.9) | 2.2 (1.9–4.00) | 2.2 (1.8–2.7) | 1.3 (1.0–1.8) | <.001, <.001a |
| Rate of change in sCD14, µg/mL/y | 0.03 (−0.15 to 0.22) | 0.07 (−0.15 to 0.27) | 0.08 (−0.15 to 0.27) | 0.07 (−0.13 to 0.27) | −0.01 (−0.13 to 0.13) | .35, .97, .61, .68b |
| Baseline LPS, pg/mL | 453.2 (243.5–795.5) | 439.4 (207.1–719.5) | 453.2 (273.5–635.9) | 352.5 (189.2–939.2) | 496.6 (246.4–1040.3) | .26, .52a |
| LPS at wk 96 or 144, pg/mL | 576.7 (229.0–1703.6) | 559.8 (191.3–1372.5) | 559.8 (191.1–1299.1) | 641.5 (285.7–1372.5) | 613.5 (293.3–2376.6) | .46, .64a |
| Rate of change in LPS, pg/mL/y | 40.7 (−56.3 to 350.8) | 50.7 (−54.0 to 284.9) | 25.3 (−63.7 to 268.8) | 60.6 (−45.2 to 284.9) | 39.2 (−67.4 to 459.00) | .95, .55, .65, .08b |
Abbreviations: HIV, human immunodeficiency virus; PI, protease inhibitor.
Data are given as medians (interquartile ranges).
a Wilcoxon P value for group differences: HIV infected vs uninfected and HIV/PI vs HIV/non-PI vs uninfected.
b Wilcoxon P value for matched group differences within each visit week: pairings assessed were HIV infected vs uninfected (32 matched pairings), HIV/PI vs HIV/non-PI (18 matched pairings), HIV/PI vs uninfected (26 matched pairings), and HIV/non-PI vs uninfected (21 matched pairings).
Factors Associated With Baseline CIMT
We investigated factors that were associated with baseline CIMT identified by both univariate and multivariate regression models and sought to determine whether biomarkers of macrophage activation and bacterial translocation can predict baseline CIMT (Table 3). Variables that were significantly (P < .05) associated with higher baseline CIMT in univariate analysis included older age, male sex, white race, and higher baseline body mass index (BMI), but not sCD14 or LPS level. In multivariate analysis, only white race and higher baseline BMI were significantly associated with higher baseline CIMT. Within the combined HIV-infected group, male sex and higher baseline BMI were significantly associated with higher baseline CIMT in the multivariate analysis (Table 4). These results show that anthropometric characteristics rather than biomarkers of macrophage activation and bacterial translocation were significantly associated with baseline CIMT.
Table 3.
Predictors of Carotid Artery Intima-Media Thickness (CIMT) in All Subjects
| Covariate | All Subjects |
|||
|---|---|---|---|---|
| Univariate Models |
Multivariate Models |
|||
| Parameter Estimate (95% CI) | P | Parameter Estimate (95% CI) | P | |
| Baseline CIMT (per µm) | ||||
| Baseline sCD14 (per 1 µg/mL) | −6.90 (−15.97 to 2.17) | .130 | … | … |
| Baseline LPS (per 100 pg/mL) | −0.84 (−2.86 to 1.18) | .410 | … | … |
| Age (per 10 y) | 39.15 (12.04…66.266) | .006 | … | … |
| Female sex | −81.30 (−157.16 to −5.44) | .036 | … | … |
| Nonwhite vs white | −59.56 (−106.10 to −13.02) | .013 | −65.39 (−111.10 to −19.89) | .006 |
| BMI (per kg/m2) | 9.53 (3.66–15.37) | .002 | 10.01 (4.28–15.74) | .001 |
| Waist-hip ratio (per 0.1 unit) | 26.65 (−1.21 to 54.51) | .060 | … | … |
| Insulin (per 10 mU/L) | 30.68 (−1.68 to 63.03) | .063 | … | … |
| Yearly rate of change in CIMT (per 1 µm/y) | ||||
| Baseline sCD14 (per 1 µg/mL) | 1.35 (.14–2.53) | .029 | 1.62 (.44–2.79) | .007 |
| Baseline LPS (per 100 pg/mL) | 0.36 (.11–.62) | .005 | 0.42 (.17–.68) | .001 |
| HDL cholesterol (reference, ≥35 mg/dL) | −5.05 (−10.70 to .61) | .080 | … | … |
| Body mass index (per kg/m2) | −0.88 (−1.77 to −.02) | .055 | … | … |
| Yearly rate of change in sCD14 (per 1 µg/mL/y) | −4.53 (−8.71 to −.36) | .034 | … | … |
Abbreviations: BMI, body mass index; CI, confidence interval; HDL, high-density lipoprotein; LPS, lipopolysaccharide; sCD14, soluble CD14.
P < .10 for all predictors, except baseline sCD14 and LPS. The reference group used for determination of the parameter estimate was clarified as needed. In univariate analysis, the baseline covariates considered were age, sex, race, fasting lipid measurements (total cholesterol, low-density lipoprotein cholesterol, HDL cholesterol, triglycerides, and non-HDL cholesterol), use of lipid-lowering drugs, fasting glucose, BMI, waist circumference, waist-hip ratio, insulin, high-sensitivity C-reactive protein, homocysteine, sCD14, and LPS. Only covariates significant (P < .05) in univariate analysis were considered in the multivariate models; the final multivariate models in this table include only the covariates remaining significant.
Table 4.
Predictors of Carotid Artery Intima-Media Thickness (CIMT) in Human Immunodeficiency Virus (HIV)–Infected and HIV-Uninfected Subjects
| Covariate | HIV-Uninfected Subjects |
HIV-Infected Subjects |
||||||
|---|---|---|---|---|---|---|---|---|
| Univariate Models |
Multivariate Models |
Univariate Models |
Multivariate Models |
|||||
| Parameter Estimate (95% CI) | P | Parameter Estimate (95% CI) | P | Parameter Estimate (95% CI) | P | Parameter Estimate (95% CI) | P | |
| Baseline CIMT (per µm) | ||||||||
| Baseline sCD14 (per 1 µg/mL) | −9.34 (−33.77 to 15.09) | .442 | … | … | −8.06 (−20.39 to 4.28) | .190 | … | … |
| Baseline LPS (per 100 pg/mL) | 1.53 (−1.64 to 4.70) | .333 | … | … | −1.46 (−4.08 to 1.16) | .260 | … | … |
| Age (per 10 y) | … | … | … | … | 48.91 (14.97–82.84) | .007 | … | … |
| Female sex | … | … | … | … | −159.6 (−279.9, −39.29) | .012 | −173.8 (−290.2 to −57.48) | .006 |
| Nonwhite vs white | −49.48 (−106.20 to 7.20) | .085 | … | … | −70.39 (−137.6 to −3.222) | .041 | … | … |
| BMI (per kg/m2) | … | … | … | … | 9.11 (.14–18.07) | .047 | 10.35 (1.815–18.89) | .020 |
| Waist-hip ratio (per 0.1 unit) | … | … | … | … | 42.81 (−1.15 to 86.78) | .056 | … | … |
| Direct LDL cholesterol (reference, ≥100 mg/dL) | −47.63 (−100.80 to 5.53) | .077 | … | … | … | … | … | … |
| Yearly rate of change in CIMT (per 1 µm/y) | ||||||||
| Baseline sCD14 (per 1 µg/mL) | 1.55 (−1.56 to 4.67) | .326 | … | … | 1.56 (.10–3.03) | .037 | 1.52 (.07–2.98) | .041 |
| Baseline LPS (per 100 pg/mL) | 0.24 (−.19 to .67) | .267 | … | … | 0.44 (.13–.75) | .005 | 0.49 (.18–.81) | .003 |
| HDL cholesterol (reference, ≥35 mg/dL) | … | … | … | … | −9.80 (−17.42 to −2.17) | .012 | 7.71 (.21–15.22) | .044 |
| BMI (per kg/m2) | … | … | … | … | −1.21 (−2.38 to −.04) | .042 | … | … |
| Yearly rate of change in sCD14 (per 1 µg/mL/y) | … | … | … | … | −5.06 (−9.97 to −.15) | .044 | … | … |
| Years of PI exposure (per 1 y) | … | … | … | … | 1.06 (−.14 to 2.25) | .083 | … | … |
Abbreviations: BMI, body mass index; CI, confidence interval; HDL, high-density lipoprotein; LDL, low-density lipoprotein; LPS, lipopolysaccharide; PI, protease inhibitor; sCD14, soluble CD14.
P < .10 for all predictors, except baseline sCD14 and LPS In univariate analysis, The reference group used for determination of the parameter estimate was clarified as needed. The baseline covariates considered for all subjects were age, sex, race, fasting lipid measurements (total cholesterol, LDL cholesterol, HDL cholesterol, triglycerides, and non-HDL cholesterol), use of lipid-lowering drugs, fasting glucose, body mass index, waist circumference, waist-hip ratio, insulin, high-sensitivity C-reactive protein, homocysteine, sCD14, and LPS. For the HIV-infected subjects, additional covariates included years of PI use, CD4+ T-cell counts, and nadir CD4+ T-cell counts. Only covariates significant (P < .05) in univariate analysis were considered in the multivariate models; the final multivariate models in this table include only the covariates remaining significant.
Factors Associated With Change in CIMT Over Time
We then determined the factors that were associated with progression of atherosclerosis, defined as the yearly rate of change in CIMT (Table 3). Those significantly (P < .05) associated with a positive yearly rate of change in CIMT in univariate analysis included higher baseline serum sCD14 and LPS, and lower yearly rate of change in serum sCD14 levels. In multivariate analysis, higher baseline levels of serum sCD14 and serum LPS were associated with a positive yearly rate of change in CIMT. Similar results were observed for the combined HIV-infected group (Table 4; Figure 1). However, in univariate analysis in the HIV-uninfected group, none of the above parameters, including sCD14 (P = .33) and LPS (P = .27) were associated with yearly rate of change in CIMT (Table 4). Overall, these findings indicated that baseline serum biomarkers of microbial translocation and macrophage activation (LPS and sCD14) were significantly associated with progression of subclinical atherosclerosis.
Figure 1.
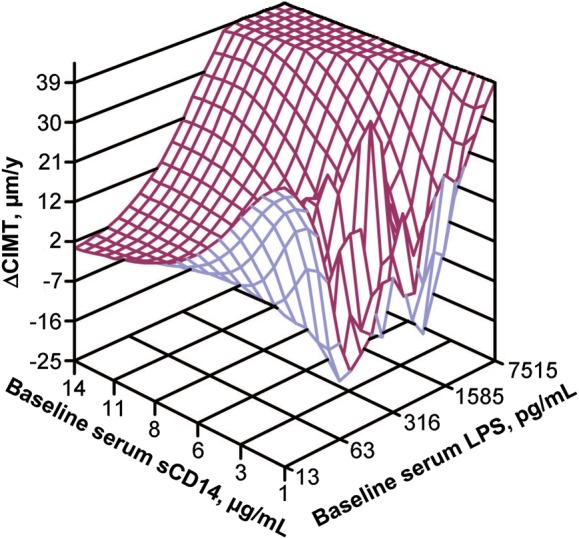
Three-dimensional surface plot illustrating the relationship of the yearly rate of change in carotid artery intima-media thickness (ΔCIMT) (z-axis) with baseline levels of soluble CD14 (sCD14) (x-axis) and baseline levels of lipopolysaccharide (LPS) (y-axis) for the 55 human immunodeficiency virus–infected subjects in the study.
Factors Associated With Higher Baseline sCD14 Levels
Determination of factors that affect serum sCD14 and LPS is important for studying the possible association of these biomarkers with progression of atherosclerosis in longitudinal studies. We first determined the effect of HIV infection and PI therapy on serum sCD14 levels. As shown in Table 2, at weeks 0 and week 96 or 144, serum sCD14 levels were significantly higher in the HIV groups singly and combined than in the HIV-uninfected group (both P < .001). However, in a matched analysis, there was no statistically significant difference between the rates of change in sCD14 levels between the PI- and non-PI- treated HIV groups (P = .97). There was no statistically significant difference in the rates of change of serum sCD14 levels between the combined HIV group and the HIV-uninfected group (P = .35). Within each of the 3 groups, serum sCD14 levels at baseline were not significantly different than sCD14 levels at 96 or 144 weeks (no statistically significant non-zero yearly rate of change of sCD14). These data demonstrate that HIV infection, but not PI therapy, is associated with higher baseline sCD14 but not with the rate of changes of sCD14 over the time interval of this study.
We then identified factors that were associated with baseline serum sCD14 levels as assessed by univariate and multivariate regression models (Table 5). In multivariate analysis, higher baseline serum sCD14 levels were significantly (P < .05) associated with higher baseline hs-CRP levels, whereas lower levels were significantly associated with baseline triglyceride levels <150 mg/dL or with HIV infection. Similar multivariate results were found within the combined HIV-infected group: higher levels of baseline serum sCD14 were significantly associated with higher baseline hs-CRP levels, whereas lower levels were significantly associated with baseline triglyceride levels <150 mg/dL. Thus, hs-CRP, a biomarker of systemic inflammation, and baseline triglycerides, an energy source for macrophages, were significantly associated with baseline levels of sCD14, a biomarker of macrophage activation.
Table 5.
Predictors of Soluble CD14 (sCD14) and Lipopolysaccharide (LPS) Levels
| Covariate | All Subjects |
HIV-Infected Subjects |
||||||
|---|---|---|---|---|---|---|---|---|
| Univariate Models |
Multivariate Models |
Univariate Models |
Multivariate Models |
|||||
| Parameter Estimate (95% CI) | P | Parameter Estimate (95% CI) | P | Parameter Estimate (95% CI) | P | Parameter Estimate (95% CI) | P | |
| Baseline sCD14 (per 1 µg/mL) | ||||||||
| CIMT (per 1 µm) | −0.004 (−.008 to .001) | .094 | … | … | −0.005 (−.011 to .001) | .120 | … | … |
| Baseline LPS (per 100 pg/mL) | −0.033 (−.074 to .008) | .110 | … | … | −0.034 (−.092 to .024) | .240 | … | … |
| HIV infected vs HIV uninfected | −1.185 (−1.958 to −.412) | .003 | −0.781 (−1.488 to −.074) | .03 | … | … | … | … |
| Triglycerides (reference, ≥150 mg/dL) | −1.334 (−2.087 to −.582) | .001 | −0.924 (−1.625 to −.223) | .01 | −1.347 (−2.516 to −.177) | .027 | −1.037 (−1.899 to −.175) | .021 |
| Use of lipid-lowering drugs | 1.045 (−.110 to 2.200) | .075 | … | … | … | … | … | … |
| BMI (per kg/m2) | −0.124 (−.270 to .022) | .094 | … | … | … | … | … | … |
| Waist-hip ratio (per 0.1 unit) | 0.813 (.204–1.422) | .010 | … | … | 0.906 (−.083 to 1.894) | .070 | … | … |
| Insulin (per 10 mU/L) | 0.711 (−.068 to 1.491) | .073 | … | … | 0.966 (−.135 to 2.067) | .082 | … | … |
| hs-CRP (per 10 mg/L) | 2.001 (1.326–2.676) | <.001 | 1.812 (1.180–2.444) | <.001 | 2.936 (2.084–3.789) | <.001 | 2.858 (2.090–3.625) | <.001 |
| Homocysteine (per 10 µmol/L) | 0.747 (−.080 to 1.575) | .076 | … | … | … | … | … | … |
| Baseline LPS (per 100 pg/mL) | ||||||||
| CIMT (per 1 µm) | −0.014 (−.033 to .006) | .180 | … | … | −15.168 (−30.498 to .162) | .052 | … | … |
| Baseline sCD14 (per 1 µg/mL) | −0.450 (−1.257 to .357) | .270 | … | … | −0.171 (−.831 to .490) | .590 | … | … |
| Female sex | 10.237 (.377 to 20.097) | .042 | … | … | … | … | … | … |
| Triglycerides (reference, ≥150 mg/dL) | −2.852 (−5.893 to .189) | .065 | … | … | … | … | … | … |
| BMI (per kg/m2) | … | … | … | … | −0.350 (−.768 to .068) | .095 | … | … |
Abbreviations: BMI, body mass index; CI, confidence interval; HDL, high-density lipoprotein; hs-CRP, high-sensitivity C-reactive protein; LDL, low-density lipoprotein.
P < .10 for all predictors, except baseline CIMT, sCD14, and LPS. The reference group used for determination of the parameter estimate was clarified as needed. In univariate analysis, the baseline covariates considered for all subjects were age, sex, race, fasting lipid measurements (total cholesterol, low-density lipoprotein cholesterol, HDL cholesterol, triglycerides, and non-HDL cholesterol), use of lipid-lowering drugs, fasting glucose, BMI, waist circumference, waist-hip ratio, insulin, hs-CRP, homocysteine, sCD14, LPS, and CIMT. For the HIV-infected subjects, additional covariates included years of protease inhibitor use, CD4+ T-cell counts, and nadir CD4+ T-cell counts. Only covariates significant (P < .05) in univariate analysis were considered in the multivariate models; the final multivariate models in this table include only the covariates remaining significant.
HIV Infection and PI Treatment: No Association With Significant Changes in Serum LPS Levels
We next determined the effect of HIV infection and PI therapy on LPS. Baseline serum LPS levels in the HIV-uninfected group were not significantly different than in either HIV group (with or without PI treatment) or the combined HIV group (all P > .2; Table 2). Considering the effect of PI therapy on serum LPS levels in a matched analysis, there were no significant differences in the yearly rates of change in serum LPS levels between the 2 HIV groups (P = .55). Furthermore, the yearly rates of change in LPS between the combined HIV group and the HIV-uninfected group were statistically indistinguishable (P = .95). Within each of the 3 groups, serum LPS levels at baseline were not significantly different than levels at 96 or 144 weeks (no statistically significant non-zero yearly rate of change in LPS) (all P > .05). Finally we investigated factors that were significantly (P < .05) associated with baseline serum LPS levels identified by univariate models (Table 5). In univariate regression analysis, female sex was the only factor significantly associated with higher baseline levels, but this was not observed in the combined HIV-infected group. In summary, LPS levels did not significantly change over time within the study groups, and there was no significant effect of HIV infection and PI therapy or other factors on serum LPS levels.
DISCUSSION
These data are the first to demonstrate that the serum sCD14 and LPS biomarkers of inflammation are associated with the progression of subclinical atherosclerosis, providing a potentially unifying etiology for the observed increased risk of cardiovascular disease in HIV-infected individuals [17, 18].
Atherosclerosis is an inflammatory process in which activated macrophages [19] and T cells play important roles [20–23]. LPS is a potent stimulant of monocytes/macrophages, which express high levels of the key endotoxin receptor, the Toll-like receptor 4/CD14 complex [19] that may be associated with increased risk for cardiovascular disease in humans [3]. LPS has also been proposed to be a central mediator of HIV-induced chronic immune activation, which is believed to play a pivotal role in progression of HIV infection [6,23,24].
Thus, serum sCD14, a biomarker of monocyte response to LPS, has been described elsewhere as a plasma marker of atherosclerosis in HIV-uninfected persons [25]. Although elevated serum sCD14 is an independent predictor of mortality in HIV infection [15], to our knowledge there are no data on the factors affecting serum sCD14 levels and the yearly rate of change in serum sCD14 in HIV-infected and HIV-uninfected subjects.
Both serum sCD14 and LPS levels remained stable over time within each group, and thus we were unable to assess possible differences in their rates of change between groups. In multivariate analysis in all subjects, higher baseline serum hs-CRP levels, lower serum triglyceride levels, and HIV infection had significant associations with higher baseline levels of serum sCD14.
A positive association between serum hs-CRP and sCD14 has been shown in other inflammatory conditions [26, 27], and we found a similar association in HIV-infected individuals, who also had significantly elevated levels of sCD14 compared with HIV-uninfected individuals. Although there are limited data on the association of serum triglycerides with sCD14, a common polymorphism in the promoter for the CD14 gene has been associated with serum triglyceride levels in nondiabetic individuals, suggesting that sCD14 and triglycerides may be interdependent [28].
HIV infection may produce a phenotype of lipid-rich inflamed atherosclerotic plaques that may be vulnerable to rupture, potentially through up-regulated monocyte/macrophage activation [29, 30]. However, correlates of macrophage phenotype and cardiovascular disease are poorly characterized [19] in individuals receiving ART who have suppressed viremia.
In this substudy of A5078 [11, 12], we found that baseline serum sCD14 and LPS levels were positively associated with the yearly rate of change in CIMT in both the overall study population and HIV-infected subjects only. However, the strength for predicting subclinical atherosclerosis progression in HIV-infected persons was greater for conventional atherosclerosis risk factors, such as high-density lipoprotein cholesterol, than for LPS or sCD14.
Consistent with our results, Burdo et al demonstrated that HIV-infected subjects with few conventional risk factors can have noncalcified disease that may be related to monocyte/macrophage activation, as measured by serum sCD163 levels [30]. Although these data suggested that monocyte/macrophage activation may contribute to subclinical atherosclerosis, our prospective study with longitudinal measurements of CIMT up to 3 years is the first, to our knowledge, to demonstrate that monocyte/macrophage activation may contribute to progression of atherosclerosis in HIV-infected subjects with low-level viremia, independent of conventional risk factors. Our results extend prior data that showed endothelial dysfunction among HIV-infected subjects with long-standing low-level viremia [31].
CD14 can have both a stimulatory and inhibitory effect on inflammation in the setting of sCD14–LPS–host cell interactions [8, 32]. Thus, determining factors that affect baseline serum LPS in HIV-infected and HIV-uninfected subjects is important when studying the possible association of LPS and sCD14 with progression of atherosclerosis. ART with PI was not associated with baseline serum levels of LPS and sCD14 in our small study. Although it has been suggested that PIs can have immunomodulatory effects by blocking the Toll-like receptor– and tumor necrosis factor α–mediated NF-kB activation and proinflammatory cytokine production [33], previous studies have indicated that ART does not induce a significant decline in microbial translocation and LPS levels [34, 35].
Similar to findings in previous studies [15, 30], serum LPS levels did not correlate with sCD14 in our study. It may be the nature of the host response to LPS rather than the amount of LPS that determines macrophage activation [32, 36]. Contrary to previous studies, we failed to demonstrate differences in serum LPS levels between HIV-infected and HIV-uninfected subjects [15]. This could be explained by variability in host factors and/or the method of LPS measurement [37, 38] as well as the small size of our study compared with other studies [15].
We demonstrated that baseline levels of serum LPS are associated with progression of atherosclerosis (yearly rate of change in CIMT) in HIV-infected persons. Previous cross-sectional studies have shown that LPS is not associated with development of subclinical atherosclerosis in HIV-infected subjects [30] and that LPS is not an independent predictor of mortality in HIV infection [15], in contrast to sCD14. However, the effects of chronically elevated microbial translocation into the bloodstream on the cytokine milieu and activation of monocytes/macrophages and vascular endothelium in the setting of HIV infection are not reversed by ART [19, 39]. Indeed, treatment of mice with LPS induces development of early atheroma formation [40]. Thus, our results suggest that increased microbial translocation during chronic HIV infection may be linked pathogenetically to progression of atherosclerosis in HIV-infected individuals.
Limitations of our study include the nonrandomized design, the variable duration of follow-up in this cohort, and the small sample size, especially for the HIV-uninfected group. Finally, our study was not designed to detect the effects of the various antiretroviral drugs.
Together, these data lend insight into the dynamic process by which cardiovascular disease develops among HIV-infected individuals despite low or undetectable plasma viremia and suggest that monocyte/macrophage activation and bacterial translocation contribute to the progression of atherosclerosis in these subjects. As the long-term survival of the HIV-infected population continues to improve, our results emphasize the importance for further studies on the role of different modalities to limit microbial translocation in an effort to reduce modifiable cardiovascular risk factors.
Supplementary Data
Supplementary materials are available at The Journal of Infectious Diseases online (http://jid.oxfordjournals.org/). Supplementary materials consist of data provided by the author that are published to benefit the reader. The posted materials are not copyedited. The contents of all supplementary data are the sole responsibility of the authors. Questions or messages regarding errors should be addressed to the author.
Notes
Financial support. This work was supported by the National Heart, Lung and Blood Institute (grant R01 HL095132), the National Institute of Allergy and Infectious Diseases (grants AI068634 and AI056933), and the UCLA AIDS Institute and the UCLA Center for AIDS Research (grant AI28697). Partial funding for laboratory work was provided by the CVD and Metabolic Complications of HIV/AIDS Data Coordinating Center, University of Washington (grant 5R01HL095126).
Potential conflicts of interest. All authors: No reported conflicts.
All authors have submitted the ICMJE Form for Disclosure of Potential Conflicts of Interest. Conflicts that the editors consider relevant to the content of the manuscript have been disclosed.
References
- 1.Sackoff JE, Hanna DB, Pfeiffer MR, Torian LV. Causes of death among persons with AIDS in the era of highly active antiretroviral therapy: New York City. Ann Intern Med. 2006;145:397–406. doi: 10.7326/0003-4819-145-6-200609190-00003. [DOI] [PubMed] [Google Scholar]
- 2.Lassenius MI, Pietilainen KH, Kaartinen K, et al. Bacterial endotoxin activity in human serum is associated with dyslipidemia, insulin resistance, obesity, and chronic inflammation. Diabetes Care. 2011;34:1809–15. doi: 10.2337/dc10-2197. [DOI] [PMC free article] [PubMed] [Google Scholar]
- 3.Pussinen PJ, Tuomisto K, Jousilahti P, Havulinna AS, Sundvall J, Salomaa V. Endotoxemia, immune response to periodontal pathogens, and systemic inflammation associate with incident cardiovascular disease events. Arterioscler Thromb Vasc Biol. 2007;27:1433–9. doi: 10.1161/ATVBAHA.106.138743. [DOI] [PubMed] [Google Scholar]
- 4.Giorgi JV, Hultin LE, McKeating JA, et al. Shorter survival in advanced human immunodeficiency virus type 1 infection is more closely associated with T lymphocyte activation than with plasma virus burden or virus chemokine coreceptor usage. J Infect Dis. 1999;179:859–70. doi: 10.1086/314660. [DOI] [PubMed] [Google Scholar]
- 5.Ancuta P, Kamat A, Kunstman KJ, et al. Microbial translocation is associated with increased monocyte activation and dementia in AIDS patients. PLoS One. 2008;3:e2516. doi: 10.1371/journal.pone.0002516. [DOI] [PMC free article] [PubMed] [Google Scholar]
- 6.Brenchley JM, Price DA, Schacker TW, et al. Microbial translocation is a cause of systemic immune activation in chronic HIV infection. Nat Med. 2006;12:1365–71. doi: 10.1038/nm1511. [DOI] [PubMed] [Google Scholar]
- 7.Balagopal A, Philp FH, Astemborski J, et al. Human immunodeficiency virus-related microbial translocation and progression of hepatitis C. Gastroenterology. 2008;135:226–33. doi: 10.1053/j.gastro.2008.03.022. [DOI] [PMC free article] [PubMed] [Google Scholar]
- 8.Kitchens RL, Thompson PA. Modulatory effects of sCD14 and LBP on LPS-host cell interactions. J Endotoxin Res. 2005;11:225–9. doi: 10.1179/096805105X46565. [DOI] [PubMed] [Google Scholar]
- 9.Anderson KV. Toll signaling pathways in the innate immune response. Curr Opin Immunol. 2000;12:13–9. doi: 10.1016/s0952-7915(99)00045-x. [DOI] [PubMed] [Google Scholar]
- 10.Beutler B. Tlr4: central component of the sole mammalian LPS sensor. Curr Opin Immunol. 2000;12:20–6. doi: 10.1016/s0952-7915(99)00046-1. [DOI] [PubMed] [Google Scholar]
- 11.Currier JS, Kendall MA, Zackin R, et al. Carotid artery intima-media thickness and HIV infection: traditional risk factors overshadow impact of protease inhibitor exposure. AIDS. 2005;19:927–33. doi: 10.1097/01.aids.0000171406.53737.f9. [DOI] [PMC free article] [PubMed] [Google Scholar]
- 12.Currier JS, Kendall MA, Henry WK, et al. Progression of carotid artery intima-media thickening in HIV-infected and uninfected adults. AIDS. 2007;21:1137–45. doi: 10.1097/QAD.0b013e32811ebf79. [DOI] [PubMed] [Google Scholar]
- 13.Hodis HN, Mack WJ, LaBree L, et al. The role of carotid arterial intima-media thickness in predicting clinical coronary events. Ann Intern Med. 1998;128:262–9. doi: 10.7326/0003-4819-128-4-199802150-00002. [DOI] [PubMed] [Google Scholar]
- 14.Executive summary of the third report of the National Cholesterol Education Program (NCEP) expert panel on detection, evaluation, and treatment of high blood cholesterol in adults (Adult Treatment Panel III) JAMA. 2001;285:2486–97. doi: 10.1001/jama.285.19.2486. [DOI] [PubMed] [Google Scholar]
- 15.Sandler NG, Wand H, Roque A, et al. Plasma levels of soluble CD14 independently predict mortality in HIV infection. J Infect Dis. 2011;203:780–90. doi: 10.1093/infdis/jiq118. [DOI] [PMC free article] [PubMed] [Google Scholar]
- 16.Lehmann E. Nonparametrics: statistical methods based on ranks. San Francisco, CA: Holden-Day; 1975. [Google Scholar]
- 17.Luetkemeyer AF, Havlir DV, Currier JS. Complications of HIV disease and antiretroviral therapy. Top Antivir Med. 2011;19:58–68. [PMC free article] [PubMed] [Google Scholar]
- 18.Currier JS, Lundgren JD, Carr A, et al. Epidemiological evidence for cardiovascular disease in HIV-infected patients and relationship to highly active antiretroviral therapy. Circulation. 2008;118:e29–35. doi: 10.1161/CIRCULATIONAHA.107.189624. [DOI] [PMC free article] [PubMed] [Google Scholar]
- 19.Crowe SM, Westhorpe CL, Mukhamedova N, Jaworowski A, Sviridov D, Bukrinsky M. The macrophage: the intersection between HIV infection and atherosclerosis. J Leukoc Biol. 2010;87:589–98. doi: 10.1189/jlb.0809580. [DOI] [PMC free article] [PubMed] [Google Scholar]
- 20.Libby P. Inflammation in atherosclerosis. Nature. 2002;420:868–74. doi: 10.1038/nature01323. [DOI] [PubMed] [Google Scholar]
- 21.Ross R. Atherosclerosis is an inflammatory disease. Am Heart J. 1999;138:S419–20. doi: 10.1016/s0002-8703(99)70266-8. [DOI] [PubMed] [Google Scholar]
- 22.Kaplan RC, Sinclair E, Landay AL, et al. T cell activation and senescence predict subclinical carotid artery disease in HIV-infected women. J Infect Dis. 2011;203:452–63. doi: 10.1093/infdis/jiq071. [DOI] [PMC free article] [PubMed] [Google Scholar]
- 23.Ratcliffe NR, Kennedy SM, Morganelli PM. Immunocytochemical detection of Fcgamma receptors in human atherosclerotic lesions. Immunol Lett. 2001;77:169–74. doi: 10.1016/s0165-2478(01)00217-6. [DOI] [PubMed] [Google Scholar]
- 24.Jiang W, Lederman MM, Hunt P, et al. Plasma levels of bacterial DNA correlate with immune activation and the magnitude of immune restoration in persons with antiretroviral-treated HIV infection. J Infect Dis. 2009;199:1177–85. doi: 10.1086/597476. [DOI] [PMC free article] [PubMed] [Google Scholar]
- 25.Morange PE, Tiret L, Saut N, et al. TLR4/Asp299Gly, CD14/C-260T, plasma levels of the soluble receptor CD14 and the risk of coronary heart disease: The PRIME Study. Eur J Hum Genet. 2004;12:1041–9. doi: 10.1038/sj.ejhg.5201277. [DOI] [PubMed] [Google Scholar]
- 26.Lakatos PL, Kiss LS, Palatka K, et al. Serum lipopolysaccharide-binding protein and soluble CD14 are markers of disease activity in patients with Crohn's disease. Inflamm Bowel Dis. 2011;17:767–77. doi: 10.1002/ibd.21402. [DOI] [PubMed] [Google Scholar]
- 27.Navarro-Gonzalez JF, Mora-Fernandez C, Muros de FM, Donate-Correa J, Cazana-Perez V, Garcia-Perez J. Effect of phosphate binders on serum inflammatory profile, soluble CD14, and endotoxin levels in hemodialysis patients. Clin J Am Soc Nephrol. 2011;6:2272–9. doi: 10.2215/CJN.01650211. [DOI] [PMC free article] [PubMed] [Google Scholar]
- 28.Shin HD, Park KS, Park BL, et al. Common promoter polymorphism in monocyte differentiation antigen CD14 is associated with serum triglyceride levels and body mass index in non-diabetic individuals. Diabet Med. 2006;23:72–6. doi: 10.1111/j.1464-5491.2005.01732.x. [DOI] [PubMed] [Google Scholar]
- 29.van der Wal AC, Becker AE, van der Loos CM, Das PK. Site of intimal rupture or erosion of thrombosed coronary atherosclerotic plaques is characterized by an inflammatory process irrespective of the dominant plaque morphology. Circulation. 1994;89:36–44. doi: 10.1161/01.cir.89.1.36. [DOI] [PubMed] [Google Scholar]
- 30.Burdo TH, Lo J, Abbara S, et al. Soluble CD163, a novel marker of activated macrophages, is elevated and associated with noncalcified coronary plaque in HIV-infected patients. J Infect Dis. 2011;204:1227–36. doi: 10.1093/infdis/jir520. [DOI] [PMC free article] [PubMed] [Google Scholar]
- 31.Hsue PY, Hunt PW, Wu Y, et al. Association of abacavir and impaired endothelial function in treated and suppressed HIV-infected patients. AIDS. 2009;23:2021–7. doi: 10.1097/QAD.0b013e32832e7140. [DOI] [PMC free article] [PubMed] [Google Scholar]
- 32.Kitchens RL, Thompson PA, Viriyakosol S, O'Keefe GE, Munford RS. Plasma CD14 decreases monocyte responses to LPS by transferring cell-bound LPS to plasma lipoproteins. J Clin Invest. 2001;108:485–93. doi: 10.1172/JCI13139. [DOI] [PMC free article] [PubMed] [Google Scholar]
- 33.Equils O, Shapiro A, Madak Z, Liu C, Lu D. Human immunodeficiency virus type 1 protease inhibitors block Toll-like receptor 2 (TLR2)- and TLR4-Induced NF-kappaB activation. Antimicrob Agents Chemother. 2004;48:3905–11. doi: 10.1128/AAC.48.10.3905-3911.2004. [DOI] [PMC free article] [PubMed] [Google Scholar]
- 34.d'Ettorre G, Paiardini M, Zaffiri L, et al. HIV persistence in the gut mucosa of HIV-infected subjects undergoing antiretroviral therapy correlates with immune activation and increased levels of LPS. Curr HIV Res. 2011;9:148–53. doi: 10.2174/157016211795945296. [DOI] [PubMed] [Google Scholar]
- 35.Douek DC, Roederer M, Koup RA. Emerging concepts in the immunopathogenesis of AIDS. Annu Rev Med. 2009;60:471–84. doi: 10.1146/annurev.med.60.041807.123549. [DOI] [PMC free article] [PubMed] [Google Scholar]
- 36.Lester RT, Yao XD, Ball TB, et al. HIV-1 RNA dysregulates the natural TLR response to subclinical endotoxemia in Kenyan female sex-workers. PLoS One. 2009;4:e5644. doi: 10.1371/journal.pone.0005644. [DOI] [PMC free article] [PubMed] [Google Scholar]
- 37.Dolan SA, Riegle L, Berzofsky R, Cooperstock M. Clinical evaluation of the plasma chromogenic Limulus assay. Prog Clin Biol Res. 1987;231:405–16. [PubMed] [Google Scholar]
- 38.Ding S, Lund PK. Role of intestinal inflammation as an early event in obesity and insulin resistance. Curr Opin Clin Nutr Metab Care. 2011;14:328–33. doi: 10.1097/MCO.0b013e3283478727. [DOI] [PMC free article] [PubMed] [Google Scholar]
- 39.Brenchley JM, Douek DC. The mucosal barrier and immune activation in HIV pathogenesis. Curr Opin HIV AIDS. 2008;3:356–61. doi: 10.1097/COH.0b013e3282f9ae9c. [DOI] [PMC free article] [PubMed] [Google Scholar]
- 40.Smith BJ, Lightfoot SA, Lerner MR, et al. Induction of cardiovascular pathology in a novel model of low-grade chronic inflammation. Cardiovasc Pathol. 2009;18:1–10. doi: 10.1016/j.carpath.2007.07.011. [DOI] [PubMed] [Google Scholar]
Associated Data
This section collects any data citations, data availability statements, or supplementary materials included in this article.