Abstract
Electron transfer dissociation (ETD) is an alternative peptide dissociation method developed in recent years. Compared with the traditional collision induced dissociation (CID) b and y ion formation, ETD generates c and z ions and the backbone cleavage is believed to be less selective. We have reported previously the application of a statistical data mining strategy, K-means clustering, to discover fragmentation patterns for CID, and here we report application of this approach to ETD spectra. We use ETD data sets from digestions with three different proteases. Data analysis shows that selective cleavages do exist for ETD, with the fragmentation patterns affected by protease, charge states, and amino acid residue compositions. It is also noticed that the cn-1 ion, corresponding to loss of the C-terminal amino acid residue, is statistically strong regardless of the residue at the C-terminus of the peptide, which suggest that peptide gas phase conformation plays important roles in the dissociation pathways. These patterns provide a basis for mechanism elucidation, spectral prediction, and improvement of ETD peptide identification algorithms.
Tandem mass spectrometry based peptide and protein identification involves the dissociation of peptide or protein ions to generate fragment ions. A conventional dissociation method is collision induced dissociation (CID), in which peptide precursor ions collide with inert gas atoms or molecules and dissociate. CID typically results in fragmentation along the peptide backbone at the amide bonds, producing predominantly N-terminal b and C-terminal y ions. It is widely known that the CID fragmentation patterns are highly dependent on the sequence of the peptide and the amino acid (AA) residue composition. Preferential cleavage, for example, is expected at the N-terminus of proline in the presence of a mobile proton or the C-terminus of aspartic acid when no mobile proton is available.1,2,3 Many studies show that understanding these fragmentation patterns can potentially improve the interpretation of CID spectra as well as peptide and protein identifications.4–8 An example of this is our recently reported peptide identification algorithm SQID,9 which incorporates intensity statistics from a large CID dataset and shows improved performance compared with several popular algorithms that do not strongly consider intensity.
Electron transfer dissociation (ETD), 10 similar to electron capture dissociation (ECD)11, has gained popularity because of its ability to retain post-translational modifications and produce distinct c and z ion types compared with the b and y ions produced by CID. The electron transfer and dissociation, which cleaves the N-Cα bond, involve the formation of an aminoketyl radical and the backbone cleavage is believed to be less selective than CID with no strong cleavage preferences.12 To date, several statistical studies have been published to examine the underlying fragmentation trends, e.g., Savitski and coworkers analyzed the pairwise fragmentation trends of ECD spectra of 14967 tryptic peptide dications and found that the preference is complementary to CID; 13 Chalkley and coworkers characterized the frequency of observing different ion types in ETD in terms of protease used and charge states.12 These studies have provided valuable information for understanding ETD mechanism as well as interpreting ETD spectra. However, no study has been done to examine fragmentation trend for large datasets of ETD spectra using more advanced statistical techniques.
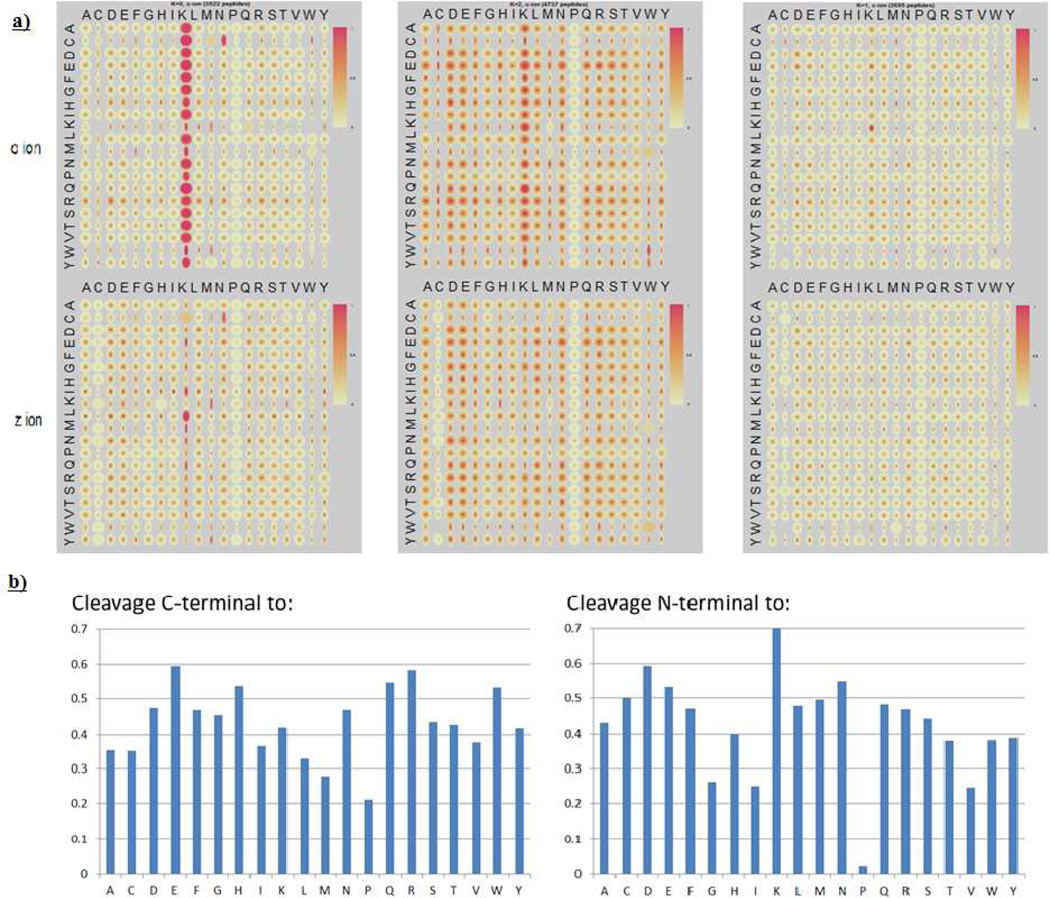
Our group has reported previously application of a statistical data mining strategy, penalized K-means clustering, to discover fragmentation patterns for CID,3,14 and in the research reported here, we apply K-means clustering to ETD for fragmentation pattern discovery. Several ETD datasets collected by the Coon group at the University of Wisconsin - Madison, with sequences assigned to spectra by OMSSA, were subjected to analysis: one with 11954 unique peptides produced by Lys-C digestion, one with 12042 unique peptides produced by Glu-C digestion, and one with 6423 high resolution spectra of unique peptides produced by trypsin digestion. Mass spectra for all datasets were obtained using an LTQ-Orbitrap (Thermo Fisher Scientific, San Jose, CA) to achieve high resolution and high mass accuracy; MS/MS of the Lys-C and Glu-C datasets were measured using the LTQ front end of the instrument (low resolution) and the tryptic dataset was obtained by using the orbitrap as a high resolution analyzer for product ions. The normalized fragment intensity for cleavage at each amino-acid pair was extracted from each spectrum. As an example, c and z ions were identified from the spectrum of the MH22+ ion of the peptide AAEDVAK and were then normalized to the most abundant peak among all c and z ions in that spectrum (highly charged fragments will also be included depending on the precursor ion charge). For c ions, the normalized intensities of c1, c2, c3, c4, c5 and c6 ions were associated with AA pairs A-A, A-E, E-D, D-V, V-A and A-K respectively, which correspond to the cleavage sites. After the information was collected for all the spectra in the dataset, a matrix was created for c ions containing 400 AA combinations (20 AA * 20 AA; all cysteines in these datasets are carbamidomethylated, so “Cys” in this report are actually carbamidomethylated Cys), and each combination includes a number of normalized intensity values. The same procedure was performed for z ions and both c and z data were used together for clustering. The relationship between AA pairs and normalized intensity can be visualized by quantile maps15 as shown in Figure 1, in which the left column represents the N-terminal residue of the pairwise cleavage site and the top row represents the C-terminal residue of the pair of cleaving amino acids. The horizontal dimension of each spot is proportional to the number of instances of a given pair, with a wider spot meaning more occurrences thus higher confidence. In each spot, ten quantiles of intensities of the entire distribution are plotted on circles using gradient colors. The darkness of the color represents the normalized intensity. A full dark spot represents high intensities for all occurrences in the distribution (e.g. A-K c-ion in the upper left cluster of Figure 1). A spot with a small dark dot in the center and white in the surrounding area represents a bimodal distribution (i.e. a portion of cleavage intensities are high (dark center), but others are low (lighter colored surrounding area), e.g. A-H c-ion in the upper left cluster of Figure 1).
Figure 1.
a) Quantile maps for the three clusters obtained by K-means clustering of 11954 spectra of Lys-C digested unique peptides. Two quantile maps are plotted for each cluster, one for c ions (top) and one for z ions (bottom); b) Quantified cleavage preference in Cluster 2. The left graph represents the cleavage C-terminal to a certain residue and the right graph represents the cleavage N-terminal to a certain residue. Cleavage preference (y axis) is represented by the probability for a certain amino acid pair to have strong cleavages (reference 9 for detailed calculation), e.g., cleavages C-terminal to E, H, N, Q, R and W are relatively strong, and cleavages N-terminal to G, I, V are rather weak.
The K-means clustering algorithm partitions all spectra into K clusters based on the pairwise cleavage behaviors, with the principle that the peptides within a given cluster fragment as similarly as possible to each other and as differently as possible from those peptides in other clusters. More specifically, each peptide spectrum is plotted in a 400 dimensional space with each dimension represent the cleavage intensity from a certain AA combination; then the space is tentatively and repeatedly separated into K parts until the sum squared distance of each spectrum to its centroid is minimized. This approach allows the extraction of independent patterns that were previously mixed. One drawback is that one must choose the number of clusters “K”. In this work we produce multiple sets of clusters and choose the optimal K that produces distinct clusters without obvious sub-clustering. After the clustering, a CART (Classification And Regression Tree) program is used to extract sequence features (charge, length, mobile proton, etc.) for each cluster, so that the relationship between the sequence features and fragmentation behaviors can be established. A complete list of features considered can be found in supporting material.
Lys-C digestion
Clustering of the Lys-C digested peptides resulted in three clusters with distinct fragmentation behaviors (Figure 1a): 1) Cluster 1, a cluster with extremely strong cleavage N-terminal to Lys (the majority are cn-1 ions with “n” indicating the total number of residues; only 13% of the peptides have internal Lys); 2) Cluster 2, a cluster with moderate cleavage preference for certain residues (see middle cluster of Figure 1 and detailed cleavage probability in Figure 1b); and 3) Cluster 3, a cluster with more uniform cleavages. CART analysis showed that the separation mainly depends on charge and length (Table 1). Peptides in Cluster 1 are lower charged and shorter, with 36% doubly charged peptides, 38% triply charged peptides, and an average length of 14. Cluster 2 peptides are the same length as those in Cluster 1 but have higher average charge (3.5 versus 3.0). Peptides in Cluster 3 are longer and more highly charged, with an average length of 21 and average charge of 3.7. With the consideration of the fragmentation patterns in each cluster, it can be seen that the backbone cleavage selectivity decreases with increasing charge states and length. This may indicate that the selective cleavage is charge or radical directed. For a lower charged Lys-C peptide, preferred charge locations may fragment with higher priorities; as the charge increases, there are more charged locations thus more cleavable sites along the peptide backbone, so that the selectivity decreases.
Table 1.
Peptide charge and length distribution for Lys-C digestion ETD dataset and corresponding clusters.
| All (11954 peptides) |
Cluster 1 (3522 peptides) |
Cluster 2 (4737 peptides) |
Cluster 3 (3695 peptides) |
||||||
|---|---|---|---|---|---|---|---|---|---|
| Charge | 2 | 14% | 36% | 3% | 8% | ||||
| 3 | 45% | 38% | 60% | 33% | |||||
| 4 | 29% | 21% | 29% | 36% | |||||
| 5 and more | 12% | 5% | 9% | 22% | |||||
| Average charge | 3.4 | 3.0 | 3.5 | 3.7 | |||||
| Average length | 17 | 14 | 14 | 21 | |||||
| Sequence with internal Lys |
28% | 13% | 31% | 38% | |||||
| Sequence with internal Arg |
63% | 54% | 66% | 66% | |||||
| Fragmentation patterns |
N/A | Very strong X-K cleavage (Cn−1 ion) |
Moderate cleavage for selected residue pairs |
No cleavage preference |
|||||
Besides the features mentioned above, it is also observed that cleavage N-terminal to Pro is prohibited (notice the light color of the Pro column in the clusters and the low intensity in Figure 1b right), which is expected because the ring structure of Pro prohibits peptide cleavage even if the N-Cα bond cleaves. In addition, the z ions from the cleavage N-terminal to carbamidomethylated Cys are generally missing due to a −90 neutral loss of the side chain.16,17 When the loss of 90 is considered, the missing z ion column can be recovered. This phenomenon suggests that ETD search engines should use the mass corresponding to neutral loss of 90 when cleavage occurs N-terminal to carbamidomethylated Cys.
Glu-C digestion
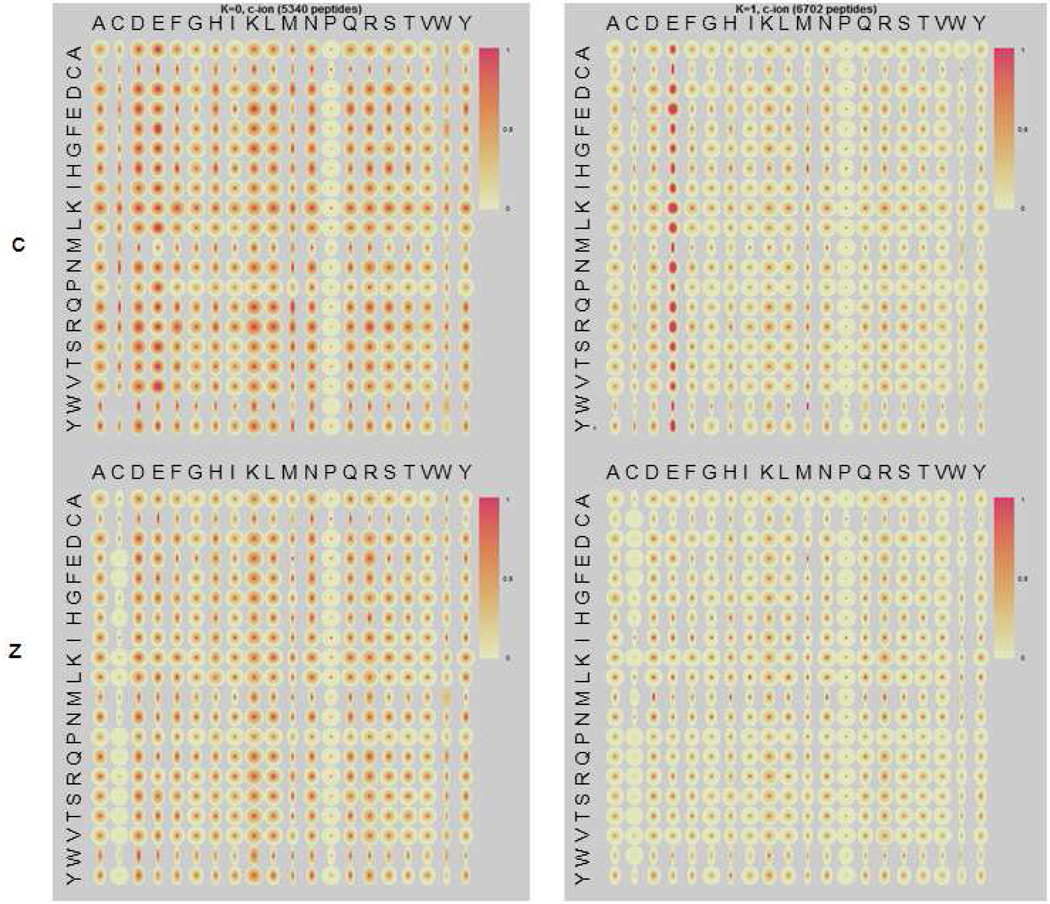
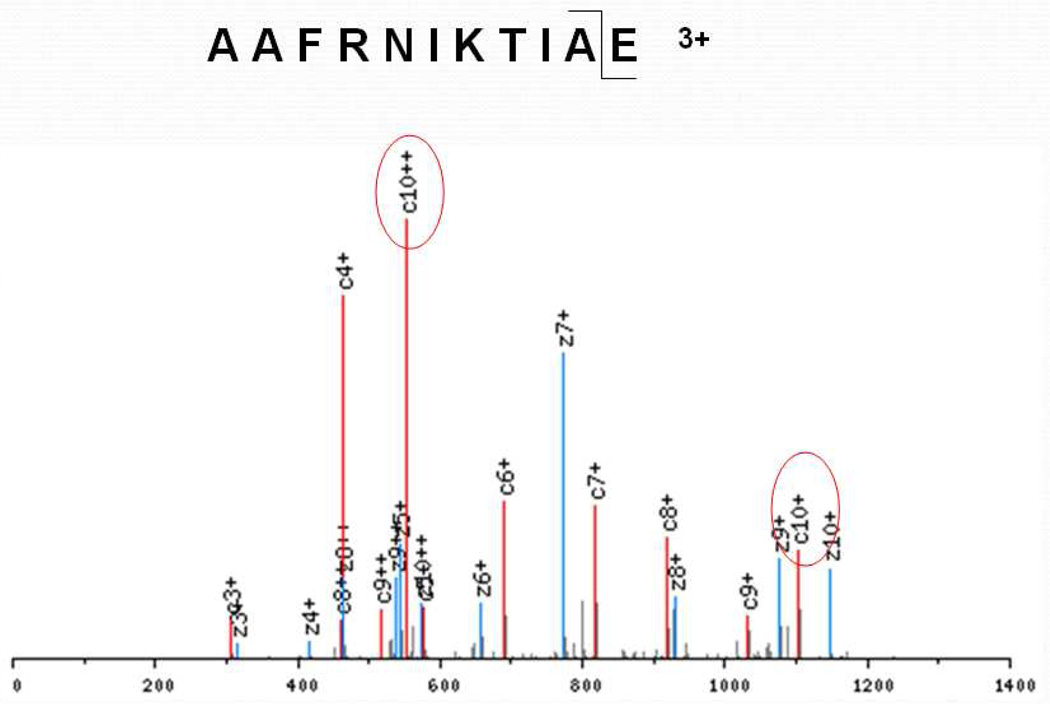
Glu-C digested peptides, which are mainly triply and quadruply charged, separated into two main clusters of behaviors. The first cluster (5340 peptides, Figure 2 left) shows moderate cleavage preferences at various locations, which is similar to Cluster 2 of the Lys-C digested peptides. The other distinct cluster (6702 peptides, Figure 2 right) shows very strong cleavage N-terminal to Glu. Though 42% of these peptides have internal Glu, 98% of these X-E cleavages are cn-1 ions involving no internal Glu. Table 2 summarizes the charge and length distributions for the separation. It can be seen that the cluster with strong X-E cleavages (Figure 2, right) are relatively lower in charge (3.5 versus 3.8) but a little longer (17 versus 15). Figure 3 is an ETD spectrum showing an example of the enhanced cleavage N-terminal to Glu. This looks very similar to X-K cleavage in the Lys-C dataset, with both X-K and X-E cleavage generating strong cn-1 ions.
Figure 2.
Quantile maps for the two clusters obtained by K-means clustering from 12042 spectra of Glu-C digested unique peptides. Two quantile maps are plotted for each cluster, one for c ions (top) and one for z ions (bottom).
Table 2.
Peptide charge and length distribution for Glu-C digestion ETD dataset and corresponding clusters.
| All (12042 peptides) |
Cluster 1 (5340 peptides) |
Cluster 2 (6702 peptides) |
|||||
|---|---|---|---|---|---|---|---|
| Charge | 2 | 1% | 0% | 1% | |||
| 3 | 45% | 32% | 56% | ||||
| 4 | 43% | 57% | 33% | ||||
| 5 and more | 10% | 11% | 10% | ||||
| Average charge | 3.6 | 3.8 | 3.5 | ||||
| Average length | 16.2 | 15.3 | 17 | ||||
| Sequence with internal E |
38% | 33% | 42% | ||||
| Fragmentation patterns |
N/A | Moderate cleavage for selected residue pairs |
Very strong cleavage at X-E |
||||
Figure 3.
ETD spectrum of 3+ AAFRNIKTIAE. A strong c102+ ion was observed which corresponds to the cleavage before the C-terminal residue Glu. Complementary c4/z7 ions correspond to the cleavage between Arg and Asn.
Trypsin digestion
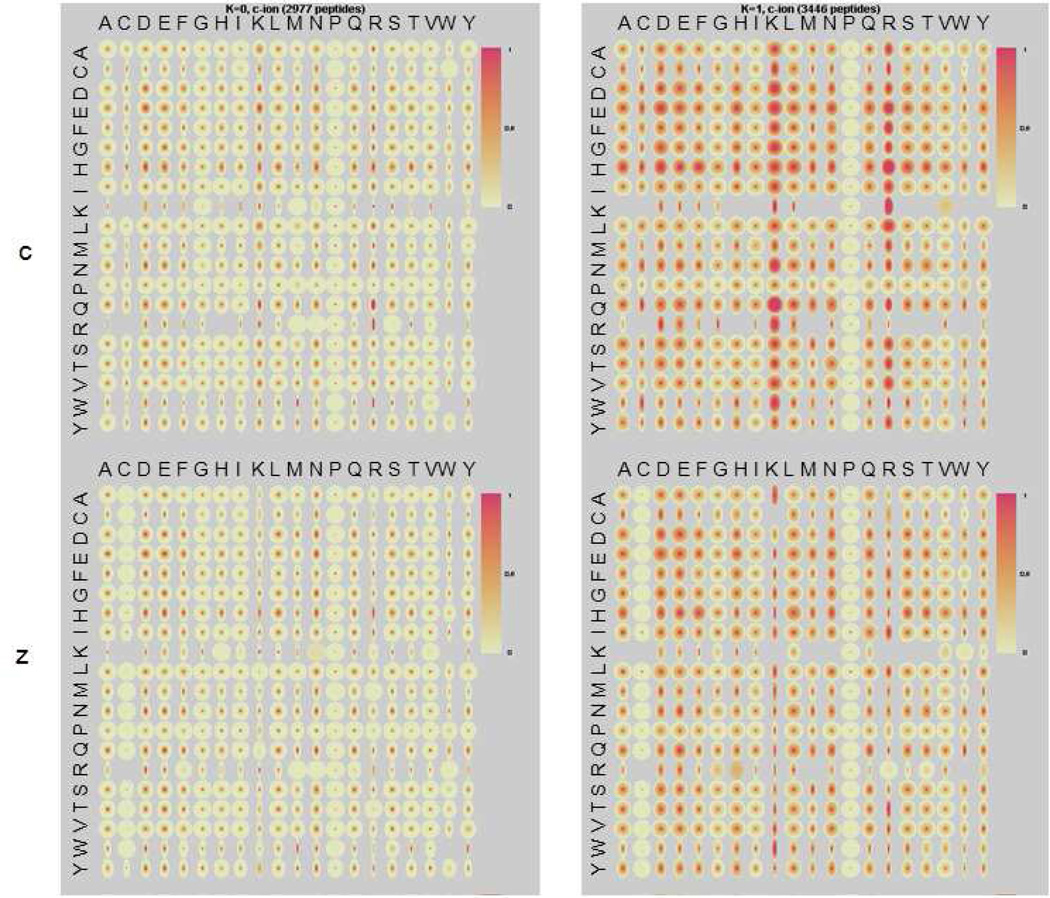
The final spectral dataset subjected to clustering corresponds to 6423 unique tryptic peptides. All peptides in this high resolution tryptic dataset have three or more charges, with 79% triply charged and 19% quadruply charged peptides. Two clusters were achieved through clustering: 1) a cluster with uniform cleavages; 2) a cluster with moderate cleavage preferences at various locations, including strong cleavage at the N-terminus of Lys and Arg in the c ions. As expected from the cleavage patterns in Figure 4, CART analysis (Table 3) shows that peptides in the first cluster are generally longer (20 versus 14) and slightly more highly charged (3.4 versus 3.1), while Cluster 2 peptides are shorter and lower charged. The low percentage of internal Lys and Arg strongly indicates the preference for the cn-1 ion, which is in agreement with the observation in Lys-C and Glu-C datasets. Note that strong preferential cleavage at Arg is seen only in this dataset, where Arg (or Lys) occupies the C terminal positions.
Figure 4.
Quantile maps for the two clusters obtained by K-means clustering of 6423 high resolution spectra of unique tryptic peptides.
Table 3.
Peptide properties for tryptic ETD dataset and corresponding clusters.
| All (6423 peptides) | Cluster 1 (2977 peptides) | Cluster 2 (3446 peptides) | ||
|---|---|---|---|---|
| Charge | 2 | 0% | 0% | 0% |
| 3 | 79% | 68% | 89% | |
| 4 | 18% | 27% | 11% | |
| 5 and more | 3% | 5% | 0% | |
| Average charge | 3.2 | 3.4 | 3.1 | |
| Average length | 16.4 | 19.6 | 13.6 | |
| Lys ending | 60% | 58% | 61% | |
| Arg ending | 40% | 41% | 39% | |
| Sequence with internal Lys |
10% | 10% | 9% | |
| Sequence with internal Arg |
15% | 15% | 12% | |
| Fragmentation patterns |
N/A | No cleavage preference |
Strong X-K and X-R cleavage |
|
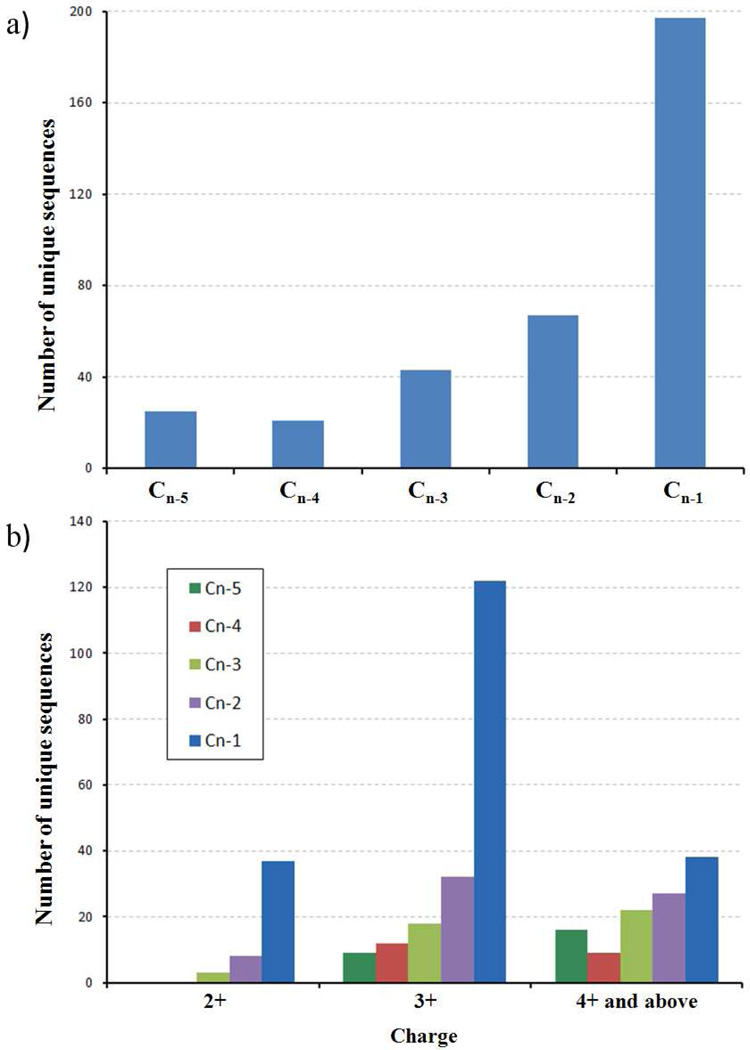
Results from the three datasets indicate that cn-1 is a preferred cleavage site for Lys-C, Glu-C and tryptic peptides, but cannot indicate whether the preference is simply due to a position effect or the fact that the peptides are ending with the specific basic and acidic residue Lys, Arg and Glu. To clarify the issue, we analyzed the spectra of 550 peptides that do not end with Lys, Arg and Glu. These are non-specifically cleaved peptides from the Lys-C, Glu-C and trypsin datasets. Figure 5 shows the distributions of 550 peptides: the cn-1 ion was found to be the most intense peak among all c ions. It can be clearly seen that the cleavage intensity decreases as the distance from the C-terminus increases, and the cn-1 ion is significantly stronger than the other c ions. This observation unequivocally indicates that the cleavage preference in ETD is highly affected by the residue position, which is possibly determined by the gas phase precursor structure as suggested by Moss and coworkers using model peptides.18 As the charge increases, the structures of the peptides will change, and this position effect will diminish (Figure 5B), in agreement with the Lys-C clustering results. Although each cluster with a strong cn-1 cleavage (second cluster of Figures 1a, 2, and 4) contains some 4+ ions, which are not significantly intense, the overall cluster pattern is dominated by the greater percentage of, and extreme strong cn-1 cleavage, exhibited by the precursors with 3 charges. Note that the observed position effect might also be, at least partially, a result of the increasing probability for the c ion to hold charge as length and basicity increases, however, in this report, we simply use position to describes this phenomenon.
Figure 5.
a) Bar graph indicating the numbers of unique sequences (550 total, not ending with K,R and E) in which the cn-i ion is the most intense peak among all c ions (n is the peptide length, i means the ith residue to the C-terminal of the peptide). b) Distributions in terms of charge states.
Table 4 summarizes the ETD fragmentation patterns observed by applying the K-means clustering method to Lys-C, Glu-C and tryptic datasets. The patterns highly depend on charge state. At higher charges states, the cleavage is less selective with no dominant preferential cleavage. At lower charge states, there are very strong cn-1 ions, and moderate preferred cleavages involving certain residues, such as enhanced cleavages C-terminal to E, H, N, Q, R and W, and suppressed cleavages N-terminal to G, I and V. Though these trends are not phenomenal enough to be unequivocally described as dominating cleavages, many of them can also be observed in the ECD statistics published previously.13 In addition, limited cleavage occurs to the N-terminus of Pro, which is expected due to the ring structure, and the z ions from the N-terminal cleavage of carbamidomethylated Cys are always missing, due to the −90 neutral loss of the side chain.16,17 We also examined the hydrogen transfer products in ETD and the data are shown in supporting material. Strong c-1 radical ions, formed after hydrogen transfer, are also observed corresponding to cleavage N-terminal to Lys and Glu, for Lys-C and Glu-C peptides. All these patterns could be used directly for ETD fragment intensity prediction, and at the same time, provide guidance to clarify the underlying dissociation mechanisms. The results will be incorporated into our intensity based algorithm, SQID,9 to improve ETD peptide identification.
Table 4.
Summary of observed ETD fragmentation patterns.
| Charge | Low (2 to 3) | Medium (3 to 4) | High (4 or more) |
|---|---|---|---|
| Cleavage | |||
| Strong cleavage | cn−1 ion | No | No |
| Moderate cleavage preference |
e.g. strong E,H,N,Q,R,W −X weak X-G,I,V |
No | |
| No cleavage | X-P (ring) | ||
| z ion from X-(C+57) (neutral loss) | |||
Supplementary Material
ACKNOWLEDGMENT
The research was supported by NIH Grant R01GM051387 to V.H.W. and R01GM080148 to J.J.C.
Footnotes
SUPPORTING INFORMATION AVAILABLE
Additional information as noted in text. This material is available free of charge via the Internet at http://pubs.acs.org/.
REFERENCES
- 1.Wysocki VH, Tsaprailis G, Smith LL, Breci LA. Mobile and localized protons: a framework for understanding peptide dissociation. Journal of Mass Spectrometry. 2000;35(12):1399–1406. doi: 10.1002/1096-9888(200012)35:12<1399::AID-JMS86>3.0.CO;2-R. [DOI] [PubMed] [Google Scholar]
- 2.Huang Y, Triscari JM, Tseng GC, Pasa-Tolic L, Lipton MS, Smith RD, Wysocki VH. Statistical characterization of the charge state and residue dependence of low-energy CID peptide dissociation patterns. Anal. Chem. 2005;77(18):5800–5813. doi: 10.1021/ac0480949. [DOI] [PMC free article] [PubMed] [Google Scholar]
- 3.Huang Y, Tseng GC, Yuan S, Pasa-Tolic L, Lipton MS, Smith RD, Wysocki VH. A data-mining scheme for identifying peptide structural motifs responsible for different MS/MS fragmentation intensity patterns. J. Proteome Res. 2008;7(1):70–79. doi: 10.1021/pr070106u. [DOI] [PMC free article] [PubMed] [Google Scholar]
- 4.Gibbons FD, Elias JE, Gygi SP, Roth FP. SILVER helps assign peptides to tandem mass spectra using intensity-based scoring. J Am Soc Mass Spectrom. 2004;15(6):910–912. doi: 10.1016/j.jasms.2004.02.011. [DOI] [PubMed] [Google Scholar]
- 5.Havilio M, Haddad Y, Smilansky Z. Intensity-based statistical scorer for tandem mass spectrometry. Anal. Chem. 2003;75(3):435–444. doi: 10.1021/ac0258913. [DOI] [PubMed] [Google Scholar]
- 6.Zhang Z. Prediction of low-energy collision-induced dissociation spectra of peptides. Anal. Chem. 2004;76(14):3908–3922. doi: 10.1021/ac049951b. [DOI] [PubMed] [Google Scholar]
- 7.Elias JE, Gibbons FD, King OD, Roth FP, Gygi SP. Intensity-based protein identification by machine learning from a library of tandem mass spectra. Nature Biotechnol. 2004;22(2):214–219. doi: 10.1038/nbt930. [DOI] [PubMed] [Google Scholar]
- 8.Narasimhan C, Tabb DL, Verberkmoes NC, Thompson MR, Hettich RL, Uberbacher EC. MASPIC: intensity-based tandem mass spectrometry scoring scheme that improves peptide identification at high confidence. Anal. Chem. 2005;77(23):7581–7593. doi: 10.1021/ac0501745. [DOI] [PubMed] [Google Scholar]
- 9.Li W, Ji L, Goya J, Tan G, Wysocki VH. SQID: An intensity-incorporated protein identification algorithm for tandem mass spectrometry. J. Proteome Res. 2011;10(4):1593–1602. doi: 10.1021/pr100959y. [DOI] [PMC free article] [PubMed] [Google Scholar]
- 10.Syka JEP, Coon JJ, Schroeder MJ, Shabanowitz J, Hunt DF. Peptide and protein sequence analysis by electron transfer dissociation mass spectrometry. Proc. Natl. Acad. Sci. U.S.A. 2004;101:9528–9533. doi: 10.1073/pnas.0402700101. [DOI] [PMC free article] [PubMed] [Google Scholar]
- 11.Zubarev RA, Kelleher NL, McLafferty FW. Electron capture dissociation of multiply charged protein cations: a nonergodic process. J. Am. Chem. Soc. 1998;120:3265–3266. [Google Scholar]
- 12.Chalkley RJ, Medzihradszky KF, Lynn AJ, Baker PR, Burlingame AL. Statistical analysis of peptide electron transfer dissociation fragmentation mass spectrometry. Anal. Chem. 2010;82(2):579–584. doi: 10.1021/ac9018582. [DOI] [PMC free article] [PubMed] [Google Scholar]
- 13.Savitski MM, Kjeldsen F, Nielsen ML, Zubarev RA. Complementary sequence preferences of electron capture dissociation and vibrational excitation in fragmentation of polypeptide poly-cations. Angew. Chem. Int. Ed. 2006;45:5301–5303. doi: 10.1002/anie.200601240. [DOI] [PubMed] [Google Scholar]
- 14.Tseng GC. Penalized and weighted K-means for clustering with scattered objects and prior information in high-throughput biological data. Bioinformatics. 2007;23:2247–2255. doi: 10.1093/bioinformatics/btm320. [DOI] [PubMed] [Google Scholar]
- 15.Tseng GC. Visualization of multiple distributions with quantiles and Fisher information with application to tandem mass spectrometry data. Computational Statistics and Data Analysis. 2010;54:1124–1137. doi: 10.1016/j.csda.2009.09.002. [DOI] [PMC free article] [PubMed] [Google Scholar]
- 16.Sun R, Dong M, Song C, Chi H, Yang B, Xiu L, Tao L, Jing Z, Liu C, Wang L, Fu Y, He S. Improved Peptide Identification for Proteomic Analysis Based on Comprehensive Characterization of Electron Transfer Dissociation Spectra. J. Proteome Res. 2010;9(12):6354–6367. doi: 10.1021/pr100648r. [DOI] [PubMed] [Google Scholar]
- 17.Xia Q, Lee MV, Rose CM, Marsh AJ, Hubler SL, Wenger CD, Coon JJ. Characterization and Diagnostic Value of Amino Acid Side Chain Neutral Losses Following Electron-Transfer Dissociation. J Am Soc Mass Spectrom. 2011;22(2):255–264. doi: 10.1007/s13361-010-0029-0. [DOI] [PMC free article] [PubMed] [Google Scholar]
- 18.Moss CL, Chung TW, Cerovsky V, Turecek F. Electron transfer dissociation of a melectin peptide: correlating the precursor ion structure with peptide backbone dissociations. Collection of Czechoslovak Chemical Communications. 2011;76(4):295–309. [Google Scholar]
Associated Data
This section collects any data citations, data availability statements, or supplementary materials included in this article.


