

Abstract
Accurate and reliable methods for assessing human physical activity energy expenditure (PAEE) are informative and essential for understanding individual behaviors and quantifying the impact of physical activity (PA) on disease, PA surveillance and for examining determinants of PA in different populations. This paper reviews recent advances in the estimation of PAEE, in three interrelated areas: 1) types of sensors worn by human subjects, 2) features extracted from the measured sensor signals, and 3) modeling techniques to estimate the PAEE using these features. The review illustrates three directions in the PAEE studies, and provides recommendations for future research, with the aim to produce valid, reliable, and accurate assessment of PAEE from wearable sensors.
Keywords: Physical activity, energy expenditure, body-worn sensors, computational methodology
1. Introduction
Physical activity (PA) is defined as body movement generated by skeletal muscle action that increases energy expenditure above resting levels (46). Physical activity dose is a function of activity type, intensity and duration which determines the actual energy expenditure (PAEE) of the activity being performed. Engaging in physical activities on a regular basis by means of walking, jogging, sports or muscle-strengthening activities, is effective for improving health, fitness and quality of life, preventing and lowering the risk of cardiovascular disease, weight control, diabetes, obesity, early death, certain cancers, and stroke (64). PA observational studies that provide evidence of the dose-response between PA and health, improve our understanding of the link between PA and health. Healthy People 2020 has listed physical activity as one of the targeted behaviors to improve health among youth and adults (65). Thus, accurate monitoring and assessment of PA is critical and of significant interest to the research community.
Physical activity energy expenditure (PAEE) has been assessed by different lab-based methods including direct (66) or indirect (19) calorimeters to quantify the intensity of activities. Such methods are accurate in assessing the PAEE, but are generally costly and performed in lab settings where sophisticated lab equipment is required. In lab studies using indirect calorimetry as the criterion measure, steady-state values are used to develop prediction models from wearable sensors. The criterion energy expenditure for a given activity is usually expressed as the metabolic equivalent (METs) using either measured RMR or 3.5 ml.kg/min as the denominator of the MET calculation. It remains unclear which is the best method for expression of METs for purposes of activity monitor calibration (38). In free living studies where activities are not fixed and can vary from moment to moment, steady-state is usually not attained and the use of indirect calorimetry is not an appropriate criterion measure. In this case, direct observation may be preferred where energy expenditure of these more random types of activity is estimated from the Compendium of Physical Activities (1).
Activity monitors are now capable of storing a large amount of raw acceleration data, allowing examination of detailed features from the monitor sensor output. Using machine learning techniques to process these data can detect activity types and patterns of physical activity as well as intensity and energy expenditure. Combining physiological measures (e.g., respiration, skin temperature and heart rate) with the motion output from accelerometer sensors may further enhance the PA assessment (35, 43). Recently, such a multi-sensing approach has emerged as a technique for accurate and reliable PA assessment under free-living environments (25, 31, 32, 35). This paper reviews the various types of body-worn sensors and different computational techniques that have been applied to the PA assessment based on recent publications. Specifically, this review focuses on the estimation of PAEE. Methods for recognizing PA patterns have been reviewed elsewhere (51).
Estimating PAEE typically involves three steps, as shown in Figure 1. Human body motion and physiological variables (other than demographic or anthropometric variables) are first captured by the sensor system, which consists of either single or multiple body-worn sensors. Different features in the time, frequency, or other domains are extracted from the raw sensor measurements characterizing the original signals for reducing the computational complexity and redundancy. It is common practice that signal output by sensors are first pre-processed (e.g., filtering, artifact removal), before relevant “features” are extracted. Discussion on signal pre-processing is outside the scope of this review, and can be referred to in Preece et al. (51). These extracted features are then used as inputs to data fusion algorithms for estimating/modeling the PAEE. The modeling methods reported in past studies are of varying complexity, ranging from simple linear regressions to advanced machine learning techniques (6), which extract (often hidden) relationships and correlations between physical activity data and the PAEE. Examples of such machine learning methods include hidden Markov models, quadratic discriminant analysis, artificial neural network and support vector machines. These methods are discussed in detail later in the paper. Regardless of the specific techniques used, PAEE estimation has generally been performed in a supervised manner, for which an estimation model is first developed (or trained), based on features extracted from the sensor signals. The criterion energy expenditure is measured by respiratory gas exchange device when subjects are performing physical activities. The trained model is then used to estimate PAEE by using the data that were not included initially in the training set.
Figure 1.
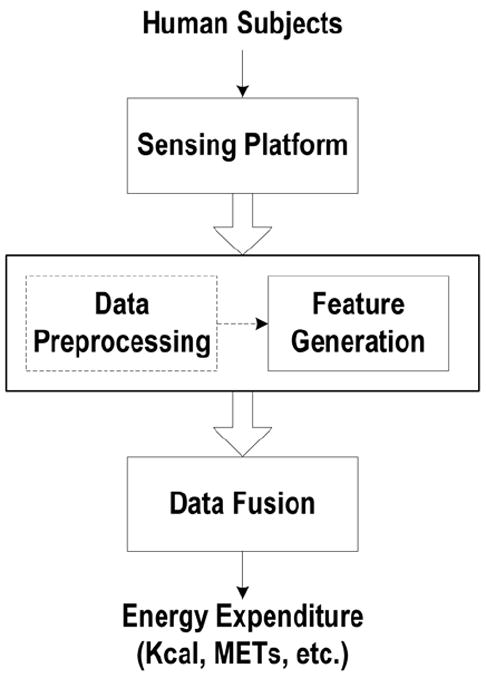
Typical flow chart for PAEE estimation.
The rest of this review paper is structured as follows. In section 2, body-worn sensors used for estimating PAEE are first introduced; in section 3, feature generation, including feature extraction and selection, are presented; computational techniques are described in section 4; and conclusions and future directions are described in section 5.
2. Body-Worn Sensors
2.1 Accelerometers and Foot Pressure Sensors
Table 1 shows a list of the body-worn sensors that have been used to estimate of PAEE. Among them, the accelerometer is one of the most commonly used wearable sensors for estimating the PAEE, due to its capability of detecting the quantity and intensity of human body movements. While simple in structure, the accelerometer can effectively detect both static and dynamic accelerations caused by changes in posture, body motion, or transition in motion patterns. Specifically, static acceleration responds to gravity, and has been used to measure tilt angles or posture changes (23, 67). Dynamic acceleration captures the intensity of body movements, and thus has been extensively applied to estimate PAEE. A majority of the studies have been based on single uniaxial accelerometer that is usually placed on the hip (6, 8, 15, 17, 22, 26, 27, 28, 34, 36, 37, 40, 47, 50, 52, 56, 57), and details using such single accelerometer-based activity monitors for estimating PAEE are presented in previous reviews (14, 24, 45, 32). It is noted that activities involving mostly upper-body motion would result in inaccurate estimation of the PAEE when only using a hip accelerometer. Placing additional accelerometers at various locations on the body improves the estimation of PAEE (3, 43, 52, 69, 70). A five-accelerometer device (IDEEA) with accelerometers located on the chest, frontal area of each thigh, and bottom of each foot achieved a 56% higher prediction accuracy for estimating energy expenditure than a single hip-mounted accelerometer device (ActiGraph) (52). Favorable results for estimating energy expenditure were also reported for the IDEEA in comparison to other multi-accelerometer activity monitors, e.g., the IDEEA improved the accuracy of estimating energy cost by 26.4% compared to the ActiReg, which consists of two accelerometers (3). Noteworthy are the PAEE estimation results reported recently by combining single or dual accelerometers with advanced machine learning techniques, which have achieved comparable or even more favorable estimation accuracy compared to the IDEEA. For example, Staudenmayer et al. (57) demonstrated a comparable estimation performance with a mean square error (MSE) of 0.56 METs compared to the MSE of 0.45 METs by the IDEEA (52) by processing a single-uniaxial-accelerometer signal with an artificial neural network (ANN), and Rothney et al. (52) achieved an MSE of 0.25 METs by applying ANN to a biaxial accelerometer. More details on machine learning techniques for PAEE estimation will be discussed in later sections.
Table 1.
Sensors used for estimating PAEE.
| Types | Locations | References |
|---|---|---|
| Accelerometer(s) alone | ||
| Single | Hip | (6, 8, 15, 17, 22, 26, 27, 28, 34, 36, 37, 40, 47, 50, 52, 56, 57) |
| Multiple | Hip, chest, thigh (left and right), bottom of foot (left and right), wrist | (3, 43, 52, 69, 70) |
|
| ||
| Combination of pressure sensors and accelerometer(s) | Bottom of each foot: heel, metatarsal bones and great toe | (53, 60) |
|
| ||
| Combinations of physiological sensors and accelerometer(s) | ||
| Heart rate (ECG) | Chest, | (10, 15, 16, 18, 21, 38, 41, 58, 59, 68) |
| Respiration | Rib cage, abdomen | (32, 43) |
| Heat flux | Upper arm | (2, 4, 12, 25, 31, 35) |
| Galvanic skin response | Upper arm | |
| Skin temperature | Upper arm | |
The performance of PAEE estimation mainly depends on two independent factors: the number/type of sensors and the choice of the analytic technique used to estimate PAEE. When combining advanced machine learning techniques with fewer sensors, e.g., applying ANN to a single accelerometer (52, 57), comparable estimation accuracy of PAEE can be achieved compared to devices employing more accelerometers that used simpler and less powerful analytic techniques. On the other hand, if the estimation technique remains the same, devices with more sensors generally demonstrate a better estimation performance than those with fewer sensors (43). Despite the estimation accuracy by using multiple sensors, the disadvantage of a multi-sensor system, is that it increases subject burden, data processing and product cost. These factors limit the utility of multi-sensor devices in free-living conditions.
Another type of sensor used for estimating PAEE is a pressure device, which is typically placed on the bottom of the feet to detect the contact pressure during human movement (54, 61). For example, Sazonova et al. (54) developed a footwear-based device integrating one accelerometer and five force-sensitive resistors positioned at the heel, metatarsal bones, and the great toe. By using both the accelerometer and pressure sensor signals in the model, better PAEE prediction with a RMSE of 0.69 METs was achieved than that using only the accelerometer signal (RMSE of 0.77 METs).
2.2 Physiological Sensors
For different types of activities that produce similar acceleration profiles but have different energy expenditure, accelerometry-based activity monitors cannot provide accurate estimates of PAEE (43). For example, walking at a certain speed may result in acceleration outputs similar to that of walking at the same speed while carrying a load or going uphill, although the energy expenditure is different. Under such circumstances, sensors that measure human physiological responses, such as heart-rate (10, 15, 16, 18, 21, 38, 41, 58, 59, 68), respiration (32, 43), or an armband (2, 4, 12, 25, 31, 35) consisting of heat flux, galvanic skin response, and skin temperature sensors, have been studied to determine if these additional sensors improve the estimation of the energy expenditure. For example, combining the measurement of heart-rate with acceleration estimates the PAEE more precisely (R2 = 0.81, RMSE = 0.64 METs) than the PAEE estimate using a single hip accelerometer (R2 = 0.41, RMSE =1.22 METs) (59). Similarly, by combining one piezoelectric respiratory sensor, which secured to the abdomen for detecting human breathing frequency and minute ventilation during activities, with two accelerometers at the hip and wrist to estimate the corresponding PAEE for 50 subjects, we reported an RMSE as low as 0.42 METs, which is 22% less than using the hip accelerometer alone (32, 43). These results have shown that the combination of physiological sensors and accelerometer improves the accuracy of PAEE estimation. However, using only physiological sensors are not recommended, as a past study (43) has shown a less accurate estimation of the PAEE by using the physiological sensors alone (RMSE = 0.72 METs) than combining them with accelerometers (RMSE = 0.42 METs). Thus, compared to the single-accelerometer approach, using multiple sensors, either multiple accelerometers or integrating physiological or pressure sensors, may improve the PAEE estimation.
3. Feature Generation
The raw signals from body-worn sensors during physical activities are often sampled over periods of time and contain a considerable number of data points. Although a study (9) used raw data points directly for estimating the PAEE, features are usually extracted from the original sensor signals and used as inputs to more advanced post-processing computational algorithms for PAEE estimation. Figure 2 shows an example of a hip accelerometer signal and the extracted features during treadmill activities at various speeds (e.g. 1.1 km/h, 3.1 km/h, 5.0 km/h, 7.1 km/h, 8.0 km/h, 10.0 km/h, 12.1 km/h, and 14.0 km/h). The features are the inter-quartile range (IQR) values extracted from the original accelerometer signals for each activity (42). Figure 2 illustrates that the IQR values increase linearly with the speed of locomotion, and despite the individual variability, the IQR values may be used to represent the original signal as inputs to the PAEE estimation algorithm. Using the features as inputs enables substantial data reduction as compared to using the original raw signals. For example, for signals sampled at 30 Hz, data volume will be reduced by 300 times if features are extracted every 10 seconds. As a result, the computational load of the algorithm is significantly reduced.
Figure 2.
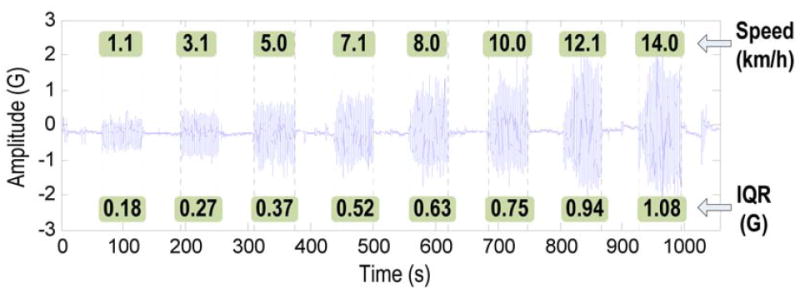
An example of features extracted from a hip accelerometer signal measured during treadmill activities at various speeds.
In the following section, commonly used features for estimating the PAEE are summarized. These include both time-domain and frequency-domain features, as well as other parameters (e.g., height, weight, BMI, body composition) of the person wearing the sensors. A list of the features that have been studied in past studies is shown in Table 2, together with their respective mathematical formulae.
Table 2.
Features generated for PAEE estimation.
| Features | References | |
|---|---|---|
| Time domain | ||
|
| ||
| 1 | Data points of raw sensor signals: {si, i = 1,…,N} s: raw sensor signal, N: number of the sensor data points within a certain period of time. |
(9) |
|
| ||
| 2 | Accelerometer counts (integral/sum of the signals over a period of time): . | (13, 17, 44, 50, 56) |
|
| ||
| 3 | Mean: | (6, 8, 32, 42, 43) |
|
| ||
| 4 | Standard deviation: | (6, 8, 32, 43, 54) |
|
| ||
| 5 | Coefficients of variation (CV): σs/|s̄|, σs: standard deviation, s̄: mean. | (17, 52, 54) |
|
| ||
| 6 | Peak-to-peak amplitude | (6, 8) |
|
| ||
| 7 | Percentiles (10th, 25th, 50th, 75th, 90th): : sorted sensor data in increasing order, pj = 100(j−0.5)/ N : percent rank of jth data point, : jth sorted data value, p: pth percentile, find j such that pj+1 ≤ p ≤ pj. | (33, 43, 57) |
|
| ||
| 8 | Interquartile range: difference between the 75th and 25th percentiles. | (42, 52) |
|
| ||
| 9 | Correlation between accelerometer axes: : mean of signal s and v. | (6, 43) |
|
| ||
| 10 | Autocorrelation: , s̄ : mean, k: lag k autocorrelation | (57) |
|
| ||
| 11 | Skewness: , measure of asymmetry of the signal probability distribution. | (52) |
|
| ||
| 12 | Kurtosis: , degree of the peakedness of the signal probability distribution. | (52) |
|
| ||
| 13 | Signal power: or sum of the signal power . | (52) |
|
| ||
| 14 | Log-energy: | (41) |
|
| ||
| 15 | Peak intensity: number of the signal peak appearances within a certain period of time. | (52) |
|
| ||
| 16 | Zero crossings: number of times the signal crosses its median. | (54) |
|
| ||
|
Frequency domain
| ||
| 17 | Dominant frequency | (6, 8, 43) |
|
| ||
| 18 | Amplitude of dominant frequency | (6) |
|
| ||
| 19 | Entropy: − Σk p (fk) log p(fk) fk: kth frequency component of the signal, p(fk): probability mass function of the fk. | (6, 43) |
|
| ||
| Demographic and anthropometric features | ||
| 20 | Age, height, weight, BMI, gender, genetics, occupation, education | (13, 20, 28, 52, 53, 54, 68) |
|
| ||
| 21 | Body composition: fat mass, fat-free mass | (13) |
3.1 Time-domain Features
Time-domain features are directly extracted from the time series of the original, raw sensor signals. A typical procedure for extracting time-domain features is to first divide a sensor signal into consecutive small windows. Then, time-domain features, as listed in Table 2, are computed over each window. The size of the signal window ranges from 0.25 to 60 seconds (31, 68), but the determination of the window size usually depends on the specific application and the impact to the estimation accuracy. For example, the window size can be fixed using a sliding window, or varied using an event- or activity-defined window. Compared to the event- or activity-defined windowing technique which requires a pre-processing step to recognize the specific event or activity and increases the computational complexity, the sliding window is more suited to real-time applications due to its simpler implementation (51). A more detailed review of the windowing techniques is discussed in Preece et al. (51).
As statistical measures, time-domain features provide insight into the following aspects of the measured signal:
general description of the raw signal, such as the mean (6, 8, 32, 42, 43) and standard deviation (6, 8, 32, 43, 54);
representation of the signal strength, such as accelerometer counts (13, 17, 44, 50, 56), signal power (52), log energy (41) and peak-to-peak amplitude (6, 8);
distributions of the signal, such as 10th, 25th, 50th (median), 75th, 90th percentiles (32, 43, 57) and interquartile range (42, 52);
measures of the signal probability distribution, such as kurtosis (52), skewness (52) and coefficient of variation (CV) (17, 52, 54);
and others, such as peak intensity (52), zero crossings (54), autocorrelation (57), and cross-correlation (6, 43).
Specifically, peak intensity is the number of the signal peak appearances within a signal window, and zero crossings is the number of the times that the signal crosses its median. Staudenmayer et al. used lag one autocorrelation of the accelerometer counts to measure the signal temporal dynamics (57), and others have used cross-correlation to quantify the similarity between signals from different axes of one accelerometer (6) or from accelerometers placed at different body locations (43) to measure the coordination or variation between different body segments during activities.
3.2 Frequency-domain Features
Frequency-domain features are extracted from the coefficients obtained by performing spectral analysis, usually Fast Fourier Transform (FFT), on the original sensor signals. The values of the coefficients represent the amplitudes of the corresponding frequency components. In particular, the coefficient with the largest amplitude corresponds to the dominant frequency of the signal, which is an indicator of the activity intensity level. Both the dominant frequency (7, 8, 43) and its amplitude (7) have been commonly chosen as the frequency-domain features for PAEE estimation. Similar to time-domain features, measures of the probability distribution of the FFT coefficients have also been used for estimating the PAEE. Bonomi et al. used spectral entropy from the accelerometer signals as one of the features for the estimation of activity intensity (7). The spectral entropy measures the frequency concentration, and can be used as an indicator of the activity patterns (43). For example, low spectral entropy corresponds to high frequency concentration which usually represents simple or uniform activity patterns such as treadmill locomotion. In contrast, high spectral entropy corresponds to low frequency concentration, which indicates complex or non-uniform activity such as team sports, tennis, or self-paced walking.
3.3 Demographic and Anthropometric Features
In addition to the features computed directly from the sensor signals, subject demographic and anthropometric characteristics (13, 20, 28, 52, 53, 54, 68), such as age, height, weight, body-mass index (BMI), body composition (e.g., fat mass, fat-free mass), gender, have also been considered for PAEE estimation. As an example, Heil combined age, gender, height and weight, with accelerometer counts to estimate the activity energy expenditure (28). Carter et al. integrated age, gender, height, body mass, fat-free mass and fat mass with accelerometer data into the model to predict free-living energy expenditure (13). However, the impact of these anthropometric and demographic variables on PAEE estimation varies and in different studies. For example, Carter et al. (13) found that the body mass, age and gender were not significant predictors for the estimation of total energy expenditure (TEE) in young adults, and explained 0% of the estimation variance. Height, on the other hand, was found to be an important predictor of TEE, and explained 46% of the estimation variance. Plasqui et al. (48) also found that height is important for estimating TEE in adults, and combining age and body mass together with height explained 64% of the variation in TEE estimation. Similar to (13), they also found that gender is not significant for TEE estimation. Discrepancy also exists, as Plasqui et al. (48) found age and body mass contributes the estimation of TEE in adults and Carter et al. (13) concluded the opposite. Noteworthy is that Carter et al. (13) found that the fat-free mass instead of the body mass is significant and explained 48% of the variance of TEE estimation. Therefore, the effect of demographic and anthropometric features requires further investigation and data validation to improve our understanding of whether and how these parameters may affect the PAEE estimation accuracy. Moreover, measurement errors related to features such as percent fat or the race and gender differences in percent fat, although not discussed (13), may lead to inaccurate estimation of TEE, thus deserve further research.
4. Modeling of PA Energy Expenditure
Despite the different features discussed in previous section, it is noted (43) that the presence of irrelevant or redundant features may worsen the estimation performance. Often an additional step of removing irrelevant or redundant features and selecting “good” features from the overall feature set is integrated into the estimation process and is important for establishing an accurate model for PAEE estimation. Such a step is, however, not in the scope of this review. With the features extracted from the sensor signals, modeling methods are needed to use these inputs to estimate the PAEE associated with the activities. A list of recent modeling methods for PAEE estimation is shown in Table 3.
Table 3.
Modeling methods for estimating PAEE.
| Methods | Theory | References |
|---|---|---|
| Standard regression |
y: estimated PAEE (MET, kcal, etc.), x1, …, xp: features, xixj’s: polynomial representations (interactions) between features, β’s: regression coefficients. |
(5, 18, 52, 53, 57, 68) |
| Log-linear regression |
y: estimated PAEE (MET, kcal, etc.), x1, …, xp: features, mass: body mass, k and β’s: regression coefficients. |
(13) |
| Hidden Markov model | Activity classified as a = arg max (Pr(x ∣ Aj)) Aj: jth activity, j=1,…n, Pr(x∣Aj): probability of the features x that come from activity Aj. |
(48, 50) |
| Quadratic discriminant analysis | Probability of the signals that come from activity a, a ∈ {1, 2,…,n}, a total of n activities, Σa : covariance matrix for activity a, x: features extracted from sensor signals, μ: mean of the features. | (50) |
| Artificial neural network |
y: estimated PAEE (MET, kcal, etc.), x1, …, xp: features extracted from sensor signals, β’s: coefficients to be determined during training, H: the size of the hidden layers, ϕ(z) = 1/(1 + e−z) : activation function. |
(52, 57) |
| Support vector machines |
y: estimated PAEE (MET, kcal, etc.), w: weighing factors, φ: transformation function, x: features extracted from sensor signals, βi: coefficients to be determined during training, K(xi, x) = ϕ(xi)T ϕ(x) : kernel function. |
(32, 43, 53) |
| Hybrid approach/piecewise regression |
y: estimated PAEE (MET, kcal, etc.), f1, …, fp: regression models, x1, …, xp: features. |
(11, 17, 21, 43, 53, 54) |
4.1 Linear Regressions
Regression analysis is a commonly used technique for quantifying the relationship between one or more independent variables with the dependent variable. Models based on linear regression or multiple linear regression have been extensively used for the estimation of total energy expenditure (TEE), due to advantages such as simplicity, low computational demand, and early adoption by the research community. Traditionally, TEE has been modeled using linear regression with the accelerometer counts extracted from a body-worn, single-axis accelerometer. Despite the reasonably good correlation between the counts and the TEE as illustrated in past studies (24, 45), the estimation accuracy of accelerometer count-based linear regression has been shown to contain systematic errors and varies with the type of activities. For example, it has been shown that, with a linear regression model, the TEE of walking and light activities could be overestimated, while the TEE of moderate-intensity lifestyle activities may be underestimated (5). Such a limitation is presumably due to the insufficient information provided by the counts, which were calculated from the single-axis accelerometer and the simplicity of the linear model that considers the accelerometer counts as the sole variable. Efforts have been made for improving the estimation accuracy by increasing the model complexity, by either extracting more features such as percentiles, kurtosis, skewness from the single-axis accelerometer signal (52, 57), or including physiological (18) or anthropometric features (53, 54) such as height, weight, age. In some studies, polynomial representations or pair-wise interactions between the features as variables (68) in the model have also been used. In addition, variants of standard linear regression models have been proposed for estimating PAEE. For example, Carter et al. (13) considered the TEE to be proportional to body size as an allometric model (55), and therefore a log-linear model was used in their study and the logarithm of TEE was linearly related with the accelerometer counts, the percent fat and the logarithm of the total body mass.
4.2 Nonlinear Regressions
Despite the advantages and reasonable results of using linear approaches for PAEE estimation, questions have been raised as to whether the linear regression is an appropriate approach to model PAEE with body-worn sensor signals (14, 24). Studies (17, 62) have indicated nonlinear relationship between the PAEE and corresponding signals for certain types of activities. For example, Crouter et al. (17) has shown a non-linear, exponential and polynomial (third order) relationship, for two different groups of activities, walking/running and lifestyle/leisure, respectively. Treuth et al. (62) also presented a third-order polynomial regression model for estimating the PAEE. In addition to the “nonlinear” regression approaches discussed above, a few other methods that have recently gained attention for PAEE estimation and are reviewed below.
The Hidden Markov Model (HMM) and Quadratic Discriminant Analysis (QDA) are two commonly used pattern recognition techniques. Although the outcome variable from these computational models is activity type, PAEE can be inferred by combining the techniques with existing the Compendium of Physical Activities PAEE estimates (1). Specifically, the HMM is a probabilistic pattern recognition technique that models the transitions between activities as a discrete stochastic process. The activities, represented as states during such a process, are hidden or unknown, but can be determined by the observable parameters, which are the features extracted from the body-worn sensor signals. Specifically, a separate HMM model can be trained for each activity type (50). Observations/features can then be tested by each HMM model, and the specific activity type of the tested observations or features are identified from the HMM model that yields the largest probability. In comparison, Quadratic Discriminant Analysis (QDA) is a simple machine learning technique that establishes a quadratic surface, which is a pre-defined model that separates activities based on the training feature set. Similar to HMM, QDA classifies the activity type of the observation or feature set according to its probability estimated by the pre-trained model. The specific activity type is determined by the largest probability (50). Both HMM and QDA have been used for estimating the PAEE through a two-stage process. Activity types were first recognized by either HMM or QDA, once trained from a sample dataset (49, 50). The PAEE was then estimated as the corresponding MET level based on the Compendium of Physical Activities (1). For example, Pober et al. (50) employed such a two-stage approach by using HMM to identify the activity type of each observation, and then estimated the PAEE from the Compendium of Physical Activities. Such an approach did not provide the actual energy expenditure values of each activity, but rather an estimate of the time the subjects spent at each PAEE level was used. As a result, the PAEE estimation accuracy by such an approach would rely on and be limited to the values listed in the Compendium of Physical Activities.
Artificial neural network (ANN) and support vector machine (SVM) are two machine learning and nonparametric regression techniques that estimate the PAEE. Different from HMM and QDA, which operate in the original feature/input space, ANN and SVM first transform the original features into a different and usually higher feature space/domain, where the relationship between the features and PAEE is modeled. Such a model built in a higher feature space is less computationally demanding for determining activity types for each new data point added than the model built using the original features, which is often a complex, nonlinear, and implicit function. Specifically, ANN transforms the original features into one or more hidden layers or artificial neurons using activation functions such as the “softmax” function. The SVM converts the original features which usually are in a lower dimensional space to a higher dimensional space by using kernel functions such as a Gaussian radial basis function. Various studies have successfully applied ANN (52, 57) and SVM (33, 43, 53) for estimating PAEE, and promising results have been reported. For example, by applying an ANN model to signals from a biaxial accelerometer worn at hip, Rothney et al. (52) predicted METs of daily activities including deskwork, self-paced walking, jogging, biking, etc., with a mean squared error of 0.25 (equivalent to RMSE of 0.50 METs). Similar results have been reported in other studies, (e.g., in [57]), where the ANN was applied to signals measured by a uniaxial accelerometer in 48 subjects for estimating PAEE (RMSE = 0.75 METs). A PAEE estimation model was developed based on the SVM to achieve an estimation of PAEE with the RMSE of 0.42 METs (43). These advanced machine learning methods are superior compared to other regression methods. For example, Staudenmayer et al. (57) reported a 60% reduction of the PAEE estimation error (RMSE) by ANN over the traditional linear regression method, and a 40% reduction over a two-regression model (17).
4.3 Hybrid Approaches
It has been recognized that the accuracy of the PAEE regression models significantly depends on the specific types of activities used to develop the prediction models, and thus the estimation accuracy of certain types of activities may be better than others (5). As a result, no single regression model is able to estimate the PAEE for a wide range of activities of different intensity levels (14, 17). Therefore, branched regression models and hybrid approaches combining different computational techniques have been developed to enhance the PAEE estimation performance. Such a hybrid approach first separates the signal features into different activity groups based on either certain threshold criteria (11, 17, 21) or activity classification results (43, 53, 54). A regression model or a machine learning method is then used for estimating PAEE after being trained for each activity group. For example, Crouter et al. (17) used the coefficient of variation of accelerometer counts to separate walking/running (CV ≤ 10) and lifestyle/leisure time (CV > 10) activity types. Counts from each activity type were then directed to the appropriate regression model for estimating PAEE. Better PAEE estimation with an average percent error of 1.9% with a mean bias of 0.1 METs (95% confidence interval: -1.1~1.5 METs), was reported using the branched regression model in comparison to using a single linear regression model (60) (average percent error of 4.3%, bias of -0.4 METs). Their results indicate that using this branched regression model for different groups of activities of similar intensity improves the overall PAEE estimation accuracy by 56%. Sazonova et al. (54) applied SVM to first classify activities into one of the four groups (sit, stand, walk and cycle), and then used a separate linear model for each activity group to estimate the PAEE. Similarly, we investigated the utility of SVM to classify activities of similar intensity into four groups (sedentary, household, moderate locomotion, and vigorous sports). Instead of using a linear model, we used the support vector regression – the regression version of SVM, to estimate the PAEE. Result showed that the hybrid approach recognized the four activity groups 89.3% of the time and estimated the PAEE energy expenditure with a RMSE of 0.42 METs (43).
5. Conclusions and New Directions
This paper has presented an overview of recent advances in the estimation of PAEE from body-worn sensors. Specifically, different types of body-worn sensors, features extracted from the sensor signals, and computational methodologies that use the features as inputs have been reviewed. Past studies have primarily applied linear regression models to the accelerometer counts extracted from uniaxial accelerometer activity monitors to estimate the PAEE, due to merits such as relative low cost, low subject burden, long operating life, and simple implementation. Although such an approach is promising (24, 45), the lack of an accurate estimation of PAEE is one major factor that limits its broader impact (14). Seen from the various recent studies, the state of the art of research in PAEE estimation appears to be shifting in the following three directions:
Sensors. New designs and use of multiple accelerometers at different body locations. This is shown in the combined use of physiological sensors such as heart rate monitors and respiratory sensors, with one or more accelerometers, for PAEE estimation. The increased subject burden and cost will need to be examined for viable applications.
Features. Calibration studies that include additional variables other than the accelerometer counts in the estimation model, such as features extracted from the time and frequency domains of the sensor signals. These features represent the statistical distribution and temporal dynamics of the signals, and produce better estimates of the PAEE than using accelerometer counts alone.
Methodology. Advanced machine learning techniques or fusion of different techniques for better differentiation of activities with different intensities. These advanced computational methods should be flexible across subject groups and types of activities, and enable interactions among all input features. Consequently, they should provide better estimation accuracy of PAEE than the traditional regression methods.
Research activities in these three areas have the potential to further advance the state of science and engineering related to the assessment of energy expenditure, and produce a valid, reliable, and accurate estimation of PAEE. Moreover, the current techniques were mostly developed and validated in lab-controlled conditions. Although in some studies, the data were collected in free-living settings, the validation of the developed model was performed in the same way as in lab settings, where the models are generally cross-validated within the whole dataset instead of being evaluated on independent datasets. How to apply the lab-developed estimation model to data collected in real free-living scenario, and how to address various issues related to the validation of the model on free-living data, such as detecting activity transitions (for branched models, where different models are applied to different activity types), selecting an appropriate window size (which is related to the resolution of the detection of activity transitions), collecting labeled training data (the ground truth), etc., certainly deserve significant efforts and investigation in future studies.
Acknowledgments
Disclosure of funding:
The authors gratefully acknowledge funding provided to this research by NIH under grant UO1 CA130783.
The results of the present study do not constitute endorsement by ACSM.
Footnotes
Disclosure of conflict of interest: Shaopeng Liu and Robert Gao do not have any conflicts of interest to declare. Patty Freedson is a member of the ActiGraph Scientific Advisory Board.
References
- 1.Ainsworth BE, Haskell WL, Herrmann SD, Meckes N, Bassett DR, Jr, Tudor-Locke C, Greer JL, Vezina J, Whitt-Glover MC, Leon AS. Compendium of Physical Activities: A second update of codes and MET values. Med Sci Sports Exerc. 2011;43(8):1575–81. doi: 10.1249/MSS.0b013e31821ece12. [DOI] [PubMed] [Google Scholar]
- 2.Arvidsson D, Slinde F, Larsson S, Hulthén L. Energy cost of physical activities in children: validation of SenseWear Armband. Med Sci Sports Exerc. 2007;39(11):2076–84. doi: 10.1249/mss.0b013e31814fb439. [DOI] [PubMed] [Google Scholar]
- 3.Arvidsson D, Slinde F, Larsson S, Hulthén L. Energy cost in children assessed by multisensor activity monitors. Med Sci Sports Exerc. 2009;41(3):603–11. doi: 10.1249/MSS.0b013e31818896f4. [DOI] [PubMed] [Google Scholar]
- 4.Bäcklund C, Sundelin G, Larsson C. Validity of armband measuring energy expenditure in overweight and obese children. Med Sci Sports Exerc. 2010;42(6):1154–61. doi: 10.1249/MSS.0b013e3181c84091. [DOI] [PubMed] [Google Scholar]
- 5.Bassett DR, Ainsworth BE, Swartz AM, Strath SJ, O’Brien WL, King GA. Validity of four motion sensors in measuring moderate intensity physical activity. Med Sci Sports Exerc. 2000;32(9):S471–S80. doi: 10.1097/00005768-200009001-00006. [DOI] [PubMed] [Google Scholar]
- 6.Bassett DR, Rowlands A, Trost SG. Calibration and validation of wearable monitors. Med Sci Sports Exerc. 2012;44:S32–S38. doi: 10.1249/MSS.0b013e3182399cf7. [DOI] [PMC free article] [PubMed] [Google Scholar]
- 7.Bonomi AG, Goris AHC, Yin B, Westerterp KR. Detection of type, duration, and intensity of physical activity using an accelerometer. Med Sci Sports Exerc. 2009;41(9):1770–7. doi: 10.1249/MSS.0b013e3181a24536. [DOI] [PubMed] [Google Scholar]
- 8.Bonomi AG, Plasqui G, Goris AHC, Westerterp KR. Improving assessment of daily energy expenditure by identifying types of physical activity with a single accelerometer. J Appl Physiol. 2009;107(3):655–61. doi: 10.1152/japplphysiol.00150.2009. [DOI] [PubMed] [Google Scholar]
- 9.Bouten CVC, Koekkoek KTM, Verduin M, Kodde R, Janssen JD. A triaxial accelerometer and portable data processing unit for the assessment of daily physical activity. IEEE Trans Biomed Eng. 1997;44(3):136–47. doi: 10.1109/10.554760. [DOI] [PubMed] [Google Scholar]
- 10.Brage S, Brage N, Franks P, Ekelund U, Wareham N. Reliability and validity of the combined heart rate and movement sensor Actiheart. Eur J Clin Nutr. 2005;59(4):561–70. doi: 10.1038/sj.ejcn.1602118. [DOI] [PubMed] [Google Scholar]
- 11.Brage S, Brage N, Franks PW, Ekelund U, Wong MY, Andersen LB, Froberg K, Wareham NJ. Branched equation modeling of simultaneous accelerometry and heart rate monitoring improves estimate of directly measured physical activity energy expenditure. J Appl Physiol. 2004;96(1):343–51. doi: 10.1152/japplphysiol.00703.2003. [DOI] [PubMed] [Google Scholar]
- 12.Calabró MA, Welk GJ, Eisenmann JC. Validation of the SenseWear Pro Armband algorithms in children. Med Sci Sports Exerc. 2009;41(9):1714–20. doi: 10.1249/MSS.0b013e3181a071cf. [DOI] [PubMed] [Google Scholar]
- 13.Carter J, Wilkinson D, Blacker S, Rayson M, Bilzon J, Izard R, Coward A, Wright A, Nevill A, Rennie K. An investigation of a novel three-dimensional activity monitor to predict free-living energy expenditure. J Sports Sci. 2008;26(6):553–61. doi: 10.1080/02640410701708979. [DOI] [PubMed] [Google Scholar]
- 14.Chen KY, Bassett DR. The technology of accelerometry-based activity monitors: current and future. Med Sci Sports Exerc. 2005;37(11):S490–S500. doi: 10.1249/01.mss.0000185571.49104.82. [DOI] [PubMed] [Google Scholar]
- 15.Corder K, Brage S, Mattocks C, Ness A, Riddoch C, Wareham N, Ekelund U. Comparison of two methods to assess PAEE during six activities in children. Med Sci Sports Exerc. 2007;39(12):2180–8. doi: 10.1249/mss.0b013e318150dff8. [DOI] [PubMed] [Google Scholar]
- 16.Corder K, Brage S, Wareham NJ, Ekelund U. Comparison of PAEE from combined and separate heart rate and movement models in children. Med Sci Sports Exerc. 2005;37(10):1761–7. doi: 10.1249/01.mss.0000176466.78408.cc. [DOI] [PubMed] [Google Scholar]
- 17.Crouter SE, Clowers KG, Bassett DR. A novel method for using accelerometer data to predict energy expenditure. J Appl Physiol. 2006;100(4):1324–31. doi: 10.1152/japplphysiol.00818.2005. [DOI] [PubMed] [Google Scholar]
- 18.De Bock F, Menze J, Becker S, Litaker D, Fischer J, Seidel I. Combining accelerometry and HR for assessing preschoolers’ physical activity. Med Sci Sports Exerc. 2010;42(12):2237–43. doi: 10.1249/MSS.0b013e3181e27b5d. [DOI] [PubMed] [Google Scholar]
- 19.Díaz V, Benito PJ, Peinado AB, Álvarez M, Martín C, Di Salvo V, Pigozzi F, Maffulli N, Calderón FJ. Validation of a new portable metabolic system during an incremental running test. J Sports Sci Med. 2008;7:532–36. [PMC free article] [PubMed] [Google Scholar]
- 20.Donahoo WT, Levine JA, Melanson EL. Variability in energy expenditure and its components. Curr Opin Clin Nutr Metab Care. 2004;7(6):599–605. doi: 10.1097/00075197-200411000-00003. [DOI] [PubMed] [Google Scholar]
- 21.Edwards AG, Hill JO, Byrnes WC, Browning RC. Accuracy of optimized branched algorithms to assess activity-specific PAEE. Med Sci Sports Exerc. 2010;42(4):672–82. doi: 10.1249/MSS.0b013e3181bd196d. [DOI] [PMC free article] [PubMed] [Google Scholar]
- 22.Ekelund U, Sjöström M, Yngve A, Poortvliet E, Nilsson A, Froberg K, Wedderkopp N, Westerterp K. Physical activity assessed by activity monitor and doubly labeled water in children. Med Sci Sports Exerc. 2001;33(2):275–81. doi: 10.1097/00005768-200102000-00017. [DOI] [PubMed] [Google Scholar]
- 23.Foerster F, Smeja M, Fahrenberg J. Detection of posture and motion by accelerometry: a validation study in ambulatory monitoring. Comput Hum Behav. 1999;15(5):571–83. [Google Scholar]
- 24.Freedson P, Pober D, Janz KF. Calibration of accelerometer output for children. Med Sci Sports Exerc. 2005;37(11):S523–S30. doi: 10.1249/01.mss.0000185658.28284.ba. [DOI] [PubMed] [Google Scholar]
- 25.Fruin ML, Rankin JW. Validity of a multi-sensor armband in estimating rest and exercise energy expenditure. Med Sci Sports Exerc. 2004;36(6):1063–9. doi: 10.1249/01.mss.0000128144.91337.38. [DOI] [PubMed] [Google Scholar]
- 26.Gardiner PA, Clark BK, Healy GN, Eakin EG, Winkler EAH, Owen N. Measuring older adults’ sedentary time: reliability, validity and responsiveness. Med Sci Sports Exerc. 2011;43(11):2127–33. doi: 10.1249/MSS.0b013e31821b94f7. [DOI] [PubMed] [Google Scholar]
- 27.Harris TJ, Owen CG, Victor CR, Adams R, Ekelund U, Cook DG. A comparison of questionnaire, accelerometer, and pedometer: measures in older people. Med Sci Sports Exerc. 2009;41(7):1392–402. doi: 10.1249/MSS.0b013e31819b3533. [DOI] [PubMed] [Google Scholar]
- 28.Heil DP. Predicting activity energy expenditure using the Actical[R] activity monitor. Res Q Exerc Sport. 2006;77(1):64–80. doi: 10.1080/02701367.2006.10599333. [DOI] [PubMed] [Google Scholar]
- 29.Hendelman D, Miller K, Bagget C, Debold E, Freedson P. Validity of accelerometry for the assessment of moderate intensity physical activity in the field. Med Sci Sports Exerc. 2000;32(9):442–9. doi: 10.1097/00005768-200009001-00002. [DOI] [PubMed] [Google Scholar]
- 30.Huynh T, Schiele B. Analyzing features for activity recognition. Proceedings of the 2005 joint conference on Smart objects and ambient intelligence: innovative context-aware services: usages and technologies (sOc-EUSAI ’05); 2005; New York, NY, USA. pp. 159–63. [Google Scholar]
- 31.Johannsen DL, Calabro MA, Stewart J, Franke W, Rood JC, Welk GJ. Accuracy of armband monitors for measuring daily energy expenditure in healthy adults. Med Sci Sports Exerc. 2010;42(11):2134–40. doi: 10.1249/MSS.0b013e3181e0b3ff. [DOI] [PubMed] [Google Scholar]
- 32.John D, Freedson P. ActiGraph and actical physical activity monitors: a peek under the hood. Med Sci Sports Exerc. 2012;44:S86–S89. doi: 10.1249/MSS.0b013e3182399f5e. [DOI] [PMC free article] [PubMed] [Google Scholar]
- 33.John D, Liu S, Sasaki JE, Howe CA, Staudenmayer J, Gao RX, Freedson PS. Calibrating a novel multi-sensor physical activity measurement system. Physiol Meas. 2011;32(9):1473–89. doi: 10.1088/0967-3334/32/9/009. [DOI] [PMC free article] [PubMed] [Google Scholar]
- 34.Kim T, Kim Y, Yoon H, Shin T. A preliminary study on estimation of energy expenditure at different locations of acceleration sensor during submaximal exercise. Proceedings of the 31st Annual International Conference of the IEEE Engineering in Medicine and Biology Society; 2009. pp. 4902–5. [DOI] [PubMed] [Google Scholar]
- 35.Koehler K, Braun H, de Marées M, Fusch G, Fusch C, Schaenzer W. Assessing energy expenditure in male endurance athletes: validity of the SenseWear armband. Med Sci Sports Exerc. 2011;43(7):1328–33. doi: 10.1249/MSS.0b013e31820750f5. [DOI] [PubMed] [Google Scholar]
- 36.Kozey-Keadle S, Libertine A, Lyden K, Staudenmayer J, Freedson P. Validation of wearable monitors for assessing sedentary behavior. Med Sci Sports Exerc. 2011;43(8):1561–7. doi: 10.1249/MSS.0b013e31820ce174. [DOI] [PubMed] [Google Scholar]
- 37.Kozey SL, Lyden K, Howe CA, Staudenmayer JW, Freedson PS. Accelerometer output and MET values of common physical activities. Med Sci Sports Exerc. 2010;42(9):1776–84. doi: 10.1249/MSS.0b013e3181d479f2. [DOI] [PMC free article] [PubMed] [Google Scholar]
- 38.Kozey SL, Lyden K, Staudenmayer J, Freedson P. Errors in MET estimates of physical activities using 3.5 ml.kg-1.min-1 as the baseline oxygen consumption. J Physical Activity and Health. 2010;7:508–16. doi: 10.1123/jpah.7.4.508. [DOI] [PubMed] [Google Scholar]
- 39.Lee M, Zhu W, Hedrick B, Fernhall B. Estimating MET values using the ratio of HR for persons with paraplegia. Med Sci Sports Exerc. 2010;42(5):985–90. doi: 10.1249/MSS.0b013e3181c0652b. [DOI] [PubMed] [Google Scholar]
- 40.Leenders N, Sherman W, Nagaraja H, Kien C. Evaluation of methods to assess physical activity in free-living conditions. Med Sci Sports Exerc. 2001;33(7):1233–40. doi: 10.1097/00005768-200107000-00024. [DOI] [PubMed] [Google Scholar]
- 41.Li Z. Exercises intensity estimation based on the physical activities healthcare system. In. Proceedings of 2009 WRI International Conference on Communications and Mobile Computing; 2009. pp. 132–6. [Google Scholar]
- 42.Liu S, Gao RX, Freedson P. Design of a wearable multi-sensor system for physical activity assessment. Proceedings of IEEE/ASME Int Conf on Advanced Intelligent Mechatronics; 2010. pp. 254–9. [Google Scholar]
- 43.Liu S, Gao RX, John D, Staudenmayer J, Freedson P. Multi-sensor data fusion for physical activity assessment. IEEE Trans Biomed Eng. 2012;59(3):687–96. doi: 10.1109/TBME.2011.2178070. [DOI] [PubMed] [Google Scholar]
- 44.Matsumura T, Chemmalil V, Gray M, Keating J, Kieselbach R, Latta S, Occhialini N, Kinnal E, O’Toole S, Peura R. Device for measuring real-time energy expenditure by heart rate and acceleration for diabetic patients. Proceedings of the Bioengineering Conference, 2009 IEEE 35th Annual Northeast; 2009; Boston, MA, USA. pp. 1–2. [Google Scholar]
- 45.Matthews CE. Calibration of accelerometer output for adults. Med Sci Sports Exerc. 2005;37(11):S512–S22. doi: 10.1249/01.mss.0000185659.11982.3d. [DOI] [PubMed] [Google Scholar]
- 46.McArdle WD, Katch FL, Katch VL. Exercise Physiology: Nutrition, Energy, and Human Performance. Fifth. Lippincott Williams & Wilkins; 2001. p. 871. [Google Scholar]
- 47.McClain JJ, Abraham TL, Brusseau TA, Tudor-Locke C. Epoch length and accelerometer outputs in children: comparison to direct observation. Med Sci Sports Exerc. 2008;40(12):2080–7. doi: 10.1249/MSS.0b013e3181824d98. [DOI] [PubMed] [Google Scholar]
- 48.Plasqui G, Joosen AM, Kester AD, Goris AH, Westerterp KR. Measuring free-living energy expenditure and physical activity with triaxial accelerometry. Obesity Research. 2005;13:1363–9. doi: 10.1038/oby.2005.165. [DOI] [PubMed] [Google Scholar]
- 49.Pober DM, Raphael C, Freedson PS. Novel technique for assessing physical activity using accelerometer data. Med Sci Sports Exerc. 2004;36(5):S198. doi: 10.1249/01.mss.0000227542.43669.45. [DOI] [PubMed] [Google Scholar]
- 50.Pober DM, Staudenmayer J, Raphael C, Freedson PS. Development of novel techniques to classify physical activity mode using accelerometers. Med Sci Sports Exerc. 2006;38(9):1626–34. doi: 10.1249/01.mss.0000227542.43669.45. [DOI] [PubMed] [Google Scholar]
- 51.Preece SJ, Goulermas JY, Kenney LPJ, Howard D, Meijer K, Crompton R. Activity identification using body-mounted sensors – a review of classification techniques. Physiol Meas. 2009;30(4):R1–R33. doi: 10.1088/0967-3334/30/4/R01. [DOI] [PubMed] [Google Scholar]
- 52.Rothney MP, Neumann M, Béziat A, Chen KY. An artificial neural network model of energy expenditure using nonintegrated acceleration signals. J Appl Physiol. 2007;103(4):1419–27. doi: 10.1152/japplphysiol.00429.2007. [DOI] [PubMed] [Google Scholar]
- 53.Rumo M, Amft O, Tröster G, Mäder U. A stepwise validation of a wearable system for estimating energy expenditure in field-based research. Physiol Meas. 2011;32(12):1983–2001. doi: 10.1088/0967-3334/32/12/008. [DOI] [PubMed] [Google Scholar]
- 54.Sazonova N, Browning RC, Sazonov E. Accurate Prediction of Energy Expenditure Using a Shoe-Based Activity Monitor. Med Sci Sports Exerc. 2011;43(7):1312–21. doi: 10.1249/MSS.0b013e318206f69d. [DOI] [PubMed] [Google Scholar]
- 55.Schmidt-Nielsen K. Scaling, Why is Animal Size so Important? Cambridge: Cambridge University Press; 1984. p. 58. [Google Scholar]
- 56.Schmitz KH, Treuth M, Hannan P, McMurray R, Ring KB, Catellier D, Pate R. Predicting energy expenditure from accelerometry counts in adolescent girls. Med Sci Sports Exerc. 2005;37(1):155–61. doi: 10.1249/01.MSS.0000150084.97823.F7. [DOI] [PMC free article] [PubMed] [Google Scholar]
- 57.Staudenmayer J, Pober D, Crouter S, Bassett D, Freedson P. An artificial neural network to estimate physical activity energy expenditure and identify physical activity type from an accelerometer. J Appl Physiol. 2009;107(4):1300–7. doi: 10.1152/japplphysiol.00465.2009. [DOI] [PMC free article] [PubMed] [Google Scholar]
- 58.Strath SJ, Bassett DR, Thompson DL, Swartz ANNM. Validity of the simultaneous heart rate-motion sensor technique for measuring energy expenditure. Med Sci Sports Exerc. 2002;34(5):888–94. doi: 10.1097/00005768-200205000-00025. [DOI] [PubMed] [Google Scholar]
- 59.Strath SJ, Brage S, Ekelund U. Integration of physiological and accelerometer data to improve physical activity assessment. Med Sci Sports Exerc. 2005;37(11):S563–S71. doi: 10.1249/01.mss.0000185650.68232.3f. [DOI] [PubMed] [Google Scholar]
- 60.Swartz AM, Strath SJ, Bassett DR, Jr, O’Brien WL, King GA, Ainsworth BE. Estimation of energy expenditure using CSA accelerometers at hip and wrist sites. Med Sci Sports Exerc. 2000;32:S450–S456. doi: 10.1097/00005768-200009001-00003. [DOI] [PubMed] [Google Scholar]
- 61.Tharion WJ, Yokota M, Buller MJ, DeLany JP, Hoyt RW. Total energy expenditure estimated using a foot-contact pedometer. Med Sci Monit. 2004;10(9):CR504–9. [PubMed] [Google Scholar]
- 62.Treuth MS, Schmitz K, Catellier DJ, McMurracy RG, Murray DM, Almeida MJ, Going S, Norman JE, Pate R. Defining accelerometer thresholds for activity intensities in adolescent girls. Med Sci Sports Exerc. 2004;36(7):1259–66. [PMC free article] [PubMed] [Google Scholar]
- 63.Trost SG, Loprinzi PD, Moore R, Pfeiffer KA. Comparison of accelerometer cut points for predicting activity intensity in youth. Med Sci Sports Exerc. 2011;43(7):1360–8. doi: 10.1249/MSS.0b013e318206476e. [DOI] [PubMed] [Google Scholar]
- 64.U.S. Department of Health and Human Services. Physical Activity Guidelines Advisory Committee Report. Washington: US Department of Health and Human Services, Office of Disease Prevention and Health Promotion; 2008. pp. A2–4. Available from: US Department of Health and Human Services. [Google Scholar]
- 65.U.S. Department of Health and Human Services. Healthy People 2020 Objectives. Washington, DC, USA: US Department of Health and Human Services; 2010. pp. 263–72. Available from: US Department of Health and Human Services. [Google Scholar]
- 66.Webster J, Welsh G, Pacy P, Garrow J. Description of a human direct calorimeter, with a note on the energy cost of clerical work. Brit J Nutr. 1986;55:1–6. doi: 10.1079/bjn19860003. [DOI] [PubMed] [Google Scholar]
- 67.Wong WY, Wong MS. Detecting spinal posture change in sitting positions with tri-axial accelerometers. Gait Posture. 2008;27(1):168–71. doi: 10.1016/j.gaitpost.2007.03.001. [DOI] [PubMed] [Google Scholar]
- 68.Zakeri I, Adolph AL, Puyau MR, Vohra FA, Butte NF. Application of cross-sectional time series modeling for the prediction of energy expenditure from heart rate and accelerometry. J Appl Physiol. 2008;104(6):1665–73. doi: 10.1152/japplphysiol.01163.2007. [DOI] [PubMed] [Google Scholar]
- 69.Zhang K, Pi-Sunyer FX, Boozer CN. Improving energy expenditure estimation for physical activity. Med Sci Sports Exerc. 2004;36(5):883–9. doi: 10.1249/01.mss.0000126585.40962.22. [DOI] [PubMed] [Google Scholar]
- 70.Zhang K, Werner P, Sun M, Pi-Sunyer FX, Boozer CN. Measurement of human daily physical activity. Obesity. 2003;11(1):33–40. doi: 10.1038/oby.2003.7. [DOI] [PubMed] [Google Scholar]