Abstract
Objective. To characterize the 2008-2009 Pharmacy College Application Service (PharmCAS) applicant pool in terms of diversity-related variables compared with admissions-related variables.
Methods. The relationships between the diversity variables of ethnicity, gender, parental education, and prepharmacy education, and the admissions-related variables of grade point average (GPA), pharmacy college admission test (PCAT) score, and acceptance rates were evaluated.
Results. There were 16,246 applicants to PharmCAS during the 2008-2009 pharmacy college and school admission cycle. Female applicants and non-underrepresented minorities (non-URMs) achieved higher mean GPAs, and male applicants and non-URMs had higher mean PCAT scores. Higher parental education was associated with higher mean GPA and PCAT scores. Mean PCAT score and GPA increased as prepharmacy education increased, with the exception of a bachelor’s degree, which was associated with a lower GPA. Acceptance rates were higher among female applicants, non-URMs, and applicants with higher prepharmacy education and parental education.
Conclusions. Female applicants, non-URMs, applicants with higher than a bachelor’s degree, and applicants whose parents attained a doctoral degree were associated with higher mean GPAs and PCAT scores and were accepted to a higher proportion of the colleges and schools to which they applied. Colleges and schools of pharmacy can use these data as a benchmark when evaluating admissions processes.
Keywords: PharmCAS, admissions, applicant, diversity, minority
INTRODUCTION
Pharmacists serve a diverse patient population and, with that, comes a responsibility to diversify the pharmacy workforce. In 2004, the Sullivan Commission published a report stating that higher concordance between the racial/ethnic background of the patient and that of the provider lead to more positive clinical outcomes and higher perceived quality of care.1 Providers exposed to a diverse population of peers are also more likely to serve underrepresented populations, thereby increasing access to health care for the underserved.1-4 As it stands now, the ethnic demographics of the pharmacy workforce have not changed since 2000, despite an increase in Hispanic/Latino, African-American, Asian, and Native Hawaiian ethnicities and a decrease in the Caucasian ethnicity, as documented in the 2010 US census.5,6 The discrepancy between the pharmacy workforce and the national population, which has been propagated by a lack of diversity in pharmacy school admissions, adds to the discordance between patient and provider.
Realizing the importance of this working relationship, the American Society of Health-Systems Pharmacy (ASHP) created a task force to address this issue in 2007. The task force published a report establishing goals and objectives on how the pharmacy profession should address demographic disparities within the profession.7 In order to make headway on the goals set forth by ASHP and other organizations, an evaluation of the characteristics of the national pharmacy school applicant pool is critical.
The American Association of Colleges of Pharmacy (AACP) publishes annual reports summarizing aggregate applicant data in the context of future workforce, incoming workforce (recent graduates), and current workforce.8 With regard to the pharmacy applicant pool, the data presented in these reports are limited to reporting numbers of submitted applications categorized by demographic characteristics (ie, ethnicity, gender, and prepharmacy education). The AACP does not report aggregate data on other variables that further describe the applicant pool, such as parental education, mean grade point average (GPA), pharmacy college admission test (PCAT) scores, and overall acceptance rates. The limited availability of this information has been mentioned in several publications reporting on diversity in pharmacy.9-11
Chisholm-Burns, who addressed the issue of diversity in 2007, suggested a working definition of diversity that includes but is not limited to the characteristics of religion, sexual orientation, social economic status, personal and parental education, language, and disabilities.12 This definition served as a blueprint for the current study; however, based on the nature of Pharmacy College Application Service (PharmCAS) data, not all demographic variables could be accounted for. The objective of this study was to investigate the relationships between applicants’ race/ethnicity, gender, parental education, and prepharmacy education and their prepharmacy school GPA, PCAT score, and pharmacy college or school acceptance rates.
METHODS
A secondary data analysis was conducted on the 2008-2009 pharmacy school applicant pool using de-identified data from PharmCAS. The PharmCAS dataset was used in this study to assess relationships between available independent variables of diversity (ie, ethnicity, gender, parental education, prepharmacy education) and the following dependent variables: GPA (overall, science, math), PCAT (scores, number of attempts), number of applications submitted, and acceptance rate (overall, public schools, private schools, and colleges and schools ranked in the top 10 in 2009 by U.S. News & World Report and the top 10 colleges and schools receiving National Institutes of Health [NIH] funding in 2009, as ranked by AACP).
Although variables of diversity are multifactorial, ethnicity, gender, parental education and prepharmacy education were most clearly defined by the dataset and collected in PharmCAS by applicant self-report. Race/ethnicity was defined by the categories available within PharmCAS.13 The variables were then subcategorized as URMs inclusive of black or African-American, Hispanic or Latino, and Native American (American Indian or Alaska Native).14 Non-URMs comprised all other ethnicities available for self-report (ie, Asian, White, Native Hawaiian, Other Pacific Islander, Other). Gender was defined as self-reported male or female. Parental education was defined as the highest degree obtained by at least 1 of the applicant’s parents based on the categories available within PharmCAS, stratified as unknown, no degree/certificate/diploma, trade certificate/diploma, high school degree or equivalent, some college, associate’s degree, bachelor’s degree, master’s degree, professional degree, and earned doctoral degree. Prepharmacy education was defined as the highest degree obtained by the applicant at the time of application and was stratified as lower than a bachelor’s degree, bachelor’s degree, and higher than a bachelor’s degree.
Admissions committees evaluate an applicant based on quantitative (GPA, PCAT) and qualitative (unique personal attributes and experiences) characteristics. This study evaluated quantitative variables present in the dataset. Dependent variables (otherwise referred to as admissions-related variables) assessed included overall, science, and math GPA; applicant PCAT score; number of PCAT attempts; and number of colleges and schools to which an application was submitted. Data in the dataset were used to calculate an overall acceptance rate; acceptance rates to top 10 colleges and schools in 2009 as rated by U.S. News & World Report; acceptance rates to top 10 colleges and schools in 2009 (ranked by NIH funding) as rated by AACP; and acceptance rates to public and private schools.
Data were analyzed with SPSS version 18.0 (SPSS, Inc., Chicago IL) to generate a cross-sectional descriptive analysis as well as to evaluate comparisons between groups using independent samples t tests and one-way analysis of variance (ANOVA), as appropriate. Data were evaluated based on a significance level (α) of 0.05. Statistical analyses were verified by consultant statisticians.
RESULTS
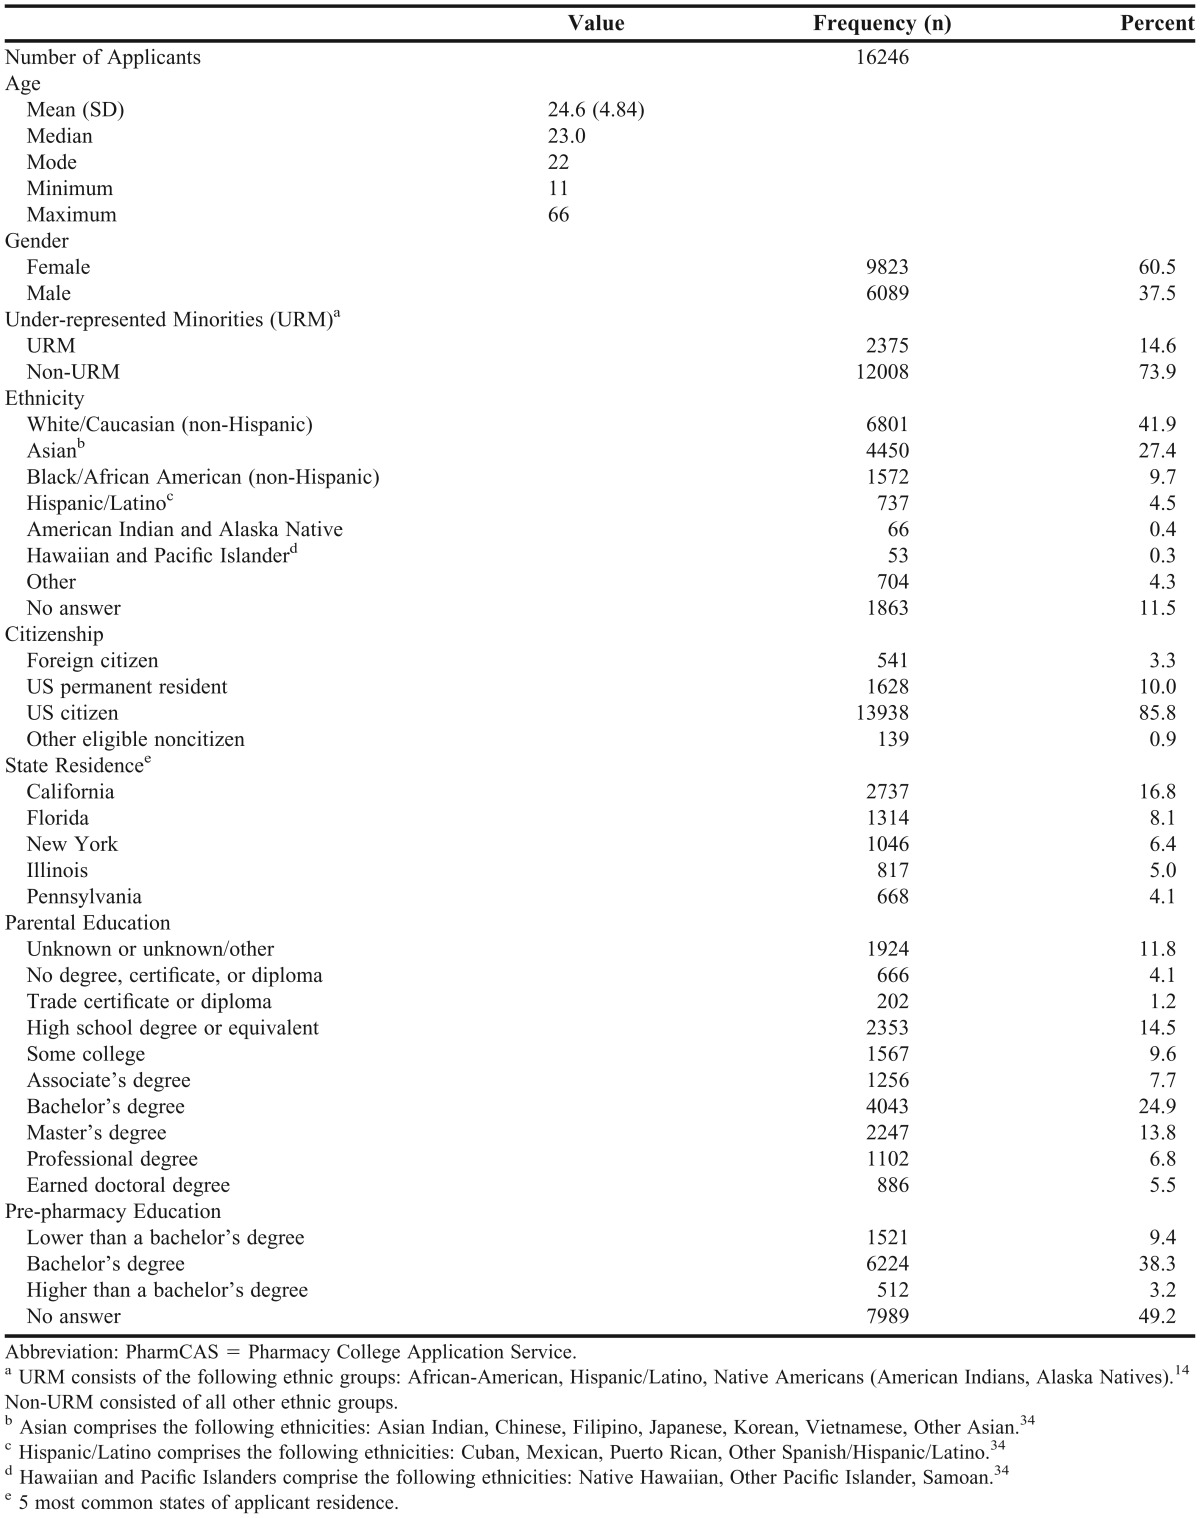
There were 16,246 applicants who used PharmCAS during the 2008-2009 pharmacy college and school admission cycle, completing a total of 77,961 applications. Descriptive statistics for diversity variables are summarized in Table 1, and dependent variables are summarized in Table 2.
Table 1.
Summary Diversity Variables of the 2008-2009 PharmCAS Applicants, as Reported by Applicants
Table 2.
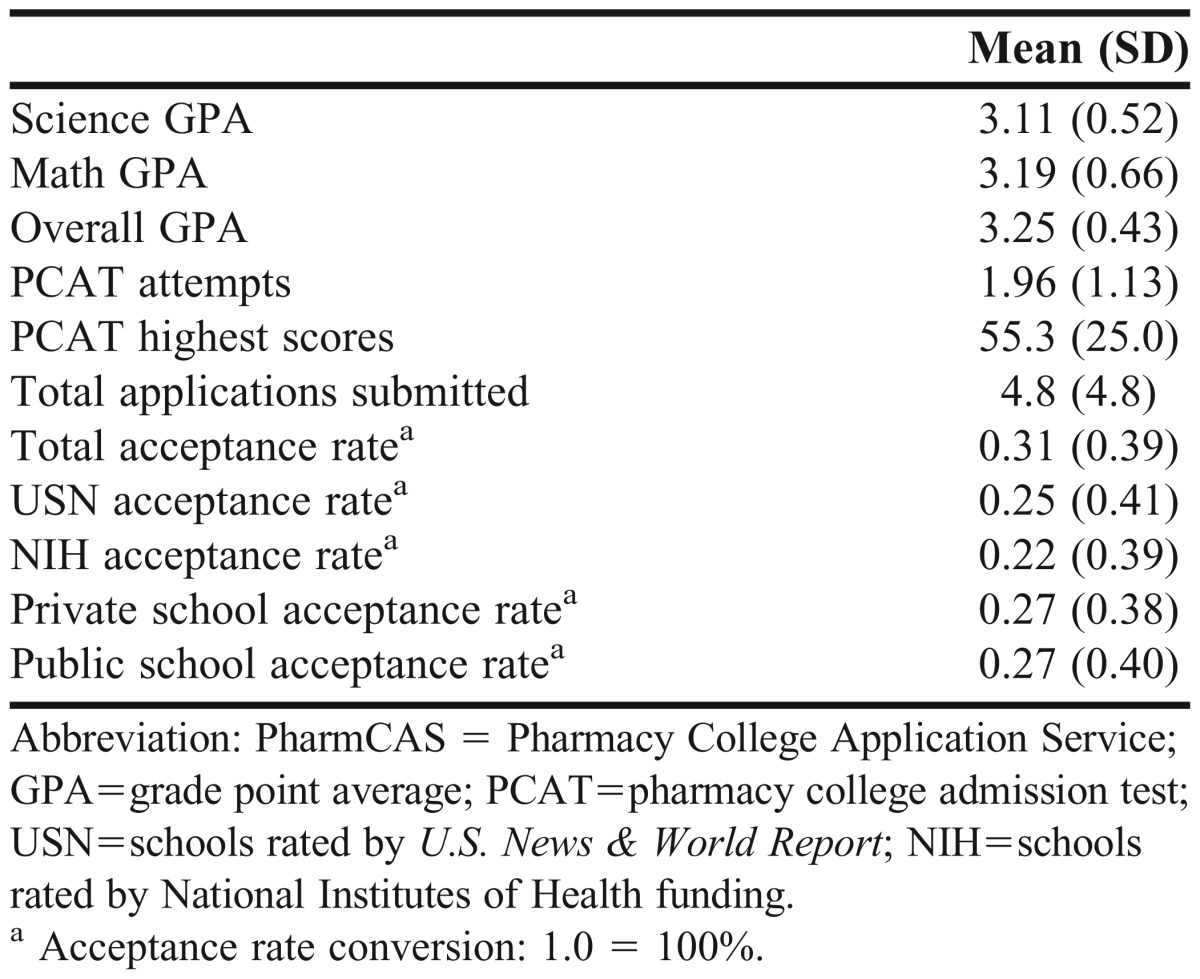
Admissions-Related Variables of 2008-2009 PharmCAS Applicantsa
Underrepresented minorities applicants, as compared with non-URM applicants, had a lower mean overall GPA [3.13 ± 0.45 (SD) vs 3.27 ± 0.42; p<0.0001], science GPA (2.99 ± 0.54 vs 3.13 ± 0.51; p<0.001), and math GPA (2.99 ± 0.70 vs 3.23 ± 0.64; p<0.001). Following the trend of GPA, URMs also received lower mean percentile scores on the PCAT (42.84 ± 24.67 vs 57.46 ± 24.29; p<0.0001), and took the PCAT more times (2.1 ± 1.2 attempts vs 1.9 ± 1.1 attempts; p<0.0001). There was no significant difference between the number of applications submitted by URMs and non-URMs (4.7 ± 4.1 vs 4.8 ± 5.0; p=0.119).
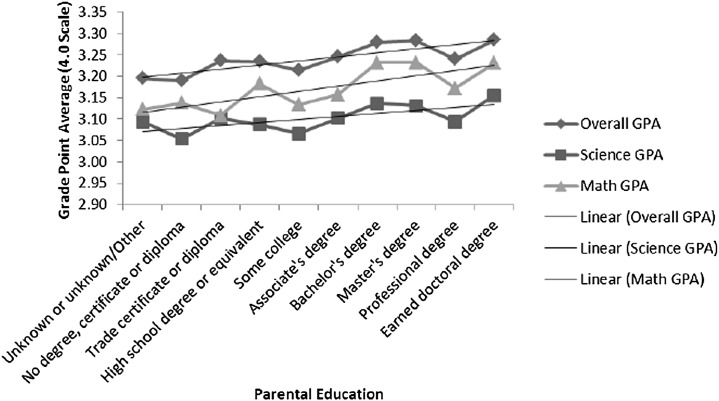
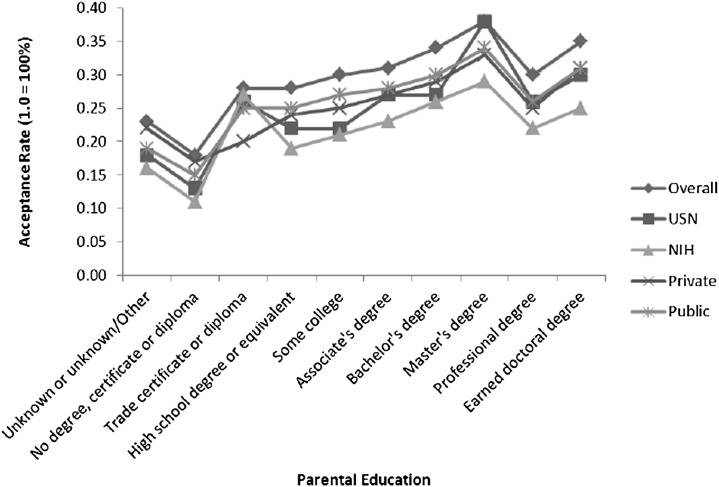
Non-URMs had a significantly (p<0.0001) higher acceptance rate than did URMs for all schools applied to (33% vs 21%), top 10 ranked by U.S. News & World Report (27% vs 17%), top 10 NIH-funded schools ranked by AACP (24% vs 16%), private schools (28% vs 20%), and public schools (29% vs 18%). Female applicants had higher mean overall and math GPA than did male applicants (3.27 ± 0.43 vs 3.21 ± 0.43 and 3.22 ± 0.65 vs 3.14 ± 0.67; p<0.001), respectively. With regard to PCAT, female applicants took the PCAT test more frequently (2.0 ± 1.1 attempts vs 1.9 ± 1.1 attempts) but scored lower than did male applicants (52.68 ± 24.85 vs 59.47 ± 24.67; p<0.001). Compared with female applicants, male applicants submitted more applications (5.1 ± 5.0 vs 4.6 ± 4.6; p<0.0001). There was no significant difference (p>0.09) between female and male applicants with respect to acceptance rates to all school types, except for public schools, for which female applicants had a higher acceptance rate (28% vs 26%; p=0.017). Figures 1 and 2 illustrate the trends between parental education, GPA, and acceptance rate. Increased parental education was significantly (p<0.0001) associated with a trend toward increasing GPA, PCAT scores, and acceptance rates. Although a significant difference (p<0.0001) was shown for number of applications submitted and number of PCAT attempts, no clear trend was observed.
Figure 1.
Relationship Between an Applicant’s Parental Education and Overall, Science, and Math Grade Point Average (GPA)
Figure 2.
Relationship Between Applicants’ Parental Education and Rates of Acceptance to Pharmacy Colleges and Schools, by Category. Abbreviations: USN=schools rated by U.S. News & World Report; NIH=schools rated by National Institutes of Health funding.
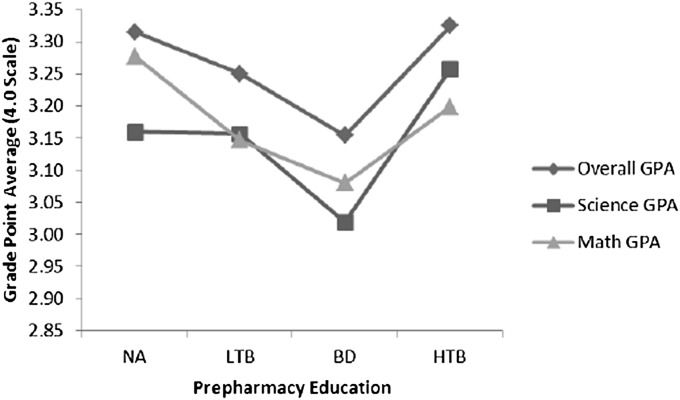
The relationship between an applicant’s prepharmacy education and GPA (science, math and overall) follows a U-shaped curve, as shown in Figure 3. The mean scores of applicants with a bachelor’s degree were significantly lower (p<0.0001) in science, math, and overall GPA (3.02 ± 0.48, 3.07 ± 0.65, and 3.15 ± 0.40, respectively) than were those of applicants with lower than a bachelor’s degree (3.16 ± 0.52, 3.15 ± 0.65, and 3.25 ± 0.44, respectively) as well as those with higher than a bachelor’s degree (3.26 ± 0.48, 3.20 ± 0.65, and 3.33 ± 0.40, respectively). In terms of highest PCAT score reported, there was a positive linear relationship. Applicants with lower than a bachelor’s degree (48.25 ± 24.81) scored, on average, 9.18 percentage points lower than did those with a bachelor’s degree (57.43 ± 25.04), who, in turn, scored on average of 5.25 percentage points lower than did applicants with higher than a bachelor’s degree (62.68 ± 27.58). This relationship was reversed when looking at the number of times the PCAT was attempted. Applicants with lower than a bachelor’s degree, a bachelor’s degree, and higher than a bachelor’s degree took the PCAT, on average, 2.3 ± 1.3, 2.0 ± 1.2, and 1.7 ± 1.0 times, respectively. Applicants with a bachelor’s degree submitted more applications (5.9 ± 5.5) than did applicants with lower than a bachelor’s degree (4.7 ± 4.9) and applicants with higher than a bachelor’s degree (4.2 ± 4.8). Each of these relationships showed significance (p<0.0001).
Figure 3.
Relationship Between an Applicant’s Prepharmacy Education and Overall, Science, and Math Grade Point Average (GPA). Abbreviations: NA = not applicable; LTB = lower than bachelor’s degree; BD = bachelor’s degree; HTB = higher than bachelor’s degree.
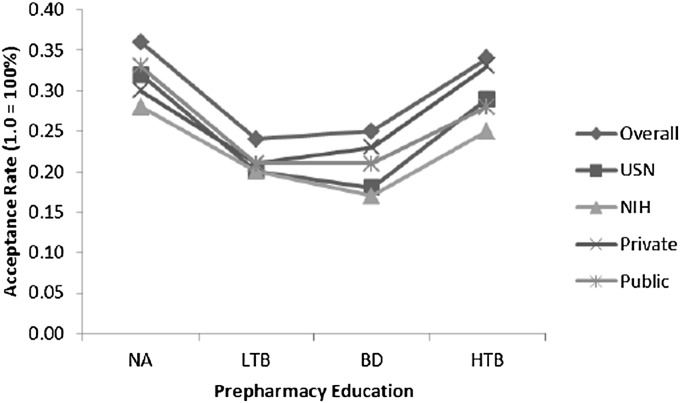
There was a significant (p<0.0001) association between increasing prepharmacy education and higher total, private, and public school acceptance rates. Both top 10 ranked schools by U.S. News & World Report and top 10 NIH-funded schools ranked by AACP showed a U-curve relationship, with a dip in acceptance rates among applicants with bachelor’s degrees. These trends are illustrated in Figure 4.
Figure 4.
Relationship Between an Applicants’ Prepharmacy Education and Rates of Acceptance to Pharmacy Colleges and Schools, by Category. Abbreviations: USN=schools rated by U.S. News & World Report; NIH=schools rated by National Institutes of Health funding; NA=not applicable; LTB=lower than bachelor’s degree; BD=bachelor’s degree; HTB=higher than bachelor’s degree.
DISCUSSION
We have begun the process of examining diversity among pharmacy college and school applicants by analyzing ethnicity, gender, parental education, and prepharmacy education and comparing these variables with respect to GPA, PCAT scores, application submission rates, and acceptance rates. In our dataset, the highest mean GPA and highest mean PCAT scores were associated with the following demographic groups: female applicants, non-URMs, applicants with higher than a bachelor’s degree, and applicants with parents who had attained a doctoral degree. We also found that these same types of applicants were accepted to a higher proportion of the schools to which they applied.
This study found that URMs had lower science, math, and overall GPAs than did their non-underrepresented counterparts. This trend is consistent with national reports put forth by the US Department of Education.16 Throughout grades K-12, URMs consistently have lower GPAs in math and science than do Caucasians and Asians and have been found to enroll in comparatively fewer science courses at the secondary education level.16 GPA was also seen to have a direct relationship with an applicant’s parental education. Those with lower levels of parental education had lower mean GPAs in science, math, and overall. Interestingly, general education literature also reports that URM students are associated with parents with lower levels of education.17,18 Although this study did not perform analyses between an applicant’s parental education level and URM status, the 2 can be interrelated. Further research is warranted to further investigate this possibility.
Gender was also reflective of GPA differences in our dataset. Although numerically slight, female applicants had significantly higher mean overall and math GPAs. This finding is contrary to national education statistics, which show that male applicants outperform female applicants in math starting at a young age and greatly outnumber female applicants in the attainment of doctoral degrees in science and math.19 Prepharmacy education level was associated with GPA scores in an unexpected trend: applicants with a bachelor’s degree had the lowest GPA in all categories. Applicants with higher than a bachelor’s degree earned higher GPAs, which could be attributed to self-selection, wherein applicants with higher GPAs tend to apply for graduate-level degree programs and/or the graduate schools require a minimum GPA to remain in the program. On the other end of the spectrum, applicants who have lower than a bachelor’s degree may not have completed the more challenging upper division coursework to factor into the GPA calculation.
The number of times an applicant took the PCAT was inversely related to the mean score achieved among all the subgroups analyzed. Female applicants, who had higher math GPAs and similar science GPAs to those of male applicants, actually scored lower on the PCAT. This inconsistency is also seen among female applicants with high GPAs and better performance on other standardized achievement tests.20 Similarly, URMs scored lower on the PCAT, mirroring their performance on other standardized achievement tests.17,21 Improvement in PCAT performance paralleled increases in parental education and applicant educational background from lower than a bachelor’s degree to higher than a bachelor’s degree.
Unlike the GPA, the PCAT is not used by all colleges and schools of pharmacy to determine an applicant’s candidacy. However, many colleges and schools of pharmacy consider this measure in admissions decisions and the majority of applicants (79.5% vs 20.5%) have taken this examination at least once. Kelley and colleagues showed differences in PCAT composite scores within ethnicity, gender, and primary language; however, these differences were not found to be relevant in predicting an applicant’s admission,22 suggesting that the PCAT, a standardized test, is not used in the admissions process in a standard way across all colleges and schools of pharmacy.
Higher total acceptance rates were noted in applicants with higher GPA and PCAT scores. GPA and PCAT scores are both quantitative measures often used by admissions committees to evaluate how prepared an applicant may be for pharmacy school, and they have been shown to act as moderate to strong predictors of higher pharmacy college or school GPA and scores on licensing examinations.15,23 Subgroup analyses were performed to further evaluate acceptance rates on the basis of applicants to the top 10 schools ranked by U.S. News & World Report and top 10 NIH-funded schools as ranked by AACP as well as private/public school designation. Compared with total acceptance rates (31%), admission rates for institutions ranked in the top 10 by U.S. News & World Report and the top 10 NIH-funded schools ranked by AACP were lower (25% and 22%, respectively). This finding was likely influenced by the competitive nature of the admissions processes for these schools, as they tend to receive a large number of applications comprised of highly competitive applicants (eg, those with a combination of higher-than-average quantitative GPAs and PCAT scores), as well as strong qualitative characteristics (eg, letters of reference, life experiences, prior pharmacy exposure, and research experience). The acceptance rates for private and public schools were similar (27%) but still below the acceptance rate for all applicants. Aside from gender, the other diversity variables (eg, URM, less parental education, less prepharmacy education) were associated with lower acceptance rates.
This study used data from PharmCAS, a centralized processing service that currently serves only 79% of colleges and schools of pharmacy accredited by the Accreditation Council for Pharmacy Education.24 Many of the historically black colleges and universities (eg, Hampton, Florida A&M, Texas Southern, and Xavier) and other pharmacy colleges and schools that train a large proportion of ethnic minorities (eg, Arnold & Marie Schwartz, Puerto Rico, Rutgers, and University of Texas at Austin) do not use PharmCAS for admissions.14, 25-28 Because this study focused on characterizing the PharmCAS applicant pool, students who applied to these schools were not captured unless they also applied through PharmCAS. Additionally, applicants were not required to respond to every demographic category within PharmCAS (eg, race/ethnicity) or could select “other” as a response to a category. This is a limitation of the dataset. Because nonresponses were excluded, a portion of the applicant pool was not considered in this analysis. The diversity variable with the highest nonresponse rate was prepharmacy education. Subsequent to this study, data requirements for PharmCAS application processing have changed; PharmCAS now requires more information from applicants.
Another limitation of this study is that it did not include the entire continuum of diversity variables. Because of the nature of the dataset, diversity variables that we were unable to study include but are not limited to socioeconomic status, sexual orientation, disability, primary language, and geographical location. These variables could have influenced both the diversity and admissions-related variables that were studied. Not all diversity variables may be independent from one another; future studies could focus on addressing the relationships between them.
One of the diversity variables that was assessed, parental education, was based on applicants’ self-reports. PharmCAS requires applicants to identify the highest level of education for each parent and also provides a free-text field for specifying a parent’s profession. The parental education section has 10 categories an applicant can select; responses to this category vary depending on applicant recall of parental education and perception of a category’s meaning (eg, professional degree vs earned doctoral degree). For example, a post-hoc analysis was performed comparing the free-text responses to the categories selected for parental education. Variability was noted in applicants’ selection of professional vs earned doctoral degree. Some applicants categorized the education associated with becoming a physician as a professional degree, while others categorized this profession as earned doctoral degree. Variability may have impacted the results; however, given the close categorical proximity within which the interpretation error might have occurred (eg, if data were dichotomized, professional and doctoral degree would both be considered a “higher level of education”), the extent of the effect on results is likely minimal.
Pharmacy colleges and schools are provided only national gender and ethnicity data related to the total number of applications submitted. Having access to other demographic data would be invaluable to colleges and schools of pharmacy. Such data could be used as a national benchmark for comparing institutional data and may guide recruitment; similar to the way in which the US Census is used as a national benchmark for states in measuring progress toward defined goals. Additionally, as colleges and schools create programs to further develop the pipeline of future applicants, these data can help colleges and schools identify and direct efforts to mitigate preparation gaps in the applicant pool.
With respect to current admissions processes, colleges and schools of pharmacy consider multiple factors in holistically evaluating applicants for admission. These factors have been described in the literature as cognitive (traditional) and noncognitive (nontraditional) variables.40 Cognitive variables typically focus on standardized test scores and GPA, whereas noncognitive variables include extracurricular activities, motivational/personality variables, ability to interpret information in changing contexts, ability to demonstrate creativity in problem-solving and critical thinking, and ability to adapt to a changing environment and handle/negotiate the system.36 Cognitive variables are more commonly studied in the literature, as these data are quantitative and readily accessible in secondary datasets.22,31,32 This publication bias may lead pharmacy college and school leadership to believe that these measures are the most effective. Colleges and schools should recognize that from a research standpoint, noncognitive variables are challenging to measure in secondary data analyses because of implicit subjectivity in data reporting and interpretation. Thus, subjectivity may act as a barrier to researchers attempting to study this area further. Although there have been studies designed to assess the predictive power of noncognitive variables, there are fewer of these studies published in the literature than those evaluating cognitive variables.
A tool called the noncognitive questionnaire, which has been modified for use in health professions, has proven useful in predicting student performance regardless of race/ethnicity and gender.30 This questionnaire tests the domains of positive self-concept/confidence, realistic self-appraisal, knowledge acquired in a field, understanding of racism, preference for long-range goals, strong support person, successful leadership experience, and community service. Webb and colleagues showed variability in the predictive quality of specific parameters by school, which suggests the importance of each school identifying noncognitive variables that best reflect the individual school’s culture and student body.41 Quantitative factors such as standardized test scores and GPA are convenient methods for screening a large applicant pool, but schools should consider qualitative factors, such as the variables discussed above, in admissions evaluations. Consideration of cognitive and noncognitive factors in the admissions process may allow for a balanced approach to evaluating all applicants.
Accreditation standards are directing schools to adopt an outcomes-based model in assessing student competency.33 This teaching model focuses on ensuring that students meet college- or school-specified competencies and strive to achieve the outcomes identified in the curriculum. In this approach, schools must consider admissions criteria that may predict whether an applicant will be a “good pharmacist” based on the school’s outcomes and/or competency rubrics. Given the increased diversity in the US population, ensuring that the incoming pharmacy workforce is trained to be culturally competent to serve this patient population is important. Achieving this objective requires admitting students with the capacity to display compassion and cultural sensitivity as well as those with a desire to serve all patient types and patient care settings — both mainstream and underserved. Additionally, from the standpoint of student pharmacist training, colleges and schools must strive to establish a diverse student body for the purpose of creating a heterogeneous learning environment. Meeting this objective will allow students to interact with a diverse range of students that is somewhat reflective of the general population and to develop knowledge, skills, and attitudes that will help them better serve diverse patient populations.
CONCLUSION
Female applicants, non-URMs, applicants with higher than a bachelor’s degree, and applicants whose parents attained a doctoral degree were associated with higher mean GPAs and PCAT scores and accepted to a higher proportion of schools to which they applied. Colleges and schools of pharmacy can use these data as a benchmark when evaluating admissions processes. Further research is warranted to evaluate potential interactions between diversity-related subgroups, temporal trends in diversity-related characteristics, and the effect of diversity-related characteristics on qualitative noncognitive variables.
ACKNOWLEDGMENTS
The authors dedicate this manuscript to the memory of our colleague: Olga Beyn, PharmD. We also thank Paul T. Nkansah, PhD, and Ronna Mallios, PhD, for their initial help with statistical analyses and Mitra Assemi, PharmD, and Michaela (Renee) Rosenberg, PharmD, for their assistance throughout the project. This study was funded by a Pathway Project Grant from the UCSF School of Pharmacy sponsored by the Vince Isnardi Opportunity Fund.
REFERENCES
- 1.Missing persons: minorities in the health professions. A report of the Sullivan Commission on diversity in the healthcare workforce. http://health-equity.pitt.edu/40/1/Sullivan_Final_Report_000.pdf. Accessed August 4, 2012.
- 2.Saha S, Guiton G, Wimmers PF, Wilkerson L. Student body racial and ethnic composition and diversity-related outcomes in US medical schools. JAMA. 2008;300(10):1135–1145. doi: 10.1001/jama.300.10.1135. [DOI] [PubMed] [Google Scholar]
- 3.Cooper-Patrick L, Gallo J, Gonzales J, et al. Race, gender, and partnership in the patient-physician relationship. JAMA. 1999;282(6):583–589. doi: 10.1001/jama.282.6.583. [DOI] [PubMed] [Google Scholar]
- 4.Nkansah NT, Youmans SL, Agness CF, Assemi M. Fostering and managing diversity in schools of pharmacy. Am J Pharm Educ. 2009;73(8):Article 152. doi: 10.5688/aj7308152. [DOI] [PMC free article] [PubMed] [Google Scholar]
- 5.Midwest Pharmacy Workforce Research Consortium. Final report of the 2009 national sample survey of the pharmacist workforce to determine contemporary demographic and practice characteristics. http://www.aacp.org/resources/research/pharmacymanpower/Documents/2009%20National%20Pharmacist%20Workforce%20Survey%20-%20FINAL%20REPORT.pdf Accessed August 4, 2012.
- 6.US Census. Overview of Race and Hispanic Origin: 2010. http://www.census.gov/prod/cen2010/briefs/c2010br-02.pdf. Accessed August 4, 2012.
- 7.Deyton P, Edwards JM, Eiland LS, et al. Report of the ASHP task force on pharmacy’s changing demographics. Am J Health-Syst Pharm. 2007;64(12):1311–1319. doi: 10.2146/sp070001. [DOI] [PubMed] [Google Scholar]
- 8.Taylor DA, Patton JM. AACP reports: the pharmacy student population: application received 2008-09, degrees conferred 2008-09, fall 2009 enrollments. Am J Pharm Educ. 2010;74(10):Article S2. doi: 10.5688/aj7410s2. [DOI] [PMC free article] [PubMed] [Google Scholar]
- 9.Bates T, Chapman S. Diversity in California’s Health Professions: Pharmacy. University of California, San Francisco: The Center for the Health Professions; 2008. [Google Scholar]
- 10.Bates T, Hailer L, Chapman S. Diversity in California’s Health Professions: Current Status and Emerging Trends. University of California, San Francisco: The Center for Health Professions; 2008. [Google Scholar]
- 11.Grumbach K, Coffman J, Gandara P, Munoz C, Rosenoff E, Sepulveda E. Strategies for Increasing the Diversity of the Health Professions. Woodland Hills, California: The California Endowment; 2003. [Google Scholar]
- 12.Chisholm-Burns M. Diversifying the team. Am J Pharm Educ. 2008;72(2):Article 44. doi: 10.5688/aj720244. [DOI] [PMC free article] [PubMed] [Google Scholar]
- 13.PharmCAS Application instructions for fall 2011 enrollment. PharmCAS Web site. http://www.pharmcas.org/docs/Instructions201011.pdf. Accessed February 29, August 4, 2012.
- 14.Hayes B. Increasing the representation of underrepresented minority groups in US colleges and schools of pharmacy. Am J Pharm Educ. 2008;72(1):Article 14. doi: 10.5688/aj720114. [DOI] [PMC free article] [PubMed] [Google Scholar]
- 15.Kuncel NR, Crede M, Thomas LL, Klieger DM, Seiler SN, Woo SE. A meta-analysis of the validity of the Pharmacy College Admission Test (PCAT) and grade predictors of pharmacy student performance. Am J Pharm Educ. 2005;69(3):Article 51. [Google Scholar]
- 16.NAEP: The Nation’s Report Card. 2008 long-term trend: race/ethnicity (mathematics) http://nationsreportcard.gov/ltt_2008/ltt0005.asp. Accessed August 4, 2012.
- 17.Aud S, Fox M, KewalRamani A. Status and trends in the education of racial and ethnic groups. US Department of Education, National Center for Education Statistics. 2010. http://nces.ed.gov/pubs2010/2010015.pdf. Accessed August 4, 2012.
- 18.Grbic D, Garrison G, Jolly P. Diversity of US medical school students by parental education. AAMC Analysis in Brief. 2010;9(10):1–2. [Google Scholar]
- 19.Halpern D, Aronson J, Reimer N, Simpkins S, Star J, Wentzel K. Encouraging girls in math and science. National Center for Education Research, Institute of Education Sciences, US Department of Education. 2007. http://ies.ed.gov/ncee/wwc/pdf/practiceguides/20072003.pdf. Accessed August 4, 2012.
- 20.Mau W, Lynn R. Gender differences on the Scholastic Aptitude Test, the American College Test and college grades. Educ Psyc. 2001;21(2):133–136. [Google Scholar]
- 21.Casey BW, Eric LD, Fantone JC. Analysis of factors that predict clinical performance in medical school. Adv Health Sci Educ. 2009;14(4):455–464. doi: 10.1007/s10459-007-9088-9. [DOI] [PubMed] [Google Scholar]
- 22.Kelley KA, Secnik K, Boye ME. An evaluation of the Pharmacy College Admissions Test as a tool for pharmacy college admissions committees. Am J Pharm Educ. 2001;65(3):225–230. [Google Scholar]
- 23.Pearson. PCAT reliability and validity. http://pcatweb.info/downloads/Faculty/PCATReliabilityandValidity.pdf. Accessed August 4, 2012.
- 24.PharmCAS - The Directory. PharmCAS Web site. http://www.pharmcas.org/collegesschools/directoryalphastate.htm. Accessed August 4, 2012.
- 25.College of Pharmacy and Pharmaceutical Sciences. Florida Agricultural and Mechanical University. FAMU College of Pharmacy Web site. http://pharmacy.famu.edu. Accessed August 4, 2012.
- 26.Texas Southern University: College of Pharmacy and Health Sciences. TSU College of Pharmacy Web site. http://archive.tsu.edu/pages/460.asp. Accessed August 4, 2012.
- 27.Hampton University: School of Pharmacy. Hampton University School of Pharmacy Web site. http://pharm.hamptonu.edu. Accessed August 4, 2012.
- 28.Xavier University of Louisiana. Xavier University College of Pharmacy Web site. http://www.xula.edu/cop/. Accessed August 4, 2012.
- 29.Sedlacek WE, Prieto DO. Predicting minority students’ success in medical school. Acad Med. 1990;65(3):161–166. doi: 10.1097/00001888-199003000-00007. [DOI] [PubMed] [Google Scholar]
- 30.Webb CT, Sedlacek W, Cohen D, et al. The impact of nonacademic variables on performance at two medical schools. J Natl Med Assoc. 1997;89(3):173–a80. [PMC free article] [PubMed] [Google Scholar]
- 31.Carroll CA, Garavalia LS. Gender and racial differences in select determinants of student success. Am J Pharm Educ. 2002;66(Winter):382–387. [Google Scholar]
- 32.Bandalos DL, Sedlacek WE. Predicting success of pharmacy students using traditional and nontraditional measures by race. Am J Pharm Educ. 1989;53:145–148. [Google Scholar]
- 33.Accreditation Council for Pharmacy Education. Accreditation standards and guidelines for the professional program in pharmacy leading to the doctor of pharmacy degree. January 15, 2006. https://www.acpe-accredit.org/pdf/ACPE_Revised_PharmD_Standards_Adopted_Jan152006.pdf. Accessed August 4, 2012.
- 34.US Census FactFinder Help. Race or ethnic groups. http://factfinder2.census.gov/faces/nav/jsf/pages/searchresults.xhtml?refresh=t. Accessed August 4, 2012.


