Abstract
Oligonucleotide therapeutics have emerged as a promising class of drugs to treat a wide range of diseases caused by genetic abnormalities. Replacement of the phosphodiester linkage with a phosphorothioate is one of the most successful modifications made to oligonucleotides to enhance their in vivo stability. The longer elimination phase of phosphorothioates and other modified oligonucleotides requires sensitive and selective methods to quantify the parent drug and their metabolites simultaneously. Liquid chromatography tandem mass spectrometry has excellent selectivity between the parent drug and its metabolites and a wide dynamic range. However, the biological sample extraction remains a formidable challenge in developing quantitative LC–MS methods for oligonucleotides. Protein precipitation, protein digestion, liquid–liquid extraction, reversed phase solid phase extraction (SPE), strong anion exchange SPE, and combinations of them have been reported to extract oligonucleotides from biological matrices. Unfortunately, these methods either have low recoveries or present potential problems for applications with chromatography due to the large amount of matrix substances in the resulting solutions. In this study, a weak anion exchange SPE method was optimized. The recovery ranged from 60% to 80% depending on the concentration. This is the first report of a one-step SPE method with recoveries greater than 60% across the method dynamic range. This sample extraction procedure was used in combination with ultrahigh-performance liquid chromatography–tandem mass spectrometry. The lower limit of quantitation was 10 ng/mL (1.3 nM), and the dynamic range was 10–1,000 ng/mL. The intra- and inter-day precision and accuracy were within 8.4% and 10.5%, respectively.
Key words: bioanalysis, LC–MS/MS, oligonucleotide, phosphorothioate
INTRODUCTION
In recent years, more and more diseases have been found to have a significant genetic component. Oligonucleotides (OGN) designed to silence certain disease-causing genes have emerged as a class of versatile therapeutic agents. They have been used to treat a wide range of diseases including cancer, AIDS, Alzheimer’s disease, and cardiovascular disorders (1,2). Natural oligonucleotides are susceptible to nuclease degradation and have poor biostability. Thus, various modifications have been introduced to enhance the stability of oligonucleotide therapeutics. The phosphorothioate (PS) backbone was one of the first modifications used for OGN and is still commonly used alone or in combination with other modifications. The phosphorothioate linkage increases nuclease resistance and significantly prolongs the plasma half-life of OGN and the elimination phase when compared to phosphodiester-linked OGN therapeutics (1). Therefore, a sensitive and selective bioanalytical method is necessary for quantitative analysis. The hybridization method is very sensitive and has remained the gold standard for quantifying oligonucleotide therapeutics for clinical studies. However, the selectivity is not as desirable as traditional liquid chromatography–mass spectrometry (LC–MS) methods (3,10).
One of the major shortcomings of LC–MS methods is the extensive sample cleanup procedures required to achieve the necessary reproducibility and recovery. Due to the extensive binding to proteins by OGNs, direct protein precipitation and reversed phase solid phase extraction were reported to have low recoveries (<10%) (3). Strong anion exchange (SAX) extraction has been reported to extract PS-OGNs from plasma and urine (4). Although the extraction procedure was fairly quick (5 min), the high salt concentration used in the method requires further cleanup steps to be applied in LC–MS methods, which may result in recovery loss. Dai et al. (5) employed a one-step ion-pair reversed phase solid phase extraction using triethylammonium bicarbonate as an ion-pairing agent. However, the recovery at lower concentrations was reported to be only 43% due to irreversible binding to the SPE cartridges. Proteinase K digestion combined with liquid–liquid extraction (LLE) was reported to have high recoveries (98%) (6,7). However, proteinase K digestion involves long incubation times (>10 h), which would affect the throughput in preclinical and clinical studies. In addition, we have observed both proteinase K digestion and phenol–chloroform LLE produced samples with complicated matrix backgrounds. These endogenous substances could cause interferences during LC separations and blockage of small particle ultra-high performance liquid chromatography (uHPLC) columns. Zhang et al. (3) reported a sample extraction procedure that combines phenol–chloroform LLE and ion-pair reversed phase SPE and resulted in relatively high recovery across the dynamic range (72–85%). Nevertheless, the multiple extraction and sample transfer steps in this method are arduous and time-consuming.
In our study, we used a 24mer phosphorothioate oligonucleotide as a model compound and developed a one-step solid phase extraction method. The sample extraction procedure resulted in equivalent recovery and similar lower limit of quantitation (LOQ) from rat plasma as the LLE-SPE method reported by Zhang et al. (3) and is much simpler. Because of the use of a lysis buffer which dissociates the OGN from plasma proteins before the SPE step, sample transfer steps were eliminated. The various conditions were optimized to improve the recovery, and specific issues related to this sample preparation method were investigated.
MATERIALS AND METHODS
Materials
The 24mer PS-ODN (5′-TCGTGCTTTTGTTGTTTTCGCGTT-3′) its 23mer 3′n-1 metabolite and internal standard (IS) pdT40 (PAGE purification, purity >90%) were purchased from Integrated DNA Technologies (Coralville, IA). Chemicals such as 1,1,1,3,3,3-hexafluoro-isopropanol (HFIP), di-isopropylethylamine (DIEA), tetrahydrofuran (THF), ammonium acetate, ammonium bicarbonate, and tris (2-carboxylethyl)phosphine (TCEP) were purchased from Sigma-Aldrich Inc. (St. Louis, MO). HPLC grade methanol and acetonitrile were obtained from Fisher Scientific (Pittsburgh, PA). Clarity OTX lysis buffer and SPE cartridges were obtained from Phenomenex Inc. (Torrance, CA).
Instrumentation and LC-MS Conditions
uHPLC–tandem mass spectrometry (MS/MS) analysis was performed on a Waters Acquity uHPLC system coupled with a Waters Synapt G2 qTOF mass spectrometer with electrospray (ESI) source (Milford, MA). Chromatographic separations were performed at a flow rate of 0.15 mL/min on a 1.7-μm Waters Acquity BEH C18 column (Milford, MA) 100 × 1.0-mm column. Mobile phase A consisted of 15.7 mM DIEA and 50 mM HFIP in water, and mobile phase B consisted of the same concentration of DIEA and HFIP in water/acetonitrile (50:50). A 20-μL injection of each sample was loaded onto the column and separated using the following gradient conditions [time (minutes), percent mobile phase B]: (0, 5) (1,5) (2, 29) (4, 29) (5, 40) (5.01, 5) (9, 5). The column temperature was maintained at 60°C. The column eluent from 0 to 1.5 min was diverted to waste. The weak and strong washes for the autosampler needle were 600 μL water and 200 μL 5% methanol, respectively. The system was operated in the negative-ion MS/MS mode with a 1-s scan time. The MS/MS transition optimized for the 23mer, 24mer, and internal standard were m/z 590 → 319 (0–4.5 min), 667 → 319 (0–4.5 min), and 604 → 319 (4.5–9 min), respectively, with targeted mass enhancement at m/z 319. The capillary voltage was set at 2.3 kV, the cone voltage was 20 V, the extraction cone voltage was 2 V, the trap collision energy was 20 eV, the transfer collision energy was 0 eV, the source temperature was 120°C, the desolvation temperature was 450°C, cone gas was 6 L/h, and desolvation gas was 700 L/h.
Preparation of Stock Solutions, Working Solutions, Calibration, and QC Samples
23mer and 24mer solutions were prepared in deionized water to give a final concentration of 1 mg/mL. IS stock solution concentration was 200 μg/mL. Work solutions of the 23mer and 24mer were prepared by spiking 2 μL of their stock solutions respectively into 196 μL of plasma. The calibration samples with concentrations of 10, 20, 50, 100, 200, 500, and 1,000 ng/mL and QC samples with concentrations of 10, 30, 150, and 750 ng/mL were prepared by spiking appropriate amount of work solution of 23mer and 24mer. One hundred microliters of these solutions was then spiked with 1 μL of IS work solution before extraction.
Sample Preparation
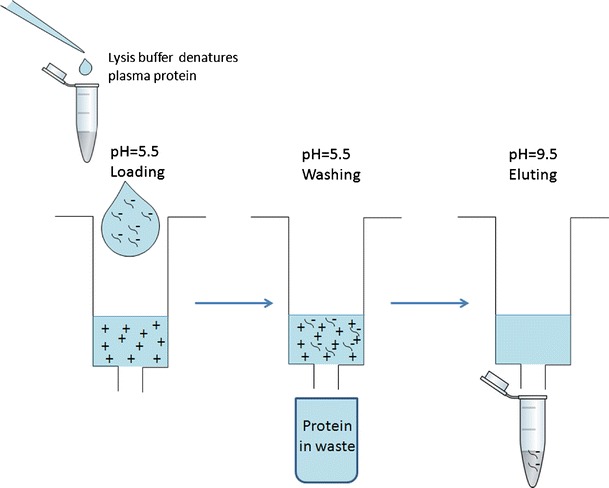
The equilibration buffer was made by dissolving 0.79 g ammonium acetate with 200 mL deionized water (50 mM NH4OAc) and adjusting the pH with acetic acid to 5.5. The washing buffer was made by mixing 100 mL of equilibration buffer with 100 mL acetonitrile. The elution buffer was made by dissolving 0.78 g ammonium bicarbonate and 0.028 g TCEP (100 mM NH4HCO3, 1 mM TCEP) in 50 mL of water, adjusting the pH with ammonium hydroxide to 9.5 and mixing with 40 mL of acetonitrile and 10 mL of THF. The SPE cartridges were conditioned using 1 mL of methanol and 1 mL equilibration buffer sequentially. Plasma samples were then mixed with 200 μL of Clarity OTX buffer and loaded onto the column. The cartridges were washed by 3 mL of washing buffer, and the analytes were eluted by 0.5 mL × 2 of elution buffer. The collected solutions were evaporated to near dryness under vacuum and reconstituted with 50 μL of deionized water. Twenty microliters of the reconstituted solution was injected into the uHPLC–MS/MS system for analysis. A schematic is shown to illustrate this process (Fig. 1).
Fig. 1.
Sample extraction procedure
Method Validation
Plasma calibration curves were constructed using peak area ratios of the 23mer and 24mer to the IS and applying a weighted (1/x2) linear regression. Precision (percent RSD) and accuracy (percent error) were calculated for the four QC samples (concentrations of 10, 30, 150, and 750 ng/mL). Five replicates of each QC point were analyzed each day to determine the intra-day accuracy and precision. This process was repeated three times over 3 days in order to determine the inter-day accuracy and precision. The absolute and relative recoveries and matrix effects were determined for spiked plasma samples (n = 5) at concentrations of 10, 30, 150, and 750 ng/mL. Absolute recovery was calculated as the peak area for 23mer and 24mer in the plasma sample spiked before extraction, divided by the peak area of a water solution of the same concentration. Relative recovery was calculated by dividing the peak area for a sample spiked with 23mer and 24mer before extraction by the peak area for an equal concentration sample in the same matrix spiked after extraction. Matrix effects were calculated by dividing relative recovery by absolute recovery (8). Stability of 23mer and 24mer during freeze–thaw (3 cycles), at room temperature (8 h), and in an autosampler (24 h) (n = 5) were also determined and reported.
Method Application
The validated analytical method was applied to an animal experiment by a single i.v. administration of 1.0 mg/kg 24mer to a male Sprague–Dawley rat weighing ∼160 g. 24mer in 0.9% sterile saline was given as an i.v. bolus dose at 1.0 mg/kg through the tail vein. The dose volume was 1.25 mL/kg. Blood (0.5 mL) was withdrawn through the neck catheter according to a schedule of 0 (predose), 5, 15, 30, 60, 120, and 180 min after dosing. The blood samples were centrifuged at 11,000×g for 5 min, and plasma were collected and kept frozen at −20°C until analysis.
RESULTS
Selecting the Optimum Mobile Phase Composition and Obtaining Precursor and Product Ion Mass Spectrum
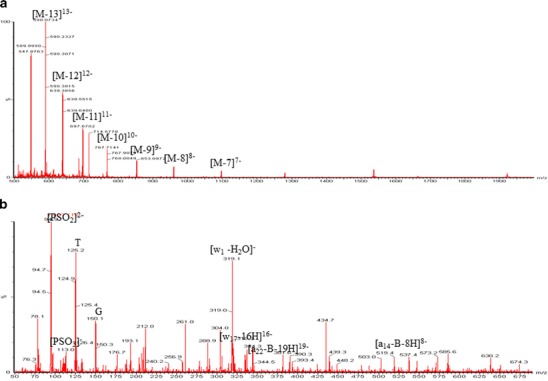
Different infusion solutions were evaluated for their ability to enhance the MS sensitivity of the 24mer. DIEA and acetonitrile displayed the highest signal enhancing capability (data not shown) and were chosen as the ion-pairing agent and organic solvent used for the mobile phase. Molecular ions were distributed between the 6 and 14 charge states with [M-13 H+]13- at m/z = 590 being the most abundant ion. The most abundant fragment ion of [M-13 H+]13- is w1-H2O at m/z = 319 (Fig. 2a, b) (11).
Fig. 2.
a Full scan and b Product ion mass spectra of 24mer
Optimization of SPE Conditions
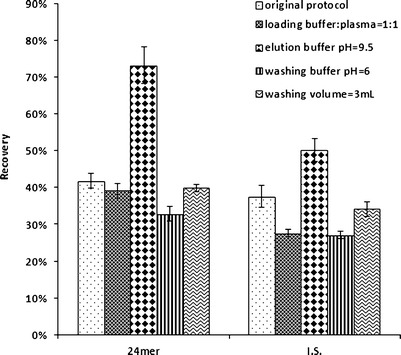
Various conditions were attempted to improve the recovery of the oligonucleotides including changing the plasma–buffer ratio, the equilibration buffer pH, the washing volume, and the elution buffer composition. The results are summarized in Fig. 3. Increasing the elution buffer pH from 8.8 to 9.5 increased the recovery of the 24mer from about 50% to over 70%. Higher elution buffer pH values were tested but did not result in any higher recovery (data not shown). Decreasing the wash buffer volume did not further improve the recovery
Fig. 3.
Recoveries obtained from different extraction conditions
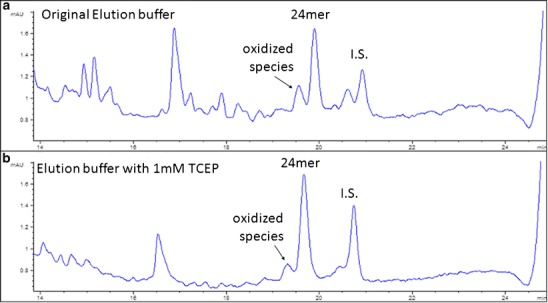
Evaporating the eluted solution under vacuum generated numerous additional peaks that eluted before the major peak in the chromatogram (Fig. 4a). By adding 10 mM of TCEP in the elution buffer, these smaller peaks were substantially reduced (Fig. 4b).
Fig. 4.
Chromatograms of samples eluted by buffers with and without TCEP
Choosing the Appropriate Concentration of Internal Standard
Different concentrations of internal standard were tested to achieve the best reproducibility and recovery for this one-step SPE procedure. When 10 μg/mL of internal standard was used, there was a significant amount of interference observed in the MS/MS channel for the 24mer at 10 ng/mL, while the 23mer was unaffected (Fig. 5c). When the concentration of the IS was decreased to 1 μg/mL, neither 24mer nor 23mer was detected at 10 ng/mL. This indicated that nonspecific binding to the SPE cartridge was not negligible, and the higher concentration of the IS protects the 23mer and 24mer from these losses. Increasing the elution buffer volume and organic solvent percentage did not retrieve any more analyte from the cartridge, which indicated that the binding was irreversible. Two micrograms per milliliter of internal standard was therefore chosen as the concentration used for validation. At this concentration level of IS, the recovery of the 23mer and 24mer was acceptable across the dynamic range, and no significant interference was observed (Fig. 5b).
Fig. 5.
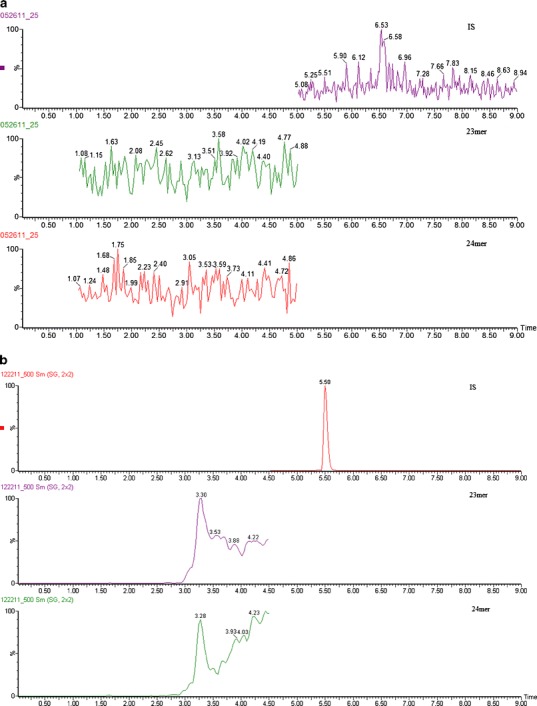
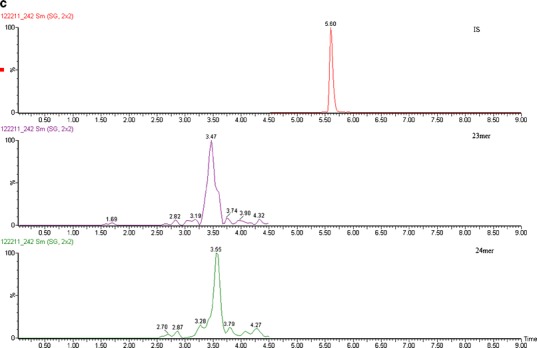
Representative chromatograms of a extracted blank, b 23mer and 24mer at LOQ (10 ng/mL) with IS at 10 μg/mL or c with IS at 2 μg/mL
Assay Validation
Assay Selectivity
Different lots of rat plasma (n > 6) were extracted and analyzed. No significant peaks were observed in either the analyte or the IS MS/MS channels for these matrix control samples, indicating that the method was highly selective. The 23mer, 24mer, and IS were all analyzed individually, and no cross-talk was observed between their MS/MS channels.
Precision, Accuracy, Recovery, Matrix Effects, and Stability
The dynamic range of the current method is 10–1,000 ng/mL. The calibration curves for 23mer and 24mer have R2 values of 0.9961 and 0.9973, respectively. The intra-day and inter-day precision and accuracy for both 23mer and 24mer are summarized in Table I. The autosampler, bench top, and freeze–thaw stability are summarized in Table II. The absolute recovery, relative recovery, and matrix effects of the method are summarized in Table III.
Table I.
Intra-day and Inter-day Precision and Accuracy of the Method
| Intra-day(n = 5) | Inter-day(n = 15, 3 days) | |||||||||||
|---|---|---|---|---|---|---|---|---|---|---|---|---|
| Conc. (ng/mL) | Obsd conc. (ng/mL) | RSD (%) | Error (%) | Obsd conc. (ng/mL) | RSD (%) | Error (%) | ||||||
| 23mer | 24mer | 23mer | 24mer | 23mer | 24mer | 23mer | 24mer | 23mer | 24mer | 23mer | 24mer | |
| 10 | 9.75 ± 0.52 | 9.88 ± 0.88 | 5.30 | 8.89 | 2.5 | 1.2 | 9.90 ± 0.88 | 10.1 ± 0.9 | 8.85 | 9.11 | 1.0 | 0.7 |
| 30 | 29.4 ± 2.5 | 29.8 ± 2.1 | 8.67 | 7.08 | 2.1 | 0.7 | 29.4 ± 2.6 | 30.3 ± 3.2 | 8.84 | 10.5 | 2.1 | 0.8 |
| 150 | 148 ± 12 | 139 ± 5 | 7.79 | 3.94 | 1.2 | 7.6 | 143 ± 9 | 148 ± 11 | 6.08 | 7.53 | 4.9 | 1.7 |
| 750 | 813 ± 41 | 774 ± 17 | 5.09 | 2.17 | 8.4 | 3.2 | 777 ± 40 | 797 ± 48 | 5.14 | 5.99 | 3.6 | 6.2 |
Table II.
Stability of 23mer and 24mer in Rat Plasma
| Freeze–thaw stability(−20°C) (3 cycles) | Room temp. stability(8 h) | Autosampler stability(24 h, 5°C) | ||||||||||
|---|---|---|---|---|---|---|---|---|---|---|---|---|
| Nominal conc. (ng/mL) | 30 | 150 | 30 | 150 | 30 | 150 | ||||||
| 23mer | 24mer | 23mer | 24mer | 23mer | 24mer | 23mer | 24mer | 23mer | 24mer | 23mer | 24mer | |
| Obsd conc. (ng/mL) | 31.5 ± 1.8 | 31.2 ± 2.7 | 161 ± 9 | 136 ± 6 | 31.3 ± 2.0 | 28.5 ± 2.1 | 156 ± 16 | 134 ± 4 | 32.6 ± 2.7 | 29.7 ± 1.2 | 153 ± 12 | 140 ± 15 |
| Accuracy (%) | 105 | 104 | 107 | 90.4 | 104.2 | 95.1 | 104 | 89.4 | 109 | 99.0 | 102.2 | 93.1 |
| RSD (%) | 5.81 | 8.76 | 5.82 | 4.09 | 6.31 | 7.28 | 10.2 | 2.82 | 8.18 | 4.04 | 7.63 | 10.4 |
Table III.
Absolute, Relative Recovery, and Matrix Effects of 23mer and 24mer
| Conc. (ng/mL) | Absolute recovery (%) | Relative recovery (%) | Matrix effect (%) | Type of effect | ||||
|---|---|---|---|---|---|---|---|---|
| 23mer | 24mer | 23mer | 24mer | 23mer | 24mer | 23mer | 24mer | |
| 10 | 78.4 ± 8.0 | 68.2 ± 6.9 | 83.2 ± 8.5 | 74.8 ± 7.5 | 94.3 | 91.2 | 5.7% suppression | 8.8% suppression |
| 30 | 68.7 ± 3.3 | 62.7 ± 6.3 | 74.0 ± 3.7 | 70.7 ± 7.1 | 92.8 | 88.6 | 7.2% suppression | 12.4% suppression |
| 150 | 64.2 ± 2.9 | 61.4 ± 7.4 | 71.4 ± 2.9 | 66.7 ± 8.0 | 89.9 | 92.0 | 10.1% suppression | 8.0% suppression |
| 750 | 64.1 ± 4.0 | 68.4 ± 1.9 | 71.4 ± 4.5 | 73.5 ± 1.8 | 89.7 | 92.9 | 10.3% suppression | 7.1% suppression |
| IS (2 μg/mL) | 56.8 ± 6.7 | 62.8 ± 7.2 | 90.5 | 9.5% suppression | ||||
Method Application
Because high plasma concentrations were expected, the rat plasma samples at 5, 15, 30, and 60 min were diluted 50 times with blank plasma and then processed based on the proposed extraction protocol. The plasma concentration versus time profile is presented in Fig. 6. Plasma samples were spiked with 23mer and 24mer at 50,000 ng/mL and diluted with blank rat plasma (1 in 50) prior to analysis (n = 5). All of the back-calculated values were within ±15% of the nominal concentrations. The precision was less than 9.0%, and accuracy was in the range of −3.8% to 7.3%, respectively, for 1 in 50 dilution.
Fig. 6.
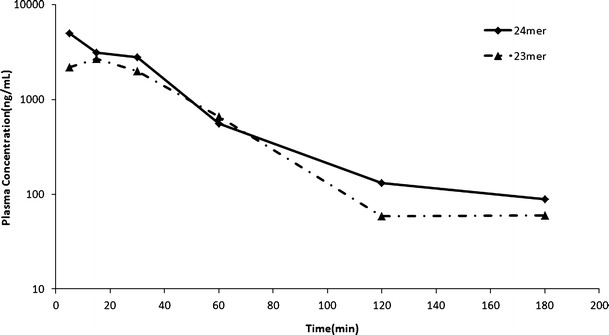
Plasma concentration curve from 0 to 180 min after i.v. bolus of 1 mg/kg 24mer
DISCUSSION
Optimization of SPE Conditions
Clarity OTX SPE cartridges extract oligonucleotides using a weak anion exchange (WAX) mechanism. The WAX particles were first charged at low pH (5.5) to enhance binding with the negatively charged phosphorothioate backbone. When the pH increased, the particles were neutralized and the oligonucleotides were released from the cartridge.
This SPE method eliminated the phenol–chloroform extraction step by disrupting the OGN–protein binding with the lysis buffer. The original extraction protocol provided by the manufacturer is as follows: plasma and lysis buffer are mixed in a 1:2 ratio then loaded to the column pre-equilibrated with equilibration buffer at pH = 5.5. The column is then washed by 3 mL of washing buffer at pH = 5.5 twice, and the OGN is eluted by elution buffer at pH = 8.8. Due to the high concentration of detergent in the lysis buffer, a lower buffer/plasma ratio was attempted to reduce possible interferences or ion suppression when using MS detection. However, the experimental results showed that a 1:1 ratio of plasma and lysis buffer gave a lower recovery than when a 1:2 ratio was used. This indicated that the detergent concentration was important in the extraction procedure because if the OGN was still bound to plasma proteins and the complex did not carry a net negative charge when loaded on the cartridge, it would pass through the cartridge during loading or elute during the washing steps.
WAX SPE avoided the use of high concentrations of MS-incompatible salts from SAX SPE. Instead of eluting the analyte with a high concentration of involatile salts, WAX elutes the analyte by changing the pH and hence the charge on the solid support. Therefore, the shift from acidic pH to basic pH was critical for successful recovery of the OGN when using WAX SPE. This could be achieved in three different ways: (a) applying higher vacuum after the washing step to drain the residual washing buffer and prevent neutralization of the elution buffer, (b) increasing the washing buffer pH to avoid severe neutralization of the elution buffer once it is loaded onto the column, or (c) increasing the elution buffer pH to ensure the neutralization of the solid support during the elution step. Without changing the pH of the washing or elution buffer, applying high vacuum after washing step only resulted in a 40% recovery of the analyte and IS. Increasing the equilibration and washing buffer pH to 6 decreased the recovery from 40% to 30% instead of increasing it, indicating that the high pH of the equilibrating and washing buffers resulted in a partial charge of the solid support particles and compromised the binding efficiency of the OGN to the solid support. Increasing the elution buffer from 8.8 to 9.5 significantly increased the recovery of both the analyte and the IS, so a pH of 9.5 for the elution buffer was used in the final protocol for extraction.
The phosphorothioate backbone can be oxidized to a phosphodiester during prolonged exposure to oxygen. Mcginley et al. (9) reported that under low vacuum and high temperatures, phosphorothioates underwent such severe oxidation that half of the analyte was oxidized species in the chromatogram. They proposed that using lyophilization instead of vacuum evaporation would eliminate the oxidation and improve the recovery. However, due to the high percentage of organic solvent in the elution buffer, at least 15 min of pre-evaporation is necessary to eliminate all of the organic solvent in the sample solution to better freeze the sample and prevent agitation during lyophilization. By adding 10 mM of TCEP, an MS-compatible antioxidant for sulfur-containing compounds, to the elution buffer the oxidation of the backbone phosphorothioate was effectively prevented during the 3 h of evaporation using vacuum centrifugation. Slight signal suppression ranging from 5% to 12% was observed in the matrix effect study from the addition of TCEP to the elution buffer, but this did not affect the method accuracy and precision.
The washing step of the SPE method is the most time-consuming step. More than 30 min was needed when no vacuum was applied which equaled more than half of the total extraction time. Decreasing the washing volume from 6 to 3 mL did not reduce the recovery, so in the optimized protocol only 3 mL of washing buffer was used.
Choosing the Appropriate Type and Concentration of Internal Standard
Nonspecific binding of OGNs to containers and SPE cartridges has been widely reported as one of the major challenges in bioanalysis of OGNs, especially at lower concentration levels (3). We addressed this issue by increasing the concentration of the internal standard, which is used as a “sacrificial OGN” to saturate all binding sites on the SPE cartridges and containers during the sample extraction procedure and thus enhance the recovery of the 23mer and 24mer at low concentrations. However, this could cause some issues with MS/MS selectivity.
As seen in Fig. 2a, at each charge state the parent ion of the oligonucleotide expands to an m/z window of almost 10 Da. Although the most abundant m/z value was selected and no interference would be observed when the concentration of each analyte was at similar concentrations, when the concentration of one OGN is overwhelmingly above the others, some of its resulting signal may be high enough to form interferences in the MS/MS channel of other analytes. This is problematic since the product ion m/z 319 could be produced by any oligonucleotide with a 3′ terminal T, making the MS/MS transition more susceptible to such interference. In this concern, overly high concentrations of internal standard should be avoided.
At higher concentrations of IS, “cross-talk” of some of the partial phosphorothioate or chain-shortened impurities of the IS that elute close to the analyte are no longer negligible. Figure 5a is the chromatograms of the LOQ sample when IS concentration was 10 μg/mL. The background noise near the retention time of the 24mer was so high that the peak of the 24mer was obscured when 10 μg/mL of IS was used. However, at 1 μg/mL, the concentration of the IS was not enough to saturate the binding sites on the SPE cartridges and the containers so the sensitivity of the 23mer and 24mer was compromised and the peak area of the IS became erratic (data not shown). Therefore, a concentration of 2 μg/mL was used for all studies to balance these two concerns.
By the same token, shorter polyT strands that elute after the analytes have higher propensity of “cross-talk” than longer polyT strands at high concentration. Compared to T40, T32 showed more interference in the analyte channel (data not shown). Therefore, T40 was chosen as the internal standard. As shown in Table III, the recovery of IS is slightly lower than 23mer and 24mer because the higher hydrophobicity of the longer polyT sequence causes it to have more extensive nonspecific binding than the analyte. This characteristic of T40 makes it a better “sacrificial oligonucleotide” as an internal standard.
Application of the Method
The T1/2 is 30 min, which is similar to what was reported before (29 min) (12). Longer sampling period could capture a more complete pharmacokinetic profile. However, the earlier report (12) has indicated that 4 ng/mL LOQ would still not be enough to capture the elimination phase. Therefore, only 180 min sampling period was employed considering the body weight and blood volume of the subject.
CONCLUSIONS
We optimized a one-step solid phase extraction procedure for oligonucleotides with high recovery (70–80%) and short processing time (4 h). We also developed a sensitive and fast (9 min) uHPLC–MS/MS assay for simultaneous quantitation of a test oligonucleotide and its metabolite from rat plasma (10–1,000 ng/mL). This is the first report of a single-step solid phase extraction method with higher than 60% recovery. Specific issues related to this type of sample extraction procedure were investigated. An animal experiment was conducted as a proof of concept study for the validated analytical method, and a similar pharmacokinetic parameter was obtained when comparing to an earlier report (12). However, lower LOQ still needs to be achieved to capture the complete terminal elimination phase of 24mer at clinically relevant doses. It is possible that other instruments such as a triple quadrupole may be capable of reaching these limits with the current method. Another possible method to obtain lower method limits of quantitation would be exploring capillary liquid chromatography. However, the low flow rates from capillary liquid chromatography will likely lead to a significant decrease in sample throughput. Great strides have been made in LC–MS/MS methods for the quantitation of oligonucleotides over the past several years; with these improvements, LC–MS/MS is currently approaching the performance required to determine full pharmacokinetic profiles with specificity that is unrivaled by other applicable methods.
Acknowledgments
The authors thank Scott Krepich of Phenomenex Inc. for his support and help of this work. The author would also like to thank Kelvin Clodfelter from Waters Corp. for the columns used in this study.
References
- 1.Paril SD, Rohdes DG, Burgess DJ. DNA-based therapeutics and DNA delivery systems: a comprehensive review. AAPS J. 2005;7:1. doi: 10.1208/aapsj070101. [DOI] [PMC free article] [PubMed] [Google Scholar]
- 2.Crooke ST. Vitravene—another piece in the mosaic. Antisense Nucleic Acid Drug Dev. 1998;8:vii. doi: 10.1089/oli.1.1998.8.vii. [DOI] [PubMed] [Google Scholar]
- 3.Zhang G, Lin J, Srinivasan K, Kavetskaia O, Duncan JN. Strategies for bioanalysis of an oligonucleotide class macromolecule from rat plasma using liquid chromatography–tandem mass spectrometry. Anal Chem. 2007;79:3416. doi: 10.1021/ac0618674. [DOI] [PubMed] [Google Scholar]
- 4.Bourque AJ, Cohen AS. Quantitative analysis of phosphorothioate oligonucleotides in biological fluids using direct injection fast anion-exchange chromatography and capillary gel electrophoresis. J Chromatogr B. 1994;662:343. doi: 10.1016/0378-4347(94)00207-X. [DOI] [PubMed] [Google Scholar]
- 5.Dai G, Wei X, Liu Z, Liu S, Marcucci G, Chan KK. Characterization and quantification of Bcl-2 antisense G3139 and metabolites in plasma and urine by ion-pair reversed phase HPLC coupled with electrospray ion-trap mass spectrometry. J Chromatogr B. 2005;825:201. doi: 10.1016/j.jchromb.2005.05.049. [DOI] [PubMed] [Google Scholar]
- 6.Chen SH, Qian M, Brennan JM, Gallo JM. Determination of antisense phosphorothioate oligonucleotides and catabolites in biological fluids and tissue extracts using anion-exchange high-performance liquid chromatography and capillary gel electrophoresis. J Chromatogr B. 1997;692:43–51. doi: 10.1016/S0378-4347(96)00499-9. [DOI] [PubMed] [Google Scholar]
- 7.Bellon L, Maloney L, Zinnen SP, Sandberg JA, Johnson KE. Quantitative determination of a chemically modified hammerhead ribozyme in blood plasma using 96-well solid-phase extraction coupled with high-performance liquid chromatography or capillary gel electrophoresis. Anal Biochem. 2000;238:228–240. doi: 10.1006/abio.2000.4638. [DOI] [PubMed] [Google Scholar]
- 8.Matuszewski BK, Constanzer ML, Chavez-Eng CM. Strategies for the Assessment of matrix effect in quantitative bioanalytical methods based on HPLC−MS/MS. Anal Chem. 2003;75(13):3019–3030. doi: 10.1021/ac020361s. [DOI] [PubMed] [Google Scholar]
- 9.Rudge J, Scott G, Hail M, and McGinley M. Preparation and LC/MS analysis of oligonucleotide therapeutics from biological matrices. Chromatography Today. 2011; March, 16.
- 10.McGinnis AC, Chen B, Bartlett MG. Chromatographic methods for the determination of therapeutic oligonucleotides. J Chromatogr B. 2012;883:76–94. doi: 10.1016/j.jchromb.2011.09.007. [DOI] [PubMed] [Google Scholar]
- 11.Ni J, Pomerantz SC, McCloskey JA. Rapid sequencing of modified oligonucleotides using tandem mass spectrometry with electrospray ionization. Nucleic Acids Symp Ser. 1996;35:113–114. [Google Scholar]
- 12.Deng P, Chen X, Zhang G, Zhong D. Bioanalysis of an oligonucleotide and its metabolites by liquid chromatography–tandem mass spectrometry. J Pharm Biomed Anal. 2010;52:571–579. doi: 10.1016/j.jpba.2010.01.040. [DOI] [PubMed] [Google Scholar]


