Abstract
We demonstrate for the first time the combination of human liver cytosol and microsomal enzyme sources into an electro-optical array to screen for reactive metabolites produced in multi-enzyme metabolic processes.
The generation of reactive metabolites represents a potential stumbling block in drug discovery and development.1 Reactive metabolites generated by metabolic bioactivation of drugs or environmental chemicals in the liver have the potential to damage proteins and DNA, which may result in toxicity.2 Thus, it is important to identify reactive metabolites of drug and environmental chemical candidates in order to predict toxicities in the early stages of development. Oxidations catalyzed by liver cytochrome P450s (cyt P450s) are a major source of reactive metabolites of lipophilic molecules. However, bioconjugation processes account for ~25% of marketed drug metabolism and can also contribute to bioactivation alone or sequentially with cyt P450s.2
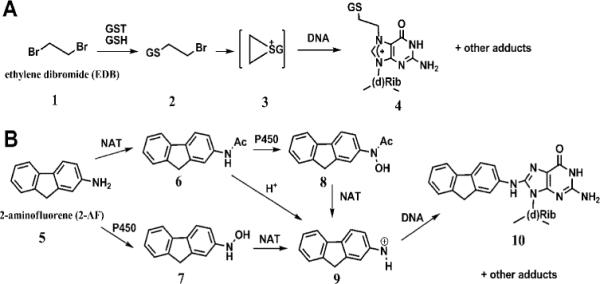
Different in vitro human liver enzyme sources, such as microsomes, supersomes, cytosol, S9 fraction, various cell lines and liver slices, have been employed as tools to investigate drug metabolism and inhibition, and to predict in vivo biotransformations.3,4 The liver cytosol contains three major enzymes: N-acetyl transferase (NAT), glutathione S-transferase (GST), and sulfotransferase (SULT). These enzymes are recognized for their roles in detoxification and clearance of foreign compounds. However, they can also lead to bioactivation and subsequent damage to cellular constituents causing toxicity.2,5 In concert with awareness of this fact, the liver cytosol has attracted increasing attention in drug biotransformation research.4 Examples include the conversion of the pesticide ethylene dibromide (EDB) to a half-mustard/episulfonium ion (Scheme 1A, 3) by glutathione transferases, and the activation of 2-aminofluorene (2-AF) by acetylation with or without hydroxylation to generate good leaving groups and form reactive nitrenium ions (Scheme 1B, 9).6,7 The reactive metabolites formed in both cases react with DNA and can cause genotoxicity.6,7
Scheme 1.

Major biotransformations of EDB and 2-AF leading to DNA adducts formation.6,7
We recently developed predictive in vitro arrays that screen reactive metabolite formation using a DNA damage end point.8 This technology employs thin film spots containing DNA and enzymes, either pure or as microsomes containing multiple or individual cyt P450s. Test compounds are first converted into potentially reactive metabolites that are trapped by DNA in the spots as nucleobase adducts. DNA damage in the array is detected by an electro-optical technique called electrochemiluminescence (ECL), using a ruthenium metallopolymer in the spot that provides more ECL light when the DNA is disordered by nucleobase adduct formation.8,9 After the enzyme/DNA reaction step, ECL from the array is measured in an open-top electrochemical cell in a dark box and detected by a CCD camera.8a Using microsomes as a convenient source of cyt P450s avoids tedious purification of multiple enzymes while providing valuable information on toxic metabolic pathways via cyt P450 oxidations,8c as well as glucuronyltransferase-mediated detoxification.10 In addition, we demonstrated a voltammetric sensor capable of screening compounds that form reactive metabolites using cyt P450 1A2 and NAT.11 Ultimately, toxicity screening arrays must be capable of screening reactive metabolites generated from a complete spectrum of metabolic reactions including oxidation and conjugation reactions.
Herein we combine for the first time human liver cytosol and microsomes as enzyme sources in electro-optical arrays to screen reactive metabolites produced via bioconjugation with or without oxidation. Array spots containing ECL ruthenium polymer ([Ru(bpy)2PVP10]2+; PVP = polyvinylpyridine, RuPVP), DNA, human liver cytosol and microsomes were assembled on 1 in2 pyrolytic graphite (PG) chip using established protocols.8a,c Amounts of cytosol, microsomes, DNA and RuPVP in the spots were estimated by a quartz crystal microbalance (QCM) (ESI†, Fig. S1, Table S1), which also confirmed reproducible film formation.
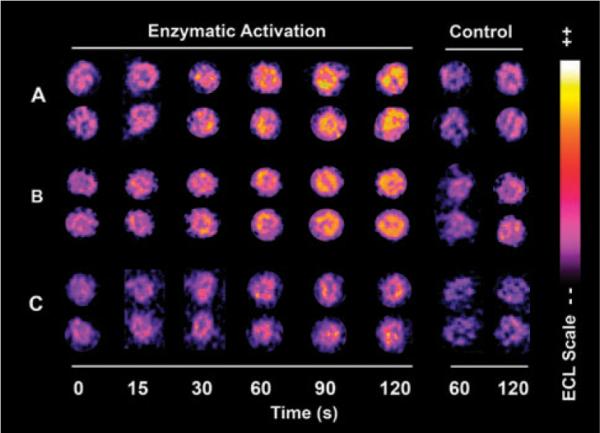
Ethylene dibromide was selected as an initial test compound because of its known toxic pathways mediated by glutathione S-transferase (Scheme 1).6 To prove that metabolic activation of ethylene dibromide is achieved by cytosolic GST in the array, spots with architectures (DNA/RuPVP)3/(DNA/RuPVP/cytosol)3 were exposed to 80 μM EDB and 0.5 mM glutathione (GSH) in 50 mM MES buffer (pH 6.0). Fig. 1A shows spots that increase in ECL intensity when exposed to EDB for various times. RuIIPVP polymer catalyst in the films is oxidized electrochemically at ~1.1 V in the detection step to RuIIIPVP, which subsequently oxidizes guanines on DNA to yield electronically excited RuII*PVP that emits visible ECL light at 610 nm.9 Reactive metabolites of EDB formed within the film (Scheme 1A) are trapped as DNA base adducts that partially disrupt the double helix and enhance the access of the catalytic RuIII-centers to guanines leading to increased oxidation rates and increased ECL light emission for damaged DNA, as documented extensively for other DNA damage reactions.8,9 No increase in light was observed on the array in the absence of the cofactor glutathione (GSH) in the enzyme reaction step (Fig. 1A, control). When array spots were preincubated with bilirubin, an inhibitor of GST,12 no increase in light was observed (ESI†, Fig. S2), indicating the necessity for metabolic activation of EDB for DNA damage.
Fig. 1.

Reconstructed ECL array data for (A) spots of RuPVP/DNA/human liver cytosol exposed to 80 μM EDB, 0.5 mM glutathione in 50 mM MES buffer (pH 6.0) for denoted times; (B) spots of RuPVP/DNA/human liver cytosol/human liver microsomes exposed to 100 μM 2-AF, 0.5 mM acetyl coenzyme A, 1.6 mM DTT, 0.5 mM EDTA and NADPH regenerating system in 50 mM MES buffer (pH 6.0); (C) spots of RuPVP/DNA/human liver cytosol exposed to the same enzymatic reaction solution as in (B) without the NADPH regenerating system. Control spots in each panel are exposed to the same concentration of substrates alone.
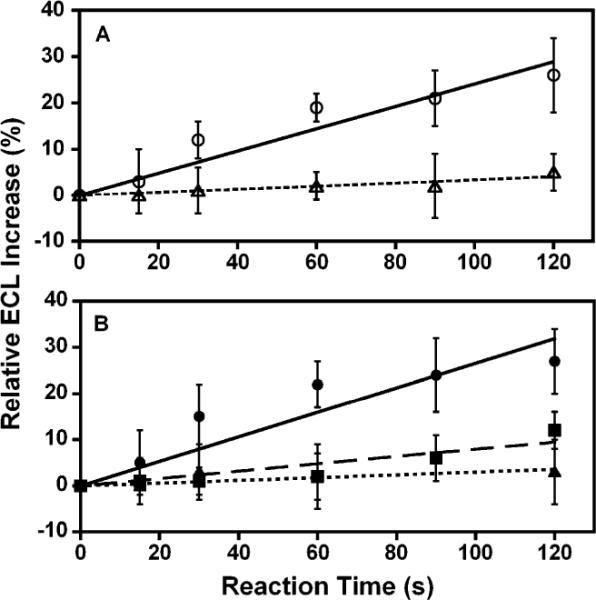
We previously showed that the slope of the relative ECL increase vs. reaction time correlates with the rate of nucleobase adduct formation measured directly by LC-MS/MS, as well as with rodent liver toxicity metrics.8,10 The relative ECL increase for the GST catalyzed EDB reaction was nearly 30% in 120 s compared to a negligible change in controls (Fig. 2A). The normalized turnover rate was 9 × 10⁴ (per min per mg cytosol) for GST catalyzed EDB reactions, obtained from the slope of ECL increase versus reaction time divided by the QCM-estimated amount of cytosol in the films.
Fig. 2.

Relative ECL increases for arrays utilizing data in Fig. 1 for (A) EDB reaction (◯) and control with EDB only (▵); (B) 2-AF reaction mediated by cytosolic NAT and microsomal enzymes (●), 2-AF reaction mediated by cytosolic NAT (∎), and control reaction with only 2-AF (▿). Error bars represent ±SD from 8–12 spots.
Next, 2-aminofluorene (2-AF) was tested as an example whose bioactivations involve both cyt P450 mediated oxidations and NAT conjugations (Scheme 1B).7 Arrays with spots containing cytosol, microsomes, and DNA (ESI†, Table S1) were used to provide enzymes for the oxidation and conjugation reactions. First, the enzyme reactions were done using 100 μM 2-AF together with 0.5 mM acetyl coenzyme A (AcCoA), 1.6 mM DTT, 0.5 mM EDTA and an NADPH regenerating system. An increase in ECL versus reaction time was observed, as illustrated in Fig. 1B. Negligible ECL increase was found in controls with 2-AF only (Fig. 1B, control). It is likely that microsomal cyt P450s mediating oxidation and cytosolic NAT mediating conjugation act synergistically in converting 2-AF into reactive nitrenium ion(s) (Scheme 1, 9) that bind covalently to DNA. This was further supported by inhibiting NAT activation using luteolin,13 which eliminated the ECL increase (ESI†, Fig. S2). This result supports the critical role of NAT mediated conjugations in causing significant DNA damage by 2-AF.
To investigate the role of NAT in activating 2-AF in the absence of cyt P450s, microsomes were omitted from the array spots. A smaller ECL increase was found, as illustrated in Fig. 1C. This suggests that much smaller amounts of DNA adducts were formed when only the cytosolic NAT mediated conjugation pathway was active, probably via 2-acetylaminofluorene (6) followed by reactive nitrenium ion (9) formation in the weakly acidic buffer.14
Fig. 2B shows a 6-fold larger slope of ECL increase versus reaction time when both cyt P450s and cytosolic NAT enzymes are present compared to spots with cytosolic NAT alone. This result is consistent with our previous result using pure NAT in a non-array voltammetric sensor (~20% relative current increase in 2 min),14 under slightly different reaction conditions. Overall, results are consistent with the synergistic roles of oxidations via cyt P450s and conjugations via NAT in bioactivation of 2-AF (Scheme 1B).
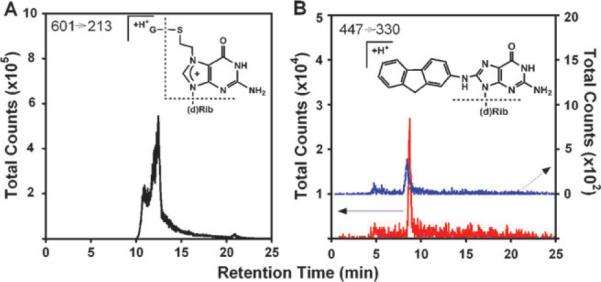
To confirm formation of DNA adducts in the spots and elucidate their structures, enzyme reactions were performed using 500 nm diameter silica nanoparticles coated with analogous enzyme/DNA films as in the arrays.15 After the enzyme reactions, enzymatic hydrolysis of DNA on the particles release adducted deoxynucleosides for LC-MS/MS analysis. For the EDB reaction, silica nanoparticles with PDDA/DNA/cytosol films were used to catalyze enzyme reactions. S[2-(N7-guanyl)ethyl]glutathione with a m/z 601 was identified as a major adduct with similar fragmentation pattern as previously proposed.16 Fig. 3A shows mass transition m/z 601 → 213 ([guanine + thioethyl + 2H]+) using tandem MS in multiple reaction monitoring (MRM) mode. For similar reactions with EDB without GSH, this mass transition was not detected, suggesting the necessity of GSH for DNA damage. These results confirm the formation of reactive metabolites of EDB trapped as DNA adduct(s) in the films, provided that GSH bioconjugation is active, consistent with results with the ECL arrays.
Fig. 3.

LC-MS chromatograms in multiple reaction monitoring (MRM) mode for detection of deoxyguanosine adducts with fragmentation chemistry shown in insets. (A) Formation of S[2-(N7-guanyl)ethyl]glutathione with mass transition m/z 601 → 213, after 5 min reaction using nanoparticles with DNA/human liver cytosol films and 80 μM EDB, 0.5 mM glutathione in 50 mM MES buffer (pH 6.0); (B) Formation of N-(deoxyguanosin-8-yl)-2-aminofluorene with mass transition m/z 447 → 330 after 5 min reactions using nanoparticles with DNA/human liver cytosol films (blue) and DNA/human liver cytosol/microsome films (red) with 100 μM 2-AF, 0.5 mM acetyl coenzyme A, 1.6 mM DTT, and 0.5 mM EDTA in 50 mM MES buffer (pH 6.0). An NADPH regenerating system was included for the latter reaction to activate cyt P450s.
Enzymatic activation of 2-AF was confirmed similarly using nanoparticles with DNA/cytosol/microsome and DNA/cytosol films. For reactions using DNA/cytosol films in the presence of AcCoA in MES buffer (pH 6.0), a peak with mass transition m/z 447 → 330 was obtained using MRM (Fig. 3B, blue). A reasonable assignment to the structure is N-(deoxyguanosin-8-yl)-2-aminofluorene (C8-AF-dGuo) losing a sugar moiety, because C-8 of deoxyguanosine is a preferred target of the nitrenium ion, although we cannot exclude the minor adduct 3-(deoxyguanosin-N2-yl)-2-aminofluorene (N2-AF-dGuo) with a similar fragmentation pattern.17 Reactions utilizing DNA/cytosol/microsome films, NADPH and AcCoA gave a much more intense MRM peak with the same mass transition (Fig. 3B, red). This suggests a significantly larger amount of DNA adduct(s) when both cyt P450s and cytosolic NAT are activated, consistent with the ECL array observations.
In summary, results above demonstrate for the first time that ECL arrays featuring DNA, cytosolic and microsomal enzymes can be used to monitor single and sequential in vitro metabolic bioactivation. Both conjugation and oxidation routes can be activated selectively or collectively by providing different co-factors of enzymes as desired. Structures and formation rates of specific metabolite adducts with DNA bases can be determined using similar films on nanoparticles with LC-MS/MS product analysis. Future efforts will focus on testing a wider range of chemicals with known and unknown metabolism and toxicity using these platforms, to provide more extensive validation.
Supplementary Material
Acknowledgments
The authors gratefully acknowledge financial support from the National Institute of Environmental Health Sciences (NIEHS), NIH (grant No. ES03154).
Footnotes
Electronic supplementary information (ESI) available: Experimental details, Fig. S1, S2, Table S1.
Notes and references
- 1.Doss GA, Baillie TA. Drug Metab. Rev. 2006;38:641–649. doi: 10.1080/03602530600959466. [DOI] [PubMed] [Google Scholar]
- 2.(a) Liebler DC, Guengerich FP. Nat. Rev. Drug Discovery. 2005;4:410–420. doi: 10.1038/nrd1720. [DOI] [PubMed] [Google Scholar]; (b) Guengerich FP. Chem. Res. Toxicol. 2008;21:70–83. doi: 10.1021/tx700079z. [DOI] [PubMed] [Google Scholar]; (c) Williams JA, Hyland R, Jones BC, Smith DA, Hurst S, Goosen TC, Peterkin V, Koup JR, Ball SE. Drug Metab. Dispos. 2004;32:1201–1208. doi: 10.1124/dmd.104.000794. [DOI] [PubMed] [Google Scholar]
- 3.Hariparsad N, Sane RS, Strom SC, Desai PB. Toxicol. in Vitro. 2006;20:135–153. doi: 10.1016/j.tiv.2005.06.049. [DOI] [PubMed] [Google Scholar]
- 4.Brandon EFA, Raap CD, Meijerman I, Beijnen JH, Schellens JHM. Toxicol. Appl. Pharmacol. 2003;189:233–246. doi: 10.1016/s0041-008x(03)00128-5. [DOI] [PubMed] [Google Scholar]
- 5.Miller JA, Surh Y-J. Adv. Pharmacol. (San Diego) 1994;27:1–16. doi: 10.1016/s1054-3589(08)61027-3. [DOI] [PubMed] [Google Scholar]
- 6.(a) Guengerich FP. J. Biochem. Mol. Biol. 2003;36:20–27. doi: 10.5483/bmbrep.2003.36.1.020. [DOI] [PubMed] [Google Scholar]; (b) Guengerich FP. Methods Enzymol. 2005;401:342–353. doi: 10.1016/S0076-6879(05)01021-9. [DOI] [PubMed] [Google Scholar]
- 7.Heflich RH, Neft RE. Mutat. Res. Rev. Genet. Toxicol. 1994;318:73–174. doi: 10.1016/0165-1110(94)90025-6. [DOI] [PubMed] [Google Scholar]
- 8.(a) Hvastkovs EG, So M, Krishnan S, Bajrami B, Tarun M, Jansson I, Schenkman JB, Rusling JF. Anal. Chem. 2007;79:1897–1906. doi: 10.1021/ac061975q. [DOI] [PMC free article] [PubMed] [Google Scholar]; (b) Krishnan S, Hvastkovs EG, Bajrami B, Jansson I, Schenkman JB, Rusling JF. Chem. Commun. 2007:1713–1715. doi: 10.1039/b703012f. [DOI] [PubMed] [Google Scholar]; (c) Krishnan S, Hvastkovs EG, Bajrami B, Choudhary D, Schenkman JB, Rusling JF. Anal. Chem. 2008;80:5279–5285. doi: 10.1021/ac800763r. [DOI] [PMC free article] [PubMed] [Google Scholar]; (d) Rusling JF, Hvastkovs EG, Hull DO, Schenkman JB. Chem. Commun. 2008:141–154. doi: 10.1039/b709121b. [DOI] [PMC free article] [PubMed] [Google Scholar]
- 9.Dennany L, Forster RJ, Rusling JF. J. Am. Chem. Soc. 2003;125:5213–5218. doi: 10.1021/ja0296529. [DOI] [PubMed] [Google Scholar]
- 10.Zhao L, Krishnan S, Zhang Y, Schenkman JB, Rusling JF. Chem. Res. Toxicol. 2009;22:341–347. doi: 10.1021/tx8004295. [DOI] [PMC free article] [PubMed] [Google Scholar]
- 11.So M, Schenkman JB, Rusling JF. Chem. Commun. 2008:4354–4356. doi: 10.1039/b805447a. [DOI] [PMC free article] [PubMed] [Google Scholar]
- 12.Ozawa N, Guengerich FP. Proc. Natl. Acad. Sci. U. S. A. 1983;80:5266–5270. doi: 10.1073/pnas.80.17.5266. [DOI] [PMC free article] [PubMed] [Google Scholar]
- 13.Li YC, Hung CF, Yeh FT, Lin JP, Chung JG. Food Chem. Toxicol. 2001;39:641–647. doi: 10.1016/s0278-6915(01)00009-6. [DOI] [PubMed] [Google Scholar]
- 14.So M, Hvastkovs EG, Bajrami B, Schenkman JB, Rusling JF. Anal. Chem. 2008;80:1192–1200. doi: 10.1021/ac701781y. [DOI] [PubMed] [Google Scholar]
- 15.Bajrami B, Hvastkovs EG, Jensen G, Schenkman JB, Rusling JF. Anal. Chem. 2008;80:922–932. doi: 10.1021/ac702025f. [DOI] [PubMed] [Google Scholar]
- 16.Huang H, Jemal A, David C, Barker SA, Swenson DH, Means JC. Anal. Biochem. 1998;265:139–150. doi: 10.1006/abio.1998.2891. [DOI] [PubMed] [Google Scholar]
- 17.(a) Basu AK, Essigmann JM. Chem. Res. Toxicol. 1988;1:1–18. doi: 10.1021/tx00001a001. [DOI] [PubMed] [Google Scholar]; (b) Wolf SM, Vouros P. Chem. Res. Toxicol. 1994;7:82–88. doi: 10.1021/tx00037a013. [DOI] [PubMed] [Google Scholar]
Associated Data
This section collects any data citations, data availability statements, or supplementary materials included in this article.


