Abstract
Segmentation of positron emission tomography (PET) images is an important objective because accurate measurement of signal from radio-tracer activity in a region of interest is critical for disease treatment and diagnosis. In this study, we present the use of a graph based method for providing robust, accurate, and reliable segmentation of functional volumes on PET images from standardized uptake values (SUVs). We validated the success of the segmentation method on different PET phantoms including ground truth CT simulation, and compared it to two well-known threshold based segmentation methods. Furthermore, we assessed intraand inter-observer variation in delineation accuracy as well as reproducibility of delineations using real clinical data. Experimental results indicate that the presented segmentation method is superior to the commonly used threshold based methods in terms of accuracy, robustness, repeatability, and computational efficiency.
I. INTRODUCTION
18F-FDG PET functional imaging is a widely used modality for diagnosis, stating, and assessing response to treatment. The visual and quantitative measurements of radio-tracer activity in a given ROI is a critical step for assessing the presence and severity of disease. Overlap or close juxtaposition of abnormal signal with surrounding normal structures and background radio-tracer activity can limit the accuracy of these measurements, therefore necessitating the development of improved segmentation methods. Accurate activity concentration recovery, shape, and volume determination are crucial for this diagnostic process. PET segmentation can be challenging in comparison to CT because of the lower resolution which can obscure the margins of organs and disease foci. Moreover, image processing and smoothing filters commonly utilized in PET images to decrease noise can further decrease resolution.
Most of the studies regarding delineation of PET images are based on manual segmentation, fixed threshold, adaptive threshold, iterative threshold based methods, or region-based methods such as fuzzy c-means (FCM), region growing, or watershed segmentation [1], [2], [3], [4], [5]. Although these advanced image segmentation algorithms for PET images have been proposed and shown to be useful upto certain point in clinics, the physical accuracy, robustness, and reproducibility of delineations by those methods have not been fully studied and discovered. In this study, we present an interactive (i.e., semi-automated) image segmentation approach for PET images based on random walks on graphs [6], [7]. The presented algorithm segments PET images from standardized update values efficiently in pseudo-3D, and it is robust not only to noise, but also to patient and scanner dependent textural variability, and has consistent reproducibility. Although the presented method can be easily extended into a fully automated algorithm, interactive use of the method offers users the flexibility of choosing the slice and region of interest so that only the selected slices and region of interests in those slices are segmented. In the following section, we describe the basic theory behind the random walk image segmentation and its use in segmenting PET images using SUVs. Then, we give the experimental results on segmentation of PET images.
II. Graph-based Methods for Image Segmentation
The “Graph-based” approaches [9], as alternatives to the boundary based methods, offer manual recognition, in which foreground and background or objects are specified through user-interactions. User-placed seed-points offer a good recognition accuracy especially in the 2D case. Graph-cut (GC) has been shown to be a very useful tool to locate object boundaries in images optimally. It provides a convenient way to encode simple local segmentation cues, and a set of powerful computational mechanisms to extract global segmentation from these simple local (pairwise) pixel similarity [9]. Using just a few simple grouping cues, called seed points and serve as segmentation hard constraints, one can produce globally optimal segmentations with respect to pre-defined optimization criterion. A major converging point behind this development is the use of graph based technique. In other words, GC represents space elements (spels for short) of an image as a graph with its nodes as spels and edges defining spel adjacency with cost values assigned to edges, and to partition the nodes in the graph into two disjoint subsets representing the object and background. This is done by trying to find the minimum cost/energy among all possible cut scenarios in the graph where GC optimizes discrete energies combining boundary regularization with regularization of regional properties of segments [9]. A common problem in GC segmentation is the “small cut” behaviours, happening in noisy images, or images including weak edges. This behaviour may produce unexpected segmentation results along the weak boundaries. Since PET images are poor in terms of resolution, and since weak boundaries often exist in PET images, we propose to use random walk (RW) segmentation method for segmentation of PET images to provide globally optimum delineations. By using RW segmentation method, we also often avoid “small cut” behaviours because weak object boundaries can be found by RW segmentation method as long as they are part of a consistent boundary. Due to the properties of providing globally optimum delineations and being less susceptible to the “small cut” behaviours, we propose to use RW segmentation method in delineating PET images.
A. Random Walks for Image Segmentation
Among graph-based image segmentation methods, RW segmentation has been shown very useful in interactive image delineation. It appeared in computer vision applications in [8], and then extended for image segmentation in [6], [7]. In this section, we describe the basic theory of RW image segmentation and its use in segmentation of PET images from SUVs.
Suppose G = (V,E) is a weighted undirected graph with vertices v ∈ V and edges e ∊ E⊆V×V. Let an edge spanning two vertices, vi and vj, be denoted eij, and weight of an edge is defined as wij. As common to graph-based approaches, edge weights are defined as a function, which maps a change in image intensity to edge weights. In particular, we use un-normalized Gaussian weighting function to define edge weights as: wij = exp(−(gi −gj)2), where gi represents the SUV of pixel i. Assuming that the image corresponds to a lattice where SUV of each pixel is mapped to edge weights in the lattice such that some of the nodes of the lattice are known (i.e., fixed, labelled), VM, by user input (i.e., seeds, marks), and some are not known, VU, such that VM⋂VU = V and VM⋃VU = ø. The segmentation problem in this case is basically to find the labels of unseeded (not fixed) nodes. A combinatorial formulation of this situation is nothing but the Dirichlet integral, as stated previously in [6],
| (1) |
where C is the diagonal matrix with the weights of each edge along the diagonal, and A and L(= AT CA) are incidence and Laplacian matrices indicating combinatorial gradients in some sense, and defined as follows:
| (2) |
Solution of the combinatorial Dirichlet problem may be determined by finding the critical points of the system. Differentiating D[x] with respect to x, and solving the system of linear equations with |VU| unknowns yield a set of labels for unseeded nodes if every connected component of the graph contains a seed (See [6] for non-singularity criteria). In other words, RW efficiently and quickly determines the highest probabilities for assigning labels to the pixels by measuring the “betweenness” through starting pixel of the RW (labeled pixel) to the un-labeled pixel, reached first by the random walker.
III. Evaluations and Results
We performed a retrospective study involving 20 patients with PET-CT scans. PET scans' resolution is limited to 4mm × 4mm × 4mm. The patients are having diffusive lung parenchymal disease abnormality patterns including ground glass opacities, consolidations, nodules, tree-in-bud patterns, lung tumours and non-specific lung lesions. PET scans are having more than 200 slices per patient with in-plane resolution varying from 144 × 144 to 150 × 150 pixels with 4mm pixel size. The average of the time for delineating one slice by the RW segmentation method was around 0.1 seconds. We qualitatively and quantitatively demonstrated the success of the presented delineation method both on phantom and real clinical data. We also compared the RW segmentation to the threshold based methods: fuzzy locally adaptive bayesian (FLAB) and FCM clustering [1]. Comparative results are explained in the following subsections.
Figure 1 shows the performance of the presented RW segmentation method qualitatively. Each row of Figure 1 shows steps of the RW segmentation on PET images for different anatomical location such that: (a) PET images for different anatomical locations, (b) seed locations (blue for object, red for background), (c) segmented object regions.
Fig. 1.
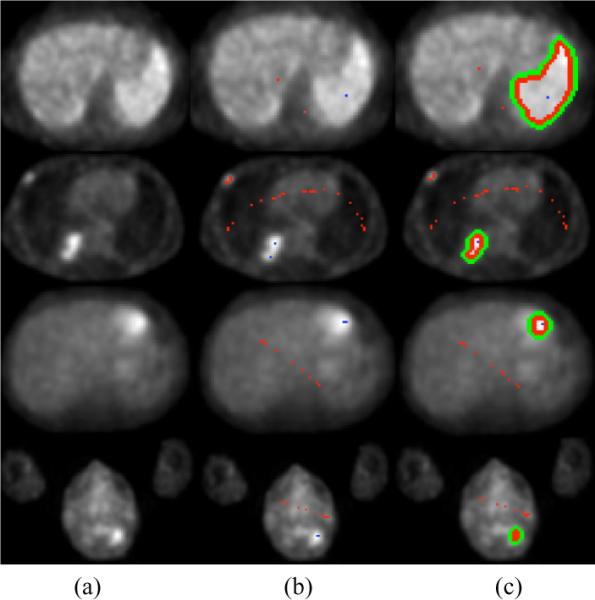
(a) different anatomical positions, (b) seeded object (blue) and background (red), (c) delineation results by RW segmentation method.
A. Reproducibility
Repeatability, or reproducibility in other words, is vital for many computational platform including segmentation of images. Particularly in seed based segmentation, it is of interest to know the effects of locating the user defined seeds on images for segmentation. Figure 2 shows an example segmentation of PET images examining the sensitivity of the RW segmentation to the user defined seeds. Not only the number of background and foreground seeds were changed in each case, but also their locations were changed while the consistency between separation of object and foreground was still kept. Apart from this qualitative evaluations, we also computed quantitative scores of the correlation between segmentation results via dice similarity scores. For each segmented volume and a reference segmentation , the dice similarity score is calculated as
| (3) |
Fig. 2.

Study of RW segmentation reproducibilty by locating seeds in different regions of object and background.
From each of 20 patients, we selected slices with high uptake regions (i.e., regions are either small or large depending on the abnormality: nodule, non-specific lesion, consolidation, TIB, and etc.), and for each slice we repeated the segmentation experiments 10 times by putting the seeds randomly over the image regions while keeping the seeds belonging to object and foreground. Resultant dice similarity scores for each segmentation experiment was compared after taking the mean over all pairs for the same patients, and eventually for all patients. The mean, standard deviation (std), max, and min scores are reported in Table I. Note that the presented segmentation method has a variation in segmented accuracy <1%. (See [11] for a full sensitivity analysis of segmentation to the number of seeds).
TABLE I.
Study of RW segmentation reproducibility via dice similarity scores.
| Mean | Std | Max | Min | |
|---|---|---|---|---|
| Dice Scores | 99.0077% | 0.6865% | 99.6346% | 97.2189% |
B. Validation by Ground Truth
We validated the presented segmentation algorithm via IEC image quality phantom [10], containing six different spherical lesions of 10, 13, 17, 22, 28 and 37 mm in diameter (See Figure 3). Two different signal to background ratios (i.e., 4:1 and 8:1), and two different voxel sizes (i.e., 2×2×2 and 4×4×4 mm3) were considered [1] as reconstruction parameters. Figure 3 (a–d) show phantoms with different reconstruction parameters, and Figure 3(e) shows ground truth, simulated from CT. Segmented objects from the phantoms are shown in the last row of Figure 3. Resultant segmentation variations due to the use of different reconstruction parameters (i.e., signal to background ratios and voxel size) are reported in Figure 4. As expected, low resolution and signal to background ratios degrade the delineation performance. Note also that the variations were computed with respect to the ground truth simulated CT scan.
Fig. 3.
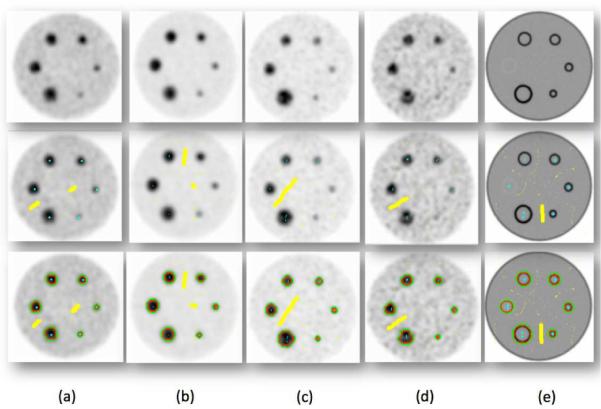
First row shows phantom images with following properties: (a) ratio 4:1, 64mm3, (b) ratio 8:1, 64mm3, (c)ratio 8:1, 8mm3, (d) ratio 4:1, 8mm3, (e) CT acquistion-ground truth. Second row shows user labeling, and the third row shows RW segmentation results.
Fig. 4.
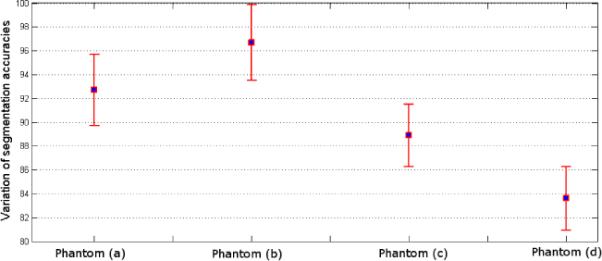
Segmentation accuracy of phantoms with respect to the ground truth (Figure 3.e) is shown. Dice scores are listed as 92.7±2.99%, 96.7±3.18%, 88.9±2.62%, and 83.6±2.68%, for phantoms given in Figure 3 (a), (b), (c), and (d), respectively.
C. Intra-and Inter-observer Variations
Manual segmentations were performed by three expert radiologists, and the experiments were repeated three times in order to assess intra- and inter observer variations over segmentation accuracies. The inter-observer and intra-observer variations are reported as 22.27±6.49% and 10.14±4.23%, respectively. Intra-observer variations (i.e., delineation by the same expert in different time points) on a sample scan is illustrated in Figure 5. Even though the window level is fixed for each segmentation experiment for the same anatomical location of the same patient, an average of 10% variation was inevitable on average.
Fig. 5.
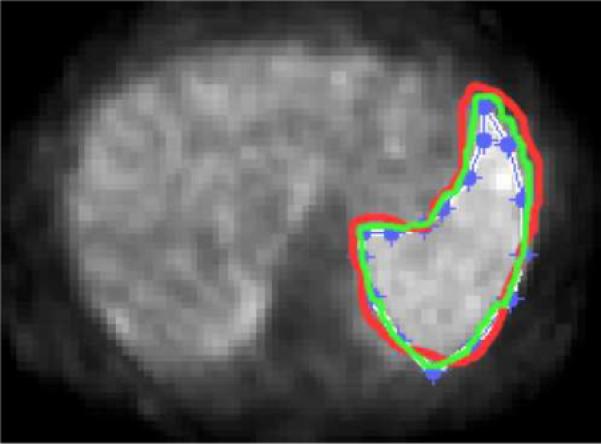
Intra-observer variation study: delineation of the high uptake region by the same expert in three different time points is reported.
D. Comparison to Threshold-based methods
Figure 6 shows the delineations of the same anatomical regions with FCM, FLAB, and RW segmentation algorithms. Note that in FCM and FLAB, there is a need to define region of interest to exclude false positives as a further refinement of the segmentation. On average, dice similarity index between RW and FCM and between RW and FLAB are reported as: and , respectively. In addition, segmentation results by the methods FLAB and FCM on the phantom sets show that (1) FLAB performs better than FCM as agreed with [1], (2) reproducibility of the segmentation algorithm is not comparable to the RW segmentation algorithm: FLAB has reproducibility variation of <4% whereas RW has variation of <1%, (3) accuracy of the delineations in RW segmentation are superior to FLAB and FCM: in the most favourable phantom in terms of image quality, FCM and FLAB have average delineation errors of 5–15% and 15–20%, respectively, for objects larger than >2cm, whereas RW algorithm has an average delineation error of 3.3–16.4% without any restriction in object size, and less than 10% if only objects >2cm are considered. As reported in [1], FCM and FLAB have problems in segmentation of small regions with high uptake, and often failed to segment lesions <2cm, and produce false positives. However, on the other hand, our presented framework successfully segment all regions with great accuracy, and manual removal of any false positive regions are avoided by the user defined object-foreground separation prior to beginning of delineation.
Fig. 6.
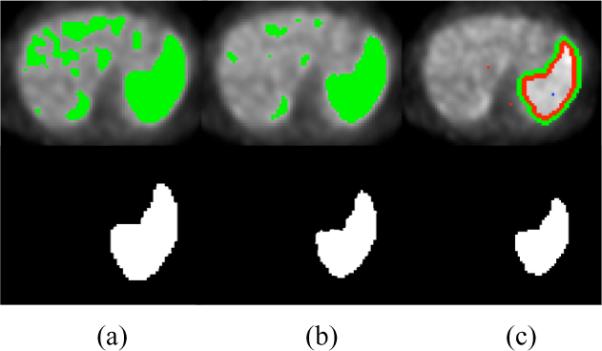
Delineation by FCM (a), FLAB (b), and RW (c).
IV. Conclusion
In this study, we presented a fast, robust, and accurate graph based segmentation method for PET images using SUVs. We qualitatively and quantitatively evaluated the RW image segmentation method both in phantom and real clinical data. We also compared the presented RW segmentation algorithm with two well-known and commonly used PET segmentation methods: FLAB and FCM. We conclude from the experimental results that interactive RW segmentation method is a useful tool for segmentation of PET images with high reproducibility.
Acknowledgments
This research is supported in part by the Imaging Sciences Training Program (ISTP), the Center for Infectious Disease Imaging Intramural program in the Radiology and Imaging Sciences Department of the NIH Clinical Center, the Intramural Program of the National Institutes of Allergy and Infectious Diseases, and the Intramural Research Program of the National Institutes of Bio-imaging and Bioengineering.
REFERENCES
- [1].Hatt M, et al. A Fuzzy Locally Adaptive Bayesian Segmentation Approach for Volume Determination in PET. IEEE TMI. 2009;28(6):881–893. doi: 10.1109/TMI.2008.2012036. [DOI] [PMC free article] [PubMed] [Google Scholar]
- [2].Montgomery, et al. Fully automated segmentation of oncological PET volumes using a combined multiscale and statistical model. Med.Phys. 2007;34(2):722–736. doi: 10.1118/1.2432404. [DOI] [PubMed] [Google Scholar]
- [3].Erdi YE, et al. Segmentation of lung lesion volume by adaptive positron emission tomography image thresholding. Cancer. 1997;80(12 Suppl):2505–2509. doi: 10.1002/(sici)1097-0142(19971215)80:12+<2505::aid-cncr24>3.3.co;2-b. [DOI] [PubMed] [Google Scholar]
- [4].Day E, et al. A region growing method for tumor volume segmentation on PET images for rectal and anal cancer patients. Med Phys. 2009;36(10):4349–4358. doi: 10.1118/1.3213099. [DOI] [PubMed] [Google Scholar]
- [5].Jentzen W, et al. Segmentation of PET Volumes by Iterative Image Thresholding. J Nucl Med. 2007;48:108–114. [PubMed] [Google Scholar]
- [6].Grady L. Random Walks for Image Segmentation. IEEE TPAMI. 2006;28(11):1768–1783. doi: 10.1109/TPAMI.2006.233. [DOI] [PubMed] [Google Scholar]
- [7].Andrews S, et al. Fast Random Walker with Priors Using Pre-computation for Interactive Medical Image Segmentation. MICCAI. 2010;3:9–16. doi: 10.1007/978-3-642-15711-0_2. [DOI] [PubMed] [Google Scholar]
- [8].Wechsler H. A random walk procedure for texture discrimination. IEEE TPAMI. 1979;3:272–280. doi: 10.1109/tpami.1979.4766923. [DOI] [PubMed] [Google Scholar]
- [9].Boykov Y, et al. Fast Approximate Energy Minimization via Graph Cuts. IEEE TPAMI. 2001;23(11):1222–1239. [Google Scholar]
- [10].Jordan K. IEC emission phantom Appendix Performance evaluation of positron emission tomographs. Medical and Public Health Research Programme of the European Community. 1990 [Google Scholar]
- [11].Sinop AK, Grady L. A Seeded Image Segmentation Framework Unifying Graph Cuts and Random Walker Which Yields A New Algorithm. Proc. of ICCV. 2007:1–8. [Google Scholar]


