

Background: Although powerful, single subunit counting is time-consuming, prone to user bias, and largely restricted to Xenopus expression.
Results: PIF is an automated analysis program that identifies subunit stoichiometry of any fluorescently tagged membrane protein from TIRF recordings.
Conclusion: PIF is accurate to more than 90% even in noisy data typical for mammalian expression system.
Significance: The PIF approach is generalizable to any membrane protein and TIRF microscope.
Keywords: Cys-loop Receptors, Fluorescence, Glutamate Receptors, Membrane Proteins, Single Molecule Biophysics, Step Detection, Superfolder GFP
Abstract
Elucidating subunit stoichiometry of neurotransmitter receptors is preferably carried out in a mammalian expression system where the rules of native protein assembly are strictly obeyed. Although successful in Xenopus oocytes, single subunit counting, manually counting photobleaching steps of GFP-tagged subunits, has been hindered in mammalian cells by high background fluorescence, poor control of expression, and low GFP maturation efficiency. Here, we present a fully automated single-molecule fluorescence counting method that separates tagged proteins on the plasma membrane from background fluorescence and contaminant proteins in the cytosol or the endoplasmic reticulum and determines the protein stoichiometry. Lower GFP maturation rates observed in cells cultured at 37 °C were partly offset using a monomeric version of superfolder GFP. We were able to correctly identify the stoichiometry of GluK2 and α1 glycine receptors. Our approach permits the elucidation of stoichiometry for a wide variety of plasma membrane proteins in mammalian cells with any commercially available TIRF microscope.
Introduction
The vast majority of membrane-bound proteins are expressed as oligomeric complexes in either homo- or heteromeric forms. Given this complexity, a number of biochemical and imaging techniques have been employed to elucidate subunit number and stoichiometry. As a first approximation, stoichiometry is often assessed by bulk biochemical methods, such as blue native PAGE (1). However, for a quantitative estimate, more recent approaches have turned to spectroscopic techniques such as fluorescence energy transfer (2) or protein x-ray crystallography (3, 4). Although helpful, methods that infer subunit stoichiometry from ensemble measurements ultimately assume that copy number is invariant among protein complexes. To take this issue into account, stoichiometry can be determined by studying protein complexes at the single molecule level either with atomic force microscopy (5) or fluorescence spectroscopy (6–11). In particular, the single subunit counting technique has proven to be a powerful tool (7, 11–18). For this technique, each subunit is first tagged with a fluorescent marker and then viewed by total internal reflection fluorescence (TIRF)6 microscopy that limits background noise in favor of signals coming from the plasma membrane (19). By minimizing surface expression levels, fluorescence emitted by individual protein complexes can be resolved. For each complex, the number of photobleaching steps can then be counted and, by association, the subunit stoichiometry determined (9, 10). This strategy is particularly appealing when expressing the protein of interest in the Xenopus laevis oocyte because it permits the use of GFP-tagged subunits as well as providing measurements with a high signal-to-noise ratio (7).
Despite its value, an important caveat of this approach is that the oocyte's biochemical machinery does not always assemble mammalian proteins faithfully. For example, the stoichiometry of human neuronal nicotinic acetylcholine receptors was found to be different between Xenopus oocytes and mammalian cells (20, 21). An added complication is that proteins nascent to the oocyte can co-assemble with exogenous proteins, as shown for nicotinic acetylcholine receptors (22) and NMDA-type ionotropic glutamate receptors (23). This situation is unlikely to be limited to a few exceptions because the Xenopus oocyte expresses a plethora of ion channels and transporters that are orthologs of mammalian proteins (24–26). Although the ideal solution would be to perform subunit counting in mammalian cells, this approach has its own challenges. First, background noise is greater in mammalian cells making it more difficult to discern the desired signal emitted from transfected cells. Second, surface protein density is more difficult to control in mammalian cells compared with Xenopus oocytes leading to heterogeneous expression patterns and to occasional co-localization of proteins. This means that despite the time-consuming nature of the analysis, practically all proteins expressed on the cell surface have to be analyzed to prevent biasing the outcome to a certain subpopulation. Third and finally, post-translational formation of the GFP chromophore is less efficient at the higher temperatures needed for mammalian cell cultures (i.e. 37 °C) (27, 28) placing limits on the accuracy of the counting method.
To respond to these challenges, we developed the necessary tools to make single subunit counting experiments in mammalian cells possible. Concerns with low chromophore formation were addressed by constructing a monomeric version of GFP (29) based on superfolder GFP (30) (msfGFP; see “Experimental Procedures”). To enable unbiased analysis of all proteins expressed on the cell membrane, we have developed a fully automated counting program that is capable of resolving steps typical of noisy in situ photobleaching experiments. It does so by separating relevant signals from contaminants, extracting the bleaching traces also from high background levels, and classifying these according to number of bleaching steps. The counting program has been named PIF to reflect the “Progressive Idealization and Filtering” functions of step detection and to recall the French expression avoir du pif, meaning “to have intuition” or literally “to have a good nose for something.” Using this approach, we have successfully determined the tetrameric and pentameric stoichiometry of GluK2 kainate and α1-glycine neurotransmitter receptors, respectively. Given this, we propose that PIF can be viewed as a universal tool for the automated analysis of subunit counting data of membrane-bound proteins expressed in mammalian cells.
EXPERIMENTAL PROCEDURES
Cell Culture and Transfection
HEK293T cells were plated on poly-d-lysine-coated 35-mm number 1 glass bottom dishes (MatTek Corp.) at a density of 2.5 × 10⁴ cells/ml in DMEM (Invitrogen) supplemented with fetal bovine serum (2%; Invitrogen). Cells were maintained in a humidified incubator at 37 °C containing 5% CO2. After 25–30 h, cells were transfected by the calcium phosphate method. Precipitate was allowed to form for 4 h before cells were washed twice with PBS and placed back into fresh DMEM. Cells were allowed to recover between 16 and 22 h post-transfection before being fixed in EM-grade 4% formaldehyde (Ladd Research) in PBS for 24–36 h at 4 °C.
Plasmid Construction
msfGFP contains a lysine residue at amino acid position 206 (V206K), known to substantially reduce fluorophore dimerization (29). The monomeric form of the superfolder GFP (msfGFP) was inserted into the coding sequence of the rat ionotropic kainate receptor GluK2 (NM_019309; pRK5-msfGFP-GluK2) and the human glycine receptor GlyRα1 (NM_000171; pRK5-msfGFP-GlyRα1) utilizing a large insert mutagenesis protocol (31). For both constructs, msfGFP was inserted N-terminally between the first and second or third and fourth amino acids of the mature GluK2 or GlyRα1 proteins, respectively. The fusions were generated by large insert site-directed mutagenesis. Briefly, primers were designed to incorporate a 20–23-nucleotide overhang into both the 5′ and 3′ ends of the msfGFP sequence. These overhangs are complementary to regions directly before and after the desired point of msfGFP insertion in expression plasmids containing either the GluK2 or GlyRα1 sequence. Primers are used to generate a megaprimer by PCR, which, after purification, is in turn utilized as a primer for large insert site-directed mutagenesis of the target sequence. All constructs were verified by sequencing.
Imaging
Fluorescence was measured using an inverted microscope (Axiovert 200, Zeiss, Jena, Germany). Excitation was achieved in TIRF configuration using a 60-milliwatt 488-nm laser (PhoXx, Omicron-Laserage, Germany). TIRF allows a thin excitation height of about 200 nm above the coverslip, thus eliminating a huge proportion of the background emerging from different cell compartments. Excitation light (∼10.5 milliwatts) was defocused to a diameter of ∼35 mm and was partially cut to a diameter of ∼7 mm using an iris, thus allowing a very uniform excitation intensity over the region observed. The total excitation intensity at the exit of the objective was about 550 microwatts. Emission was collected with a 63× NA 1.49 objective (Olympus, Richmond Hill, Ontario, Canada) and filtered by a high efficiency 525/50 nm emission filter in combination with a Z488 dichroic mirror (Chroma Technologies, Rockingham, VT). Images were recorded with a backlit EMCCD camera (iXon+ 860BV, Andor Technology, South Windsor, CT) at a sampling rate of 20 Hz.
Generating Simulated Data
Data featuring variable photobleaching, variations in step size, and blinking were simulated using a hidden Markov model (supplemental Fig. 1A). For simplicity, blinking events following single transition kinetics were considered. The mean dwell time τ in each state was calculated by the inverse of the sum of rates leaving the state. The duration t in which a state will be visited was calculated using a generated random number between 0 and 1, exclusively, to which an exponential decay function with characteristic time τ was associated. The result was then sampled at a frequency of 20 Hz, except for the simulations with fast blinking events (α ≥50), which were first sampled at 200 Hz before being re-sampled at 20 Hz. After this period in a given state, the next state was randomly selected based on the rate constants, acting as weights. This process was repeated until a duration of 100 s was reached. Poisson noise was finally added to the idealized trace.
Definition of Fluorescent Spots
The fluorescence intensity of each spot had a contributing region of 3 × 3 pixels defined by the point spread function of the imaging system. The signal δF was obtained by fitting the initial total fluorescence intensity F of each spot to a two-dimensional Gaussian profile and subtracting the estimated base line from the total fluorescence. A spot was detected if the signal to total fluorescence ratio δF/F overcame a pre-defined cutoff. In addition, an “overlap limit” ensured that individual spots do not influence each other's fluorescence intensity. The limit was defined as the distance where the Gaussian profile had reached 20% of its maximum and had to be free of neighboring spots.
Trace Filtering
Background fluorescence was removed by convoluting a Laplacian of Gaussian (LoG) kernel with the matrix of each selected spot (Fig. 1B). The filtering step effectively applied a bandpass filter similar to a deconvolution algorithm applied to confocal images to increase resolution and remove blurring (32). The LoG kernel had a standard deviation corresponding to the mean value obtained from the Gaussian fit over a set of spots. This filter was especially useful in low SNR systems because it efficiently removed high background fluorescence.
FIGURE 1.

PIF automated analysis. A, spots of interest are automatically selected from a user-defined region that encloses the cell (region of interest (ROI)). The fluorescence intensities of three spots are shown as examples. B, individual spots are processed through a background removal LoG-type kernel with a standard deviation set to 0.76 pixels. The resulting trace is filtered with the so-called C-K algorithm using a fixed time window of three frames (150 ms). C, PIF next applies its step detection algorithm to build an idealization of these traces, from which the steps are counted. D, ultimately, a quality control based on five criteria determines whether the final result should be included or not in the counting analysis.
Individual traces were further filtered with the Chung-Kennedy (C-K) filter (33). This nonlinear filter has been designed to reveal transients dominated by noise and has been shown to be an efficient aid for step detection (33, 34). Briefly, each of the points comprising a trace was filtered by a weighted average with the neighboring points directly preceding and following within a fixed time window. Weighting was evaluated for each point and was based on the variance of the trace before and after that point. The C-K filter improved the SNR by a factor of ∼3.0 ± 0.5 and did not filter out any bleaching steps. Interestingly, for SNR more than ∼2, the filter reduces the overall accuracy of step detection (see below) by up to 7%. A C-K filter should therefore only be used if traces display an SNR below ∼2. According to our estimations, C-K filtering should be applied for experimental traces improving their filtered SNR to values typically around 4–5 (supplemental Fig. 1B).
Step Detection
The program's step detection algorithm identified segments of constant intensity. This was an iterative process where initially short segments were averaged, and averaged data were exposed to another iteration of the same algorithm. This gradual increase in segment duration ensured that steps were readily distinguished. The main task of the step detection algorithm was to separate bleaching steps from noise or blinking events. This required information on noise and step amplitudes, both of which were initially unknown. Because a direct determination of the noise level was prevented by the stepwise decrease of the base line during bleaching events, the noise was estimated by evaluating variations of the fluorescence fluctuations (NFF). Briefly, NFF was obtained by calculating the standard deviation of the intensity differences between adjacent frames (for details see supplemental material). This value serves as the basis for the calculation of the SNR of the trace. Because the step amplitudes (the signal) were initially unknown, the algorithm assumes a very small SNR (∼0.25–1) for the first step detection iteration. Starting from the first frame, it continuously calculated a “floating” base line as the average of the intensity data. If the intensity fell below a limit, σ = (SNR·NFF)/ϕ from the calculated average, a step was detected and the algorithm assumed a new base line. The “sensitivity” ϕ, used to determine the threshold, is an empirical calibration factor dependent on the SNR of the current trace (supplemental Fig. 1C). For subsequent iterations, the SNR was calculated using the step amplitudes resulting from the previous iteration.
In the first iteration of a trace, many more steps will be detected than actually present. However, the “idealized” trace obtained in each run will undergo subsequent iterations with a lower sensitivity ϕ, calculated each round from the newly obtained idealized trace, so that noise and arbitrary fluctuations are progressively eliminated until only true bleaching steps remain (supplemental Fig. 2). This process stops if no further reduction of steps was observed in successive iterations of the algorithm. A more detailed description of the algorithm can be found in the supplemental material.
Three-step properties were evaluated in the detection algorithm to reduce false detections caused by artifacts created occasionally when working in mammalian cells. These properties are the minimal time permitted between steps, the maximal step amplitude variation, and the minimal step amplitude (supplemental Fig. 3, A–D). Notably, the minimal time between steps must last at least two frames because each individual photobleaching event was likely to occur during any given exposure interval. The new fluorescence intensity was therefore only registered in the second frame, whereas the first would assume an intermediate value. The variation of the step amplitudes was limited to exclude false steps, whose amplitudes were small in comparison with those of msfGFP bleaching steps within the same trace. The msfGFP bleaching steps displayed similar amplitudes among each other. This criterion proved most important and ruled out most of the detection artifacts in typical recordings of HEK293 cells. Limiting the maximal amplitude variation to 60% of the largest step in the trace removed the artifacts while still tolerating variations due to blinking events. 60% variation also accepted two fluorophores photobleaching during one frame exposure. Steps that did not fulfill all three criteria were not counted.
Quality Control
Despite PIF's accuracy in step detection, not all artifacts were ruled out. In particular, some traces were still analyzed that did not display any stepwise behavior (e.g. from “dirt” particles). This was a problem specific to automated algorithms. Although a user would by eye ignore these traces at once, the algorithm will accept them as long as the detected “steps” do not violate any of the above step detection criteria. The algorithm has to be instructed specifically which traces to discard. For this purpose, a set of five evaluation criteria were built into the software as a final quality control. These rejection criteria were found to be good indicators for the presence of contaminants contributing to trace artifacts. They include threshold values for a χ2 goodness-of-fit evaluation (χ2 >1.5), for a minimal SNR, for the step duration, as well as for the step amplitude. The χ2 of the traces also had to be smaller than the χ2 of a counterfit (for details see supplemental material) (35). If an idealized trace failed to meet the requirements of any of these criteria, it was omitted from analysis.
Determination of Accuracy
The algorithm's step detection accuracy (pacc) was evaluated for each SNR. Evaluation of the accuracy was achieved by computing the probability of correctly detecting exactly one step where exactly one step truly exists. Briefly, for each SNR, a step distribution histogram was obtained, from which the proportion of each detected step number was calculated. To correctly determine the accuracy, it was necessary to consider that simultaneous false step detections and missed events within the same trace would compensate one another. Such errors could result in “falsely” finding the correct overall step number present in a given trace. Consequently, the calculation of the accuracy takes the probability of missed events and false step detections into account.
Calculation of the Accuracy pacc
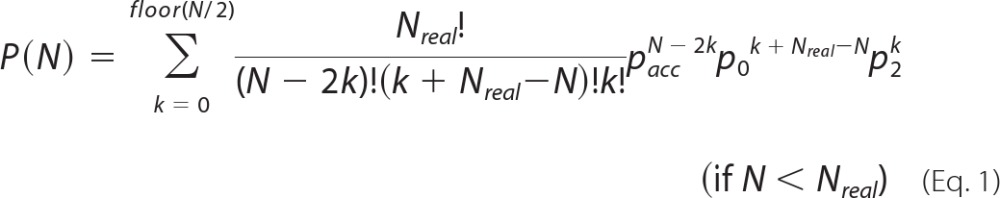
If PIF was applied to simulated photobleaching data containing exactly 11 steps, the accuracy of pacc could be derived from the resulting observed step distribution. As a first approximation based on the frequency of identifying 11 steps (P(11)), one could reason that P(11) ∼pacc11. However, there are several ways to attain a final count of 11 steps. For instance, step detection errors could result in including a step that does not truly exist (false detection) and/or in missing an existing step (missed event). A false detection and a missed event occurring in the same trace would result in an apparently accurate final step count, leading to an overestimation of pacc. To correct for such situations in the context of calculating pacc, we defined the theoretical frequency distribution of detecting N steps for Nreal real steps as shown in Equations 1 and 2,
 |
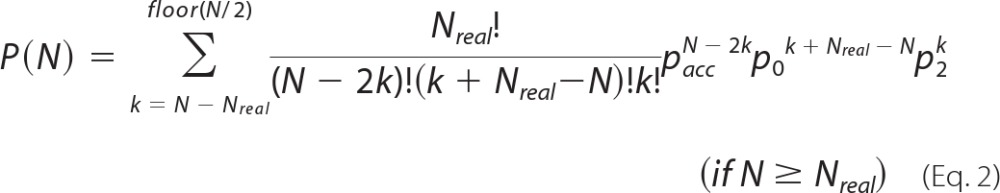 |
where p0 and p2 are the probabilities of missing a step and counting two steps for one real step, respectively. The factor at the beginning of each term represents all the arrangements of pacc, p0, and p2, as each event could happen in any order. The resulting theoretical distribution P(N) was then fitted to the observed step distribution as a function of pacc, p0, and p2. This fit was performed by minimizing the difference between our calculations and the actual distribution (Levenberg-Marquardt algorithm).
Kinetics of Fluorescent Protein Blinking
Two rate constants α and β determine the transitions out of and into the nonfluorescent state, respectively. For a constant photobleaching rate of κ = 0.1 s−1, we varied blinking frequency and duration (α = 1, 5, 10, and 50 s−1; β = 0.1 and 1 s−1; see supplemental Fig. 4). For both β values tested, step detection accuracy decreased slightly with increasing blinking duration (decreasing α). For blinking events with long duration (α ≤5 s−1), the decrease was significant even at SNR >2. Although for a moderate blinking rate (β = 0.1 s−1) the detection accuracy always remained above 90% for SNR >2, for a high blinking rate (β = 1 s−1) the 90% accuracy could only be achieved when α ≥10 s−1, i.e. if the events were not too long lived.
The above values for simulated blinking events were chosen to test the limitations of the algorithm and do not actually represent the conditions typically observed in experimental fluorescence recordings. To verify the blinking properties under typical conditions, we obtained experimental traces recorded from HEK293T cells expressing a monomeric form of “superfolder GFP” (msfGFP) (30) fused to GluK2 (see below). To obtain the experimental blinking rates α and β, the traces were fitted to a hidden Markov model using QuB (36, 37). We chose traces with particularly prominent blinking events to ensure precise computation of the blinking rate constants. Analysis resulted in two different phenotypic populations; the first population was typified by long low frequency blinking events with mean values for 〈α〉 and 〈β〉 of 1.27 ± 1.05 and 0.013 ± 0.07 s−1, respectively (n = 7). By contrast, the second population represented by the majority of traces exhibited a greater number of shorter blinking events with mean values for 〈α〉 and 〈β〉 of 12 ± 14 and 0.12 ± 0.11 s−1, respectively (n = 12).
Software
PIF was entirely programmed and run using Matlab (Mathworks, Nattick, MA). A compiled version of PIF will be made available upon request.
RESULTS
Identification of Relevant Spots
When performing single molecule fluorescence in mammalian cells, a multitude of spots varying in intensity and distribution are found (Fig. 1A). Manually selecting a number of these spots introduces a user bias such that a certain subpopulation (the “good-looking” ones) of proteins is favored at the expense of another. This is particularly pertinent when considering neuronal cells that invariably have a heterogeneous receptor expression pattern. It is therefore imperative to first detect all spots in the region of interest and then to separate relevant spots, originating from the tagged protein located on the plasma membrane, from contaminant spots by objective criteria independent of the respective user. To process the large number of spots found on a single mammalian cell, each relevant fluorescent spot had to be detected and analyzed in an automated fashion (Fig. 1, A–D).
In our automated analysis, spot identification was limited to a user-defined region of interest delineating the borders of a cell expressing the fluorescently tagged protein (Fig. 1A). To resolve single spots, background intensity originating from within the cells was suppressed by utilizing TIRF microscopy, which limits excitation to the areas close to the plasma membrane (38). However, TIRF configuration did not prevent excitation of any contaminant spots located close to the plasma membrane or within the penetration depth of the evanescent wave into the cytosol (∼0.2 μm). Both factors gave rise to contaminant spots that were difficult to distinguish from relevant spots corresponding to individual protein complexes (Fig. 2A).
FIGURE 2.

A, scheme of a HEK cell under TIRF illumination. GFP-labeled proteins located in plasma membrane and the ER can be excited. Other excited contaminant molecules are located directly on the coverslip. The global fluorescence decay of each of the three regions is shown before and after background removal. B, accuracy of the step detection algorithm was evaluated from simulations of various photobleaching step conditions. These include the simulation of traces mimicking the experimental conditions, which were C-K filtered because of the initially low SNR observed in msfGFP-based experiments. Each set of simulations includes about 500 individual photobleaching traces. C, accuracy is calculated for each SNR from simulation of traces exhibiting equidistant photobleaching steps in the absence of blinking events. The relationship between the accuracy and SNR is illustrated both before (black squares) and after C-K filtering (red triangles). D, typical experimental conditions were used to simulate traces containing 1–6 steps with a final SNR of ∼4 after C-K filtering. The maxima of the detected step number distribution are plotted against the actual number of steps present in the trace. The error was evaluated using full-width at half-maximum.
Common contaminant sources included macromolecules present at the surface of the glass coverslip as well as endogenous proteins of the cell. For instance, flavins are abundantly expressed in the cytosol and are known to have spectral properties similar to GFP, albeit with much lower extinction coefficient and quantum yield (39, 40). Thus, they fluoresce with significantly lower intensity than proteins tagged with a fluorescent protein variant. Similarly, proteins located at a distance of more than 200 nm from the plasma membrane in the cytosol fluoresce with very low intensities when using TIRF excitation. This allowed us to rule out many contaminant spots by defining a threshold for the fluorescence intensity of the spots (supplemental Fig. 1D).
Other contaminants that exhibited fluorescence intensity comparable with our proteins of interest were not so easily distinguished. These were contaminants positioned so close to the membrane that their fluorescence intensity was not reduced by TIRF excitation. Some contaminants were also observed in the absence of tagged proteins and thus attached to the coverslip surface (Fig. 2A, orange). Also, tagged proteins retained in the ER were still detected in mammalian cells (Fig. 2A, violet). In oocytes, the ER is positioned at a distance of more than 1 μm from the plasma membrane (41) and is optically shielded by the strong pigmentation just below the membrane. In contrast, in mammalian cells, the ER came so close to the plasma membrane that proteins therein were still excited in TIRF configuration. We tested this by transfecting HEK293 cells with a Kainate receptor that was retained in the ER (GluK5 fused to msfGFP). Even under TIRF excitation, proteins in the ER were still clearly detectable with intensities not significantly lower than proteins expressed at the plasma membrane. These spots had to be excluded because they might have been retained in the ER exactly because they did not exhibit the correct subunit composition.
We found that both types of contaminants, spots on the coverslip and tagged proteins in the ER, were (despite their comparable fluorescence intensity) distinguishable from relevant spots in their photobleaching decay times. On clean coverslips devoid of cells, a fast fluorescence decay was observed and could accordingly be attributed to background arising from impurities (Fig. 2A, orange). When expressing the trafficking deficient mutant GluK5-msfGFP, we found a very slow decay. The longer distance for proteins in the ER, and thus lower TIRF excitation, leads to lower excitation intensities and, by association, slow bleaching time constants (Fig. 2A, violet). The remaining medium component was the relevant component associated with the photobleaching of the msfGFP fluorophores (Fig. 2A, green).
To remove fluorescence from the undesired fast and slow components, we applied a LoG filter (Fig. 1B), which is known from deconvolution of confocal images to increase resolution and remove blurring (see “Experimental Procedures”) (32). Prior to filtering, the contaminant fast and slow components each accounted for 15–20% of the overall fluorescence leaving 60–70% attributed to the relevant msfGFP fluorescence. Filtering completely removed the fast background component and substantially attenuated the slow contaminant component, resulting in 90% fluorescence from the proteins of interest (Fig. 2A). At this time, we separated the complete ensemble of spots originating from tagged proteins on the plasma membrane from any contaminants. The associated fluorescence traces were finally filtered to increase their signal-to-noise ratio (Chung-Kennedy filter; Fig. 1B) before entering the step detection phase.
Step Detection Algorithm PIF
In the second phase, the automated step detection algorithm was applied to every fluorescent trace from relevant spots identified above (Fig. 1C; see “Experimental Procedures” and supplemental material for a detailed description of the algorithm). Other step detection algorithms, designed to work at the high noise levels that were typically observed in mammalian cells, detected deviations larger than the noise level and compared them with the “signal” amplitude. In the case of photobleaching, this strategy was not practical as both the signal-to-noise ratio and the expected intensity levels (or even their number) could not be determined ad hoc but were irreversibly intertwined with the number of steps that we wished to measure. In the PIF algorithm, this problem was solved by considering the variations of intensity rather than the noise (supplemental material) and by using a slow iterative process to detect the steps. We found that direct detection was more likely to miss a step or not to filter out artifacts. PIF, in contrast, was initially overly sensitive and detected any “ripple,” but with each iteration and decreasing sensitivity, these were smoothed out until only the real steps were crystallized out. Steps in the idealized traces were finally analyzed according to a number of objective criteria to rule out any artifacts (see “Quality Control” under “Experimental Procedures” and Fig. 1D). PIF recognized each step in data typical for experimental conditions with an accuracy of more than 90% (Fig. 2B and see below).
Testing Step Detection by PIF in Simulations
We tested how well the PIF algorithm finds the correct photobleaching steps from noisy traces in simulated data. We simulated traces traversing 11 equidistant steps following a hidden Markov model with signal-to-noise ratios (SNR) between 0.33 and 5.75 (see under “Experimental Procedures”). We determined the accuracy of step fitting to be higher than 90% for SNRs over ∼2 without filtering (Fig. 2C, black trace). The accuracy was significantly improved by C-K filtering at low SNRs, and 90% accuracy was achieved for SNR >1.2 (Fig. 2C, red trace).
Because fluorophores exhibit variable intensities (42), the amplitudes of photobleaching steps were not necessarily identical but exhibited variations to some degree. Amplitudes vary typically by 33% under experimental conditions. We allowed the step amplitudes to vary in simulated data by 33 and 75% representing a typical and extreme value, respectively. In both cases, step detection accuracy was not substantially altered and remained above 90% (Fig. 2B).
Most subunit counting experiments were performed using fusion constructs with fluorescent proteins such as GFP and its derivatives. These fusion constructs evade any problems of unspecific labeling or accessibility, as expected for labeling with organic fluorophores (15, 43) or antibodies (11), respectively. However, GFP and its derivatives have been shown to exhibit recurrent short dark periods in their emission known as blinking (44, 45). The onset of each dark period was comparable with a photobleaching step but differed in that it recovered to the original intensity. We tested the effect of blinking on step detection accuracy of PIF in simulated traces containing four steps of equal amplitude (Fig. 2B). The kinetics of blinking were obtained from TIRF recordings with an iGluK2 fusion construct with the monomeric version of superfolder GFP (msfGFP, see below) expressed in HEK293 cells (see “Experimental Procedures”). Both sets of kinetic parameters found were tested in simulations, and neither had a significant effect on the accuracy of step detection of the PIF algorithm (Fig. 2B). Combining values of both the variations in step amplitude and the blinking rates typical for photobleaching data obtained from mammalian cells, the PIF step detection accuracy was still found to be over 90% (Fig. 2B).
We finally tested how well PIF determines the correct stoichiometry for different oligomers. We simulated photobleaching data with experimental parameters of different stoichiometries, i.e. 500 traces each for monomers and dimers up to hexamers, and we let PIF analyze these data in an automated fashion. On average, each step was found with an accuracy of over 90%, and the maxima of the distributions were exactly at the correct value (Fig. 2D). These simulations confirmed the capability of PIF to determine the correct stoichiometry of a multimeric protein under experimental conditions.
Fluorescent Subunit Counting in Mammalian Cells
Fluorescent subunit counting data were collected from fixed HEK293T cells transiently transfected with a fluorescently tagged ligand-gated ionotropic glutamate receptor GluK2. HEK293T cells as a recombinant expression system are typically used for expression of membrane proteins and offer particular advantages with respect to the neuronal ion channels analyzed in this study. Unlike X. laevis oocytes (26), HEK293T cells do not endogenously express kainate receptors. Furthermore, despite their origin as kidney cells, HEK293T cells share a common mRNA transcription profile with neurons (47). This final point gives confidence that the ion channels such as GluK2, which are natively expressed almost exclusively in neurons, keep their inherent stoichiometry when expressed either in homo- or in heteromeric form.
N-terminal to GluK2 a msfGFP was fused, and cells were imaged using TIRF microscopy. Under these conditions, cells exhibiting low msfGFP-GluK2 expression levels showed single molecule fluorescence clearly visible above background fluorescence levels (Fig. 1A). If expression density or background fluorescence was substantial, cells were automatically removed from analysis because too many traces were rejected by PIF. Typically, 50 ± 8% of traces were excluded from counting analysis by the program; however, recordings resulting in more than 70% trace rejection were not considered for analysis, as such recordings indicated inappropriate cell selection. For all other cells, PIF automatically analyzed the recordings and accumulated the step number histogram (Fig. 3A).
FIGURE 3.

A and B, PIF automated analysis over GluK2 and GlyRα1. A, final step distribution of msfGFP-GluK2 (bars) is fitted to a binomial distribution of 4th order (tetramer) either for purely single-channel spots (blue circles) or allowing the possibility of two channels on the same spot (red squares). The resulting probabilities to detect fluorescence from a fluorescent protein were pm = 57 and 53% for purely single and combined single and double occupancies, respectively. For the latter, the fraction of single occupancy was 77%. B, final step distribution of msfGFP-GlyRα1 was fitted to a 5th order binomial distribution (pentamer) and revealed an identical pm = 0.53 as well as a similar single occupancy (84%) to msfGFP-GluK2. The distribution was also fitted to a 6th order binomial distribution (hexamer) with pm set to 0.53.
Finally, the step number histogram that we obtained from the automated analysis remained to be interpreted. If all GFP molecules were fluorescent, the step number would match the number of subunits per protein assembly. Unfortunately, however, each fluorescent protein has only a certain probability (pm) of being fluorescent as defined by the ability of the chromophore to fold and mature correctly (7, 48). As all identical fluorophores have an equal probability of fluorescing (pm), the resulting step number histogram has to follow a binomial distribution dependent on this maturation probability. Previous reports counting enhanced GFP fusion proteins expressed in X. laevis oocytes matured at ∼18 °C have estimated pm values between 75 and 80%. Such maturation rates were not achieved at the 37 °C required for mammalian cell culture. To optimize maturation rates as much as possible, we constructed a monomeric version of the superfolder GFP msfGFP (29, 30). The monomeric version of GFP prevented protein-protein interactions between GFPs, which might influence stoichiometry.
Consistent with the known homotetrameric assembly of GluK2-msfGFP, the step histogram generated automatically by PIF was best fit by a binomial distribution of 4th order (Fig. 3A, blue trace). Interestingly, a fraction of spots exhibited between five and eight steps, which were not considered for the fit. They strongly suggested some cases where two receptors occupied a single spot. Whether this is a result of inadequate system resolution or is biologically relevant remains currently unknown. To account for the fraction of spots with two receptors, the binomial distribution was adjusted to consider both possibilities (supplemental material), which significantly improved the fit (Fig. 3A, red trace), and we were able to estimate that ∼23% of the spots contained two receptors.
The maturation probability of GFP only depends on the expression system and the temperature during maturation and not on the protein to which it is fused (30). This value has to be determined once for a given expression system with a protein of known subunit composition (here 53%) and will remain constant for any further protein. The distribution will then only depend on the order of the binomial given by the number of subunits. To confirm the universal validity of the pm, PIF was applied to another ion channel of known stoichiometry. The above experiments defined pm = 0.53 for our expression system. We now expressed an msfGFP-tagged α1 glycine receptor (GlyRα1) and automatically analyzed the subunit counting data. As before, the best fit was obtained assuming two receptors could occupy a single resolvable spot, evident in the detection of several traces containing six to nine photobleaching steps. Similar to GluK2, ∼84% of spots were estimated to contain individual GlyRα1 receptors. The step number histogram was fit with double-binomial distributions of 5th (pentamers) as well as 6th order (hexamers; Fig. 3B). However, only the pentameric stoichiometry reported a pm of 53%, a value identical to that obtained in GluK2 experiments, whereas the hexameric stoichiometry required a pm = 46%. A hexameric distribution with a pm = 53% was clearly not able to follow the obtained distribution (Fig. 3B). By calibrating the system with a defined maturation rate pm, we can thus determine unambiguously the stoichiometry of a membrane protein despite the low maturation rate of fluorescent proteins in mammalian cells.
DISCUSSION
In this study, we provide a complete framework to study the stoichiometry of any membrane protein in a mammalian expression system using single subunit counting. First, we have developed a fully automated subunit counting algorithm, PIF, that greatly minimizes user bias in discerning photobleaching steps from background noise. The automation of step detection has the added advantage of permitting the analysis of large datasets over a short time period, thus minimizing the risk of analyzing only part of a heterogeneous population. Second, PIF is able to reliably extract the relevant signal from records with relatively low signal-to-noise ratio enabling us to routinely study the stoichiometry of a wide variety of membrane proteins expressed in mammalian cells. This feature resolves the emerging concern of performing similar experiments in X. laevis oocytes where mammalian protein assembly is sometimes problematic. Finally, we introduced in the analysis the use of a fixed maturation rate specific to each expression system and double-binomial distributions in response to low GFP maturation rate and co-localization of single photobleaching spots, respectively. Interestingly, co-localization was not reported in prior work where the manual counting of photobleaching steps was performed on Xenopus oocytes. Whether this finding is unique to mammalian cells or has been neglected given the nature of the manual method will require further study.
Comparison with Previous Studies
Other step detection algorithms perform well for numerous applications (34). To evaluate how these other step detection algorithms performed for subunit counting compared with PIF, we applied the STEPFINDER algorithm (35) to simulated traces exhibiting variable SNRs in the absence of blinking. STEPFINDER is a χ2-based algorithm originally developed to analyze the stepwise behavior of molecular motor displacements and was recently applied as a tool to analyze fluorescent subunit counting data (49). Despite the proficiency of STEPFINDER as a tool for determining molecular motor displacements, the computed accuracy of PIF was significantly higher than STEPFINDER, particularly at low SNR (< 4; supplemental Fig. 1E). Like STEPFINDER, PIF could also be applied in the context of molecular motor displacements or similar experiments, especially because blinking would not be an issue. Similarly, PIF could also analyze data derived from oocytes or even purified proteins (7, 14, 15, 18).
Some previous studies deduced the number of subunits from the fluorescence intensity distribution of the individual spots rather than counting the number of photobleaching steps as in this study (8, 16, 17, 50). Evaluation of the fluorescence intensities depends on relatively constant quantal intensity. Our data indicate, however, that a mean variation of 35% is typically observed in mammalian cells using fluorescent proteins. These variations may result from microenvironment changes (e.g. quencher concentration) (14, 51), dipole orientation (42), and uneven excitation intensity over the field of view.
Challenges for Future Work on Mammalian Cells
Although the ideal situation would be to study membrane-bound mammalian proteins in their native environment, this is difficult for a number of reasons. For example, the study of neurotransmitter receptors, as performed here, would be most relevant if performed in cultured neurons or acutely isolated explant tissue where the normal clustering and assembly of neurotransmitter receptors are regulated by a variety of intrinsic and extrinsic factors (46, 52). The successful execution of subunit counting using PIF would prove difficult under these conditions due to high protein densities that would make single-protein resolution unlikely. Given that PIF remains highly accurate over a wide range of SNRs, automated subunit counting analysis utilizing neurons may be possible, for example at extrasynaptic sites, provided receptor density is sufficiently low. An added complication, however, would be the formation of protein complexes between endogenous and recombinant protein subunits that would interfere with estimates of stoichiometry. This problem can only be overcome either by silencing the endogenous expression or by directly analyzing the endogenous proteins with PIF fluorescently tagging them with specific antibodies or toxins (11). In view of these difficulties, HEK293T cells were selected as the expression system in this study. Despite the challenge of background fluorescence resulting in low SNR, this cell line is used routinely in many laboratories. Most importantly, it shares a surprisingly similar mRNA expression profile with neurons (47) making it the cell of choice for subunit counting of neurotransmitter receptors.
A more tenable issue that may be resolved in the near future is to maximize the post-translational formation of the chromophore of GFP. In this study, we constructed a monomeric form of superfolder GFP (msfGFP) fused to the protein of interest because GFP dimerization would likely influence protein assembly (29, 30). Compared with other GFP variants, the superfolder GFP has the advantages of superior folding efficiency and chromophore maturation properties at 37 °C (30). In addition, it is also brighter, thus increasing SNR in single molecule studies. Despite the enhanced folding and maturation, the reported pm values in Xenopus oocytes (75–80%) (7) are significantly greater than the values we obtained expressing msfGFP (53%) in mammalian cells. This is a critical factor to resolve in future work because maximizing pm optimizes the confidence in the binomial fit of the photobleaching step distribution. Why maturation rates are lower in mammalian cells is still not clear, although it is likely related to the higher temperature needed for mammalian cell culture, which in turn affects the temperature-sensitive folding of GFP (27). Working at decreased temperature would only solve the problem to a limited extent as not only folding of GFP but possibly also folding, assembly, and trafficking of the protein of interest would be affected. As we learn more about the structure of GFP and its variants, it may be possible to make mutations that allow the formation of the chromophore to be optimized at 37 °C (27, 28).
Conclusion
The last 2 decades has seen unprecedented advances in our understanding of a plethora of membrane-bound protein families in mammals, from their initial molecular identification by cloning to elucidation of their function with genetically modified animals. Despite these advances, many basic properties of these proteins, such as subunit stoichiometry, remain poorly understood. Here, we have developed a reliable subunit counting method specifically for the study of proteins expressed in mammalian cells. The universality of this technique makes it possible to re-visit the widely anticipated role of subunit composition in fine-tuning the response of individual cells and tissues to their external environment.
Acknowledgment
We thank Elise Faure for stimulating discussions and comments on the manuscript. GÉPROM is a research group funded by the Fonds de la Recherche en Santé du Québec.
This work was supported in part by operating grants from Natural Sciences and Engineering Research Council of Canada and the Canadian Institutes of Health Research (to R. B. and D. B.).

- TIRF
- total internal reflection fluorescence
- SNR
- signal-to-noise ratio
- msfGFP
- monomeric superfolder GFP
- C-K
- Chung-Kennedy
- ER
- endoplasmic reticulum
- LoG
- Laplacian of Gaussian.
REFERENCES
- 1. Schägger H., Cramer W. A., von Jagow G. (1994) Analysis of molecular masses and oligomeric states of protein complexes by blue native electrophoresis and isolation of membrane protein complexes by two-dimensional native electrophoresis. Anal. Biochem. 217, 220–230 [DOI] [PubMed] [Google Scholar]
- 2. Zheng J., Trudeau M. C., Zagotta W. N. (2002) Rod cyclic nucleotide-gated channels have a stoichiometry of three CNGA1 subunits and one CNGB1 subunit. Neuron 36, 891–896 [DOI] [PubMed] [Google Scholar]
- 3. Doyle D. A., Morais Cabral J., Pfuetzner R. A., Kuo A., Gulbis J. M., Cohen S. L., Chait B. T., MacKinnon R. (1998) The structure of the potassium channel. Molecular basis of K+ conduction and selectivity. Science 280, 69–77 [DOI] [PubMed] [Google Scholar]
- 4. Sobolevsky A. I., Rosconi M. P., Gouaux E. (2009) X-ray structure, symmetry, and mechanism of an AMPA-subtype glutamate receptor. Nature 462, 745–756 [DOI] [PMC free article] [PubMed] [Google Scholar]
- 5. Barrera N. P., Betts J., You H., Henderson R. M., Martin I. L., Dunn S. M., Edwardson J. M. (2008) Atomic force microscopy reveals the stoichiometry and subunit arrangement of the α4β3δ GABAA receptor. Mol. Pharmacol. 73, 960–967 [DOI] [PubMed] [Google Scholar]
- 6. Park M., Kim H. H., Kim D., Song N. W. (2005) Counting the number of fluorophores labeled in biomolecules by observing the fluorescence-intensity transient of a single molecule. Bull. Chem. Soc. Jpn. 78, 1612–1618 [Google Scholar]
- 7. Ulbrich M. H., Isacoff E. Y. (2007) Subunit counting in membrane-bound proteins. Nat. Methods 4, 319–321 [DOI] [PMC free article] [PubMed] [Google Scholar]
- 8. Godin A. G., Costantino S., Lorenzo L. E., Swift J. L., Sergeev M., Ribeiro-da-Silva A., De Koninck Y., Wiseman P. W. (2011) Revealing protein oligomerization and densities in situ using spatial intensity distribution analysis. Proc. Natl. Acad. Sci. U.S.A. 108, 7010–7015 [DOI] [PMC free article] [PubMed] [Google Scholar]
- 9. Schmidt T., Schütz G. J., Gruber H. J., Schindler H. (1996) Local stoichiometries determined by counting individual molecules. Anal. Chem. 68, 4397–4401 [Google Scholar]
- 10. Leake M. C., Chandler J. H., Wadhams G. H., Bai F., Berry R. M., Armitage J. P. (2006) Stoichiometry and turnover in single, functioning membrane protein complexes. Nature 443, 355–358 [DOI] [PubMed] [Google Scholar]
- 11. Simonson P. D., Deberg H. A., Ge P., Alexander J. K., Jeyifous O., Green W. N., Selvin P. R. (2010) Counting bungarotoxin-binding sites of nicotinic acetylcholine receptors in mammalian cells with high signal/noise ratios. Biophys. J. 99, L81-L83 [DOI] [PMC free article] [PubMed] [Google Scholar]
- 12. Das S. K., Darshi M., Cheley S., Wallace M. I., Bayley H. (2007) Membrane protein stoichiometry determined from the step-wise photobleaching of dye-labeled subunits. ChemBioChem 8, 994–999 [DOI] [PubMed] [Google Scholar]
- 13. Shu D., Zhang H., Jin J., Guo P. (2007) Counting of six pRNAs of φ29 DNA-packaging motor with customized single-molecule dual-view system. EMBO J. 26, 527–537 [DOI] [PMC free article] [PubMed] [Google Scholar]
- 14. Blunck R., McGuire H., Hyde H. C., Bezanilla F. (2008) Fluorescence detection of the movement of single KcsA subunits reveals cooperativity. Proc. Natl. Acad. Sci. U.S.A. 105, 20263–20268 [DOI] [PMC free article] [PubMed] [Google Scholar]
- 15. Groulx N., McGuire H., Laprade R., Schwartz J. L., Blunck R. (2011) Single molecule fluorescence study of the Bacillus thuringiensis toxin Cry1Aa reveals tetramerization. J. Biol. Chem. 286, 42274–42282 [DOI] [PMC free article] [PubMed] [Google Scholar]
- 16. Kask P., Palo K., Ullmann D., Gall K. (1999) Fluorescence-intensity distribution analysis and its application in biomolecular detection technology. Proc. Natl. Acad. Sci. U.S.A. 96, 13756–13761 [DOI] [PMC free article] [PubMed] [Google Scholar]
- 17. Chen Y., Müller J. D., So P. T., Gratton E. (1999) The photon counting histogram in fluorescence fluctuation spectroscopy. Biophys. J. 77, 553–567 [DOI] [PMC free article] [PubMed] [Google Scholar]
- 18. Reiner A., Arant R. J., Isacoff E. Y. (2012) Assembly stoichiometry of the GluK2/GluK5 kainate receptor complex. Cell Rep. 1, 234–240 [DOI] [PMC free article] [PubMed] [Google Scholar]
- 19. Axelrod D. (2001) Total internal reflection fluorescence microscopy in cell biology. Traffic 2, 764–774 [DOI] [PubMed] [Google Scholar]
- 20. Sivilotti L. G., McNeil D. K., Lewis T. M., Nassar M. A., Schoepfer R., Colquhoun D. (1997) Recombinant nicotinic receptors, expressed in Xenopus oocytes, do not resemble native rat sympathetic ganglion receptors in single-channel behavior. J. Physiol. 500, 123–138 [DOI] [PMC free article] [PubMed] [Google Scholar]
- 21. Krashia P., Moroni M., Broadbent S., Hofmann G., Kracun S., Beato M., Groot-Kormelink P. J., Sivilotti L. G. (2010) Human α3β4 neuronal nicotinic receptors show different stoichiometry if they are expressed in Xenopus oocytes or mammalian HEK293 cells. PLoS One 5, e13611. [DOI] [PMC free article] [PubMed] [Google Scholar]
- 22. Buller A. L., White M. M. (1990) Functional acetylcholine receptors expressed in Xenopus oocytes after injection of Torpedo β, γ, and δ subunit RNAs are a consequence of endogenous oocyte gene expression. Mol. Pharmacol. 37, 423–428 [PubMed] [Google Scholar]
- 23. Schmidt C., Hollmann M. (2008) Apparent homomeric NR1 currents observed in Xenopus oocytes are caused by an endogenous NR2 subunit. J. Mol. Biol. 376, 658–670 [DOI] [PubMed] [Google Scholar]
- 24. Hagiwara S., Jaffe L. A. (1979) Electrical properties of egg cell membranes. Annu. Rev. Biophys. Bioeng. 8, 385–416 [DOI] [PubMed] [Google Scholar]
- 25. Dascal N. (1987) The use of Xenopus oocytes for the study of ion channels. CRC Crit. Rev. Biochem. 22, 317–387 [DOI] [PubMed] [Google Scholar]
- 26. Schmidt C., Klein C., Hollmann M. (2009) Xenopus laevis oocytes endogenously express all subunits of the ionotropic glutamate receptor family. J. Mol. Biol. 390, 182–195 [DOI] [PubMed] [Google Scholar]
- 27. Siemering K. R., Golbik R., Sever R., Haseloff J. (1996) Mutations that suppress the thermosensitivity of green fluorescent protein. Curr. Biol. 6, 1653–1663 [DOI] [PubMed] [Google Scholar]
- 28. Craggs T. D. (2009) Green fluorescent protein. Structure, folding, and chromophore maturation. Chem. Soc. Rev. 38, 2865–2875 [DOI] [PubMed] [Google Scholar]
- 29. Zacharias D. A., Violin J. D., Newton A. C., Tsien R. Y. (2002) Partitioning of lipid-modified monomeric GFPs into membrane microdomains of live cells. Science 296, 913–916 [DOI] [PubMed] [Google Scholar]
- 30. Pédelacq J. D., Cabantous S., Tran T., Terwilliger T. C., Waldo G. S. (2006) Engineering and characterization of a superfolder green fluorescent protein. Nat. Biotechnol. 24, 79–88 [DOI] [PubMed] [Google Scholar]
- 31. Geiser M., Cèbe R., Drewello D., Schmitz R. (2001) Integration of PCR fragments at any specific site within cloning vectors without the use of restriction enzymes and DNA ligase. BioTechniques 31, 88–90 [DOI] [PubMed] [Google Scholar]
- 32. Wallace W., Schaefer L. H., Swedlow J. R. (2001) A working person's guide to deconvolution in light microscopy. BioTechniques 31, 1076–1078 [DOI] [PubMed] [Google Scholar]
- 33. Chung S. H., Kennedy R. A. (1991) Forward-backward nonlinear filtering technique for extracting small biological signals from noise. J. Neurosci. Methods 40, 71–86 [DOI] [PubMed] [Google Scholar]
- 34. Carter B. C., Vershinin M., Gross S. P. (2008) A comparison of step-detection methods. How well can you do? Biophys. J. 94, 306–319 [DOI] [PMC free article] [PubMed] [Google Scholar]
- 35. Kerssemakers J. W., Munteanu E. L., Laan L., Noetzel T. L., Janson M. E., Dogterom M. (2006) Assembly dynamics of microtubules at molecular resolution. Nature 442, 709–712 [DOI] [PubMed] [Google Scholar]
- 36. Qin F., Auerbach A., Sachs F. (2000) Hidden Markov modeling for single channel kinetics with filtering and correlated noise. Biophys. J. 79, 1928–1944 [DOI] [PMC free article] [PubMed] [Google Scholar]
- 37. Qin F., Auerbach A., Sachs F. (2000) A direct optimization approach to hidden Markov modeling for single channel kinetics. Biophys. J. 79, 1915–1927 [DOI] [PMC free article] [PubMed] [Google Scholar]
- 38. Axelrod D., Burghardt T. P., Thompson N. L. (1984) Total internal reflection fluorescence. Annu. Rev. Biophys. Bioeng. 13, 247–268 [DOI] [PubMed] [Google Scholar]
- 39. Benson R. C., Meyer R. A., Zaruba M. E., McKhann G. M. (1979) Cellular autofluorescence. Is it due to flavins? J. Histochem. Cytochem. 27, 44–48 [DOI] [PubMed] [Google Scholar]
- 40. Xiao J. (2009) in Handbook of Single-molecule Biophysics (Hinterdorfer P., Oijen A. v., eds) pp. 43–93, Springer-Verlag Inc., New York [Google Scholar]
- 41. Terasaki M., Runft L. L., Hand A. R. (2001) Changes in organization of the endoplasmic reticulum during Xenopus oocyte maturation and activation. Mol. Biol. Cell 12, 1103–1116 [DOI] [PMC free article] [PubMed] [Google Scholar]
- 42. Ding H., Wong P. T., Lee E. L., Gafni A., Steel D. G. (2009) Determination of the oligomer size of amyloidogenic protein β-amyloid(1–40) by single-molecule spectroscopy. Biophys. J. 97, 912–921 [DOI] [PMC free article] [PubMed] [Google Scholar]
- 43. Blunck R., Starace D. M., Correa A. M., Bezanilla F. (2004) Detecting rearrangements of shaker and NaChBac in real time with fluorescence spectroscopy in patch-clamped mammalian cells. Biophys. J. 86, 3966–3980 [DOI] [PMC free article] [PubMed] [Google Scholar]
- 44. Dickson R. M., Cubitt A. B., Tsien R. Y., Moerner W. E. (1997) On/off blinking and switching behavior of single molecules of green fluorescent protein. Nature 388, 355–358 [DOI] [PubMed] [Google Scholar]
- 45. Pierce D. W., Hom-Booher N., Vale R. D. (1997) Imaging individual green fluorescent proteins. Nature 388, 338. [DOI] [PubMed] [Google Scholar]
- 46. Turrigiano G. G. (2008) The self-tuning neuron. Synaptic scaling of excitatory synapses. Cell 135, 422–435 [DOI] [PMC free article] [PubMed] [Google Scholar]
- 47. Shaw G., Morse S., Ararat M., Graham F. L. (2002) Preferential transformation of human neuronal cells by human adenoviruses and the origin of HEK 293 cells. FASEB J. 16, 869–871 [DOI] [PubMed] [Google Scholar]
- 48. Garcia-Parajo M. F., Koopman M., van Dijk E. M., Subramaniam V., van Hulst N. F. (2001) The nature of fluorescence emission in the red fluorescent protein DsRed, revealed by single-molecule detection. Proc. Natl. Acad. Sci. U.S.A. 98, 14392–14397 [DOI] [PMC free article] [PubMed] [Google Scholar]
- 49. Schuster M., Lipowsky R., Assmann M. A., Lenz P., Steinberg G. (2011) Transient binding of dynein controls bidirectional long range motility of early endosomes. Proc. Natl. Acad. Sci. U.S.A. 108, 3618–3623 [DOI] [PMC free article] [PubMed] [Google Scholar]
- 50. Swift J. L., Godin A. G., Doré K., Freland L., Bouchard N., Nimmo C., Sergeev M., De Koninck Y., Wiseman P. W., Beaulieu J. M. (2011) Quantification of receptor tyrosine kinase transactivation through direct dimerization and surface density measurements in single cells. Proc. Natl. Acad. Sci. U.S.A. 108, 7016–7021 [DOI] [PMC free article] [PubMed] [Google Scholar]
- 51. Blunck R., Cordero-Morales J. F., Cuello L. G., Perozo E., Bezanilla F. (2006) Detection of the opening of the bundle crossing in KcsA with fluorescence lifetime spectroscopy reveals the existence of two gates for ion conduction. J. Gen. Physiol. 128, 569–581 [DOI] [PMC free article] [PubMed] [Google Scholar]
- 52. Spitzer N. C. (2012) Activity-dependent neurotransmitter re-specification. Nat. Rev. Neurosci. 13, 94–106 [DOI] [PMC free article] [PubMed] [Google Scholar]