VOLUME 287 (2012) PAGES 4000–4013
PAGE 4002:
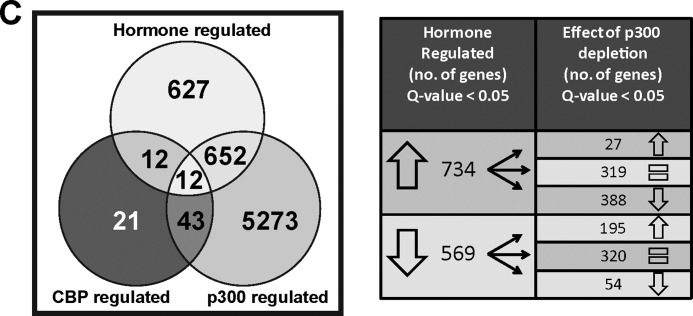
For statistical analysis of the microarray data represented in Fig. 1C, the optimal method for establishing statistical significance of the genes with altered expression levels as a result of hormone treatment and/or depletion of CBP or p300 was not used. The revised analysis involves a change to the batch correction method. The revised analysis resulted in an increased number of genes in each of the gene sets. The corrected Fig. 1C is shown below. One major conclusion of the paper was that p300 is the dominant coregulator of the CBP/p300 pair in these cells. The revised results do not affect that conclusion or any other conclusions made in this work.
FIGURE 1C.
Supplemental Tables 3–5 contain revised lists of significant genes from the microarray analysis. The supplemental data now contain the revised code used to analyze the microarray data.


