

Background: Mechanisms that regulate proteasome subunit expression are not completely understood.
Results: We described a novel Nrf1-dependent increase in proteasome gene expression.
Conclusion: The increase in proteasome function causes polycomb protein degradation.
Significance: Compensatory increase in proteasome subunit expression may be useful in therapy.
Keywords: Epidermis, Keratinocytes, Nrf2, Polycomb, Proteasome, Bmi-1, Ezh2, Keratinocyte, Squamous Cell Carcinoma
Abstract
The polycomb group (PcG) proteins, Bmi-1 and Ezh2, are important epigenetic regulators that enhance skin cancer cell survival. We recently showed that Bmi-1 and Ezh2 protein level is reduced by treatment with the dietary chemopreventive agents, sulforaphane and green tea polyphenol, and that this reduction involves ubiquitination of Bmi-1 and Ezh2, suggesting a key role of the proteasome. In the present study, we observe a surprising outcome that Bmi-1 and Ezh2 levels are reduced by treatment with the proteasome inhibitor, MG132. We show that this is associated with a compensatory increase in the level of mRNA encoding proteasome protein subunits in response to MG132 treatment and an increase in proteasome activity. The increase in proteasome subunit level is associated with increased Nrf1 and Nrf2 level. Moreover, knockdown of Nrf1 attenuates the MG132-dependent increase in proteasome subunit expression and restores Bmi-1 and Ezh2 expression. The MG132-dependent loss of Bmi-1 and Ezh2 is associated with reduced cell proliferation, accumulation of cells in G2, and increased apoptosis. These effects are attenuated by forced expression of Bmi-1, suggesting that PcG proteins, consistent with a prosurvival action, may antagonize the action of MG132. These studies describe a compensatory Nrf1-dependent, and to a lesser extent Nrf2-dependent, increase in proteasome subunit level in proteasome inhibitor-treated cells and confirm that PcG protein levels are regulated by proteasome activity.
Introduction
The polycomb group (PcG)2 genes encode a family of proteins that methylate and ubiquitinate histones to close chromatin and suppress gene expression (1, 2). There are two cooperating polycomb repressive complexes, PRC2 and PRC1. The PRC2 complex includes Eed, Ezh2, SUZ12, and RbAp46. The PRC1 complex includes Bmi-1, Mel18, HPC, HPH, SCML, and Ring1A/1B (1). These complexes suppress gene expression via a sequential two-step mechanism. In the initial step, the Ezh2 subunit of the PRC2 complex catalyzes trimethylation of lysine 27 of histone H3 (H3K27me3) (3, 4). Following this, the chromobox homolog (CBX) protein interacts with H3K27me3 to anchor the PRC1 complex to chromatin, and the Ring1B subunit of the complex ubiquitinates lysine 119 of histone H2A (5). These events lead to the closing of chromatin and cessation of gene expression. The ultimate effect of these changes is to silence tumor suppressor gene expression to enhance cell survival.
Because PcG proteins act to silence tumor suppressor expression, reducing PcG expression is an important goal of chemoprevention. We have recently shown that sulforaphane (SFN), a bioactive chemopreventive agent, derived from cruciferous vegetables, and bioactive polyphenols derived from green tea reduce polycomb group protein level and reduce H3K27me3 formation (6, 7). Moreover, this is associated with enhanced expression of genes that suppress cell proliferation and activate cell death processes, including increasing p21Cip1 expression and activating apoptosis (8–10). The loss of Bmi-1 and Ezh2 expression is due to enhanced degradation in the proteasome (6, 7), and these results suggest that dietary isothiocyanates suppress cancer progression by reducing PcG protein level via a proteasome-dependent mechanism.
In the course of these studies, we observed the counterintuitive finding that treating skin cancer cells with MG132, a proteasome inhibitor, reduced Bmi-1 and Ezh2 level. In the present study, we examine the mechanism accounting for this finding. Our results indicate that inhibition of proteasome function is associated with a compensatory increase in proteasome subunit mRNA level and proteasome activity. Nrf1 and Nrf2 are key transcription factors that control proteasome subunit gene expression in cells under stress (11–15). Our studies show that MG132 triggers an increase in Nrf1 and Nrf2 level and that knockdown of Nrf1, and to a lesser extent Nrf2, in MG132-treated cells prevents the increase in proteasome subunit-encoding mRNA. This suggests that proteasome inhibitors induce degradation of Bmi-1 and Ezh2 via a compensatory mechanism that involves an Nrf1-dependent increase in proteasome subunit gene expression.
MATERIALS AND METHODS
Chemicals and Reagents
MG132, dimethyl sulfoxide (DMSO), and mouse monoclonal β-actin antibody were purchased from Sigma. MG132 was dissolved in DMSO as 1000-fold concentrations, and the aliquots were stored at −80 C. For cell culture experiments, the DMSO concentration in the medium did not exceed 0.1%. Mouse monoclonal Bmi-1 antibody (ab14389) was from Abcam (Cambridge, MA). Mouse monoclonal antibody specific for Ezh2 (catalog number 612667) was purchased from BD Transduction Laboratories. Rabbit polyclonal H3K27me3 (catalog number 07-449) and mouse monoclonal Suz12 (catalog number 04-046) antibodies were obtained from Upstate Biotech Millipore (Lake Placid, NY). Mouse monoclonal antibody specific for p21Cip1 (sc-6246) was from Santa Cruz Biotechnology (Santa Cruz, CA). Rabbit polyclonal anti-caspase-9 (catalog number 9502) was obtained from Cell Signaling (Danvers, MA). Mouse monoclonal anti-PARP was obtained from BD Pharmingen (catalog number 55494). Horse peroxidase-conjugated secondary antibodies, including sheep anti-mouse IgG (NA931) and donkey anti-rabbit IgG (NA934), were obtained from GE Healthcare.
Cell Cultures
Human squamous cell carcinoma cell line SCC-13 was purchased from American Type Culture Collection (ATCC; Manassas, VA) and cultured in DMEM supplemented with l-glutamine, d-glucose, sodium pyruvate, 100 units/ml penicillin, 100 units/ml streptomycin, and 5% fetal bovine serum (FBS). Statistical difference was determined using the Student's t test.
Proliferation Studies
Cells were seeded at low densities in complete medium and allowed to attach for 24 h. Cells were then treated by the addition of fresh DMEM medium containing increasing MG132 concentrations. After 24 h of treatment, the cells were harvested with 0.025% trypsin, 1 mm EDTA and counted using a coulter counter.
MG132 Treatment and Immunoblot Analysis
Subconfluent SCC-13 cells, growing in DMEM, were treated with MG132 at 0–5.0 μm for 24 h. The cells were then washed in PBS and lysed in 20 mm Tris (pH 7.5) containing 150 mm NaCl, 1 mm EGTA, 1 mm EDTA, 1% Triton X-100, 2.5 mm sodium pyrophosphate, 1 mm glycerophosphate, 1 mm sodium vanadate, 1 μg of leupeptin, and 1 mm phenylmethylsulfonyl fluoride. For immunoprecipitation studies, 50 μg of total protein lysate was incubated in the presence of 1 μg of mouse monoclonal Bmi-1 or Ezh2 antibody for 3 h at 4 °C. Then samples were mixed with 25 μl of protein A/G-agarose beads overnight at 4 °C, and the immunoprecipitate was electrophoresed on a 10% polyacrylamide gel for immunoblot analysis using a rabbit polyclonal anti-ubiquitin antibody (6, 7).
Quantitative PCR
SCC-13 cells were treated with DMSO or MG132 for different time periods. Total DNA-free RNA was extracted (illustra RNAspin mini kit; GE Healthcare) and reverse-transcribed using SuperScript reverse transcriptase and oligo(dT) primers (Qiagen, Valencia, CA). The LightCycler 480 system (Roche Applied Science) was used to measure mRNA level. Primer sequences used to detect proteasome subunits mRNA include PSMA7 (forward, 5′-CTGTGCTTTGGATGACAACG-3′; reverse, 5′-CGATGTAGCGGGTGATGTACT-3′), PSMB4 (forward, 5′-CTCGTTTCCGCAACATCTCT-3′; reverse, 5′-TGTCCATCTCCCAGAAGCTC-3′), PSMB7 (forward, 5′-TGCAAAGAGGGGATACAAGC-3′; reverse, 5′-GCAACAACCATCCCTTCAGT-3′), PSMC1 (forward, 5′-TTCCGAGTTGCTGAAGAACA-3′; reverse, 5′-ATCCATCCAACTGGTTCAGC-3′), PSMD12 (forward, 5′-GTGCGCGACTGACTAAAACA-3′; reverse, 5′-TAGGCAGAGCCTCATTTGCT-3′), and cyclophilin A (forward, 5′-CATCTGCACTGCCAAGACTGA-3′; reverse, 5′-TTCATGCCTTCTTTCACTTTGC-3′) (16).
RNA Interference Studies
SCC-13 cells were harvested in 0.025% trypsin containing 1 mm EDTA and replated in 35-mm dishes in antibiotic-free normal DMEM medium containing 5% FBS. The cells (∼30–40% confluent) were transfected with 3 μg of Nrf1, Nrf2, or scrambled small interfering RNA (siRNA) (Santa Cruz Biotechnology) in serum-free medium using siRNA transfection reagent (Santa Cruz Biotechnology). After 6 h, DMEM containing 10% FBS and 2× antibiotics was added, and at 24 h after transfection, the cells were treated for 24 h with 0 or 2 μm MG132 in DMEM containing 5% FBS and standard antibiotics.
Adenovirus Infection Studies
Adenoviruses were produced and infected as described previously (17, 18). Subconfluent SCC-13 cells were infected with 2.5 multiplicity of infection of tAd5-EV or tAd5-hBmi-1 in the presence of 2.5 multiplicity of infection of Ad5-TA virus in the serum-free DMEM medium containing 6 μg of Polybrene/ml (H9268, Sigma). After 6 h, the DMEM was supplemented with 10% FBS. At 24 h after infection, the virus-containing medium were replaced by fresh DMEM (5% FBS) containing 0 or 2 μm MG132, and the cells were incubated for 24–48 h before cell counting or preparation of cell lysates.
Proteasome Activity Assay
Proteasome activity was measured using a 20 S proteasome activity assay kit (catalog numberAPT280, Chemicon International, Temecula, CA). Subconfluent cells were treated with either DMSO or 3 μm MG132 for different time periods prior to total cell extract preparation. The assay is based on the detection of the fluorophore 7-amino-4-methylcoumarin (AMC) after cleavage from the labeled substrate LLVY-AMC by the 20 S proteasome. Protein lysate (40–50 μg) was incubated with LLVY-AMC at 37 °C for 90 min in assay buffer (25 mm HEPES, pH 7.5, 5 mm EDTA, 0.5% Nonidet P-40, and 0.01% SDS). AMC fluorescence intensity was measured using a 380-nm excitation filter and a 460-nm emission filter in a fluorometer.
RESULTS
MG132 Regulation of PcG Protein Level and Cell Proliferation
Fig. 1, A and B, show an MG132-associated concentration- and time-dependent reduction in Bmi-1 and Ezh2 level. It is surprising that a proteasome inhibitor would reduce Bmi-1 and Ezh2 level as our previous study showed that proteasome activity was required for PcG protein loss in cells treated with cancer preventive agents (6, 7). We therefore initiated studies designed to understand this regulation. One possibility is that MG132 influences PcG protein gene expression. However, this mechanism does not appear likely as MG132 treatment does not significantly alter Bmi-1 and Ezh2 mRNA level (Fig. 1C). An alternate explanation, which would be consistent with our previous result, is that inhibition of proteasome activity increases proteasome function. This is a real possibility as compensatory increase in proteasome activity has been recently described in proteasome inhibitor-treated cells (14, 15). To assess this, we monitored PcG protein ubiquitination status in MG132-treated cells. Total cell extract from MG132-treated SCC-13 cells was used to detect ubiquitin conjugates. Fig. 2A reveals an MG132-dependent increase in ubiquitin conjugation at concentrations of ≥2 μm MG132, and time course studies reveal an increase at 4 h following treatment with 3 μm MG132 (Fig. 2B). To determine whether Bmi-1 and Ezh2 are ubiquitinated, total extracts were immunoprecipitated with anti-Bmi-1 or anti-Ezh2 or normal mouse anti-IgG followed by immunoblot detection of ubiquitin. As shown in Fig. 2C, MG132 treatment caused a substantial increase in Bmi-1 and Ezh2 ubiquitination.
FIGURE 1.
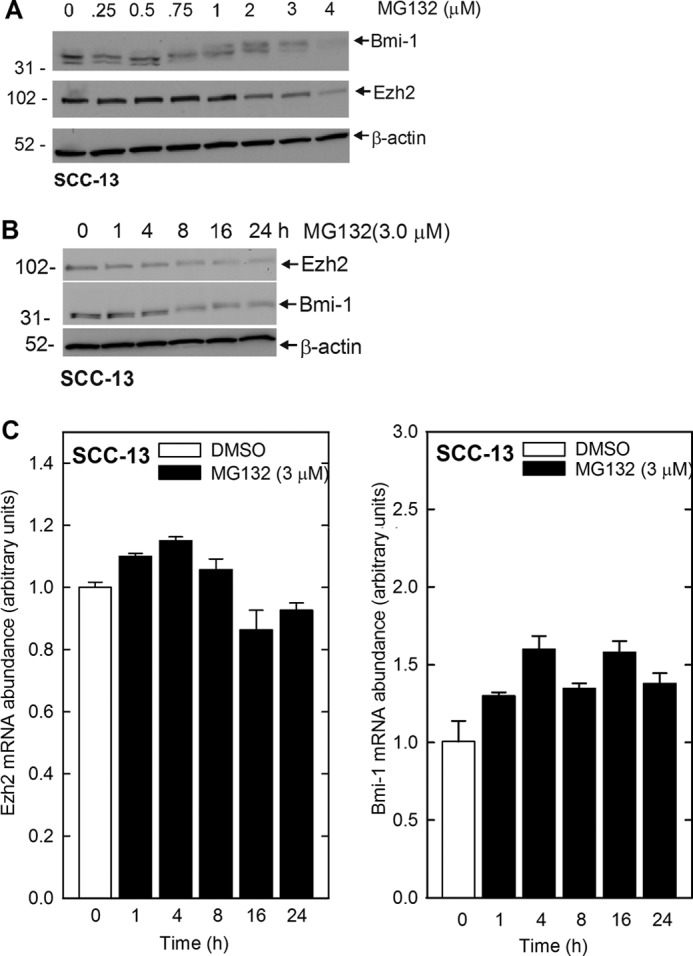
MG132 modulates PcG protein function in SCC-13 cells. A, subconfluent SCC-13 cells were treated in the presence of 0–3 μm MG132 for 24 h. Total cell lysates were then prepared for immunoblot detection of Bmi-1, Ezh2, and β-actin. B, time course of MG132 impact on PcG protein levels. SCC-13 cells were treated with 3 μm MG132 for the indicated times, and the cells were harvested for immunoblot analysis. C, SCC-13 cells were treated with 3 μm MG132 for 0–24 h. Total RNA (1 μg) was prepared for analysis of Bmi-1 and Ezh2 mRNA level by quantitative RT-PCR. Bmi-1 and Ezh2 level is normalized to cyclophilin A. The values are mean ± S.E., n = 3, and no group was significantly different from untreated group shown as the open bar.
FIGURE 2.
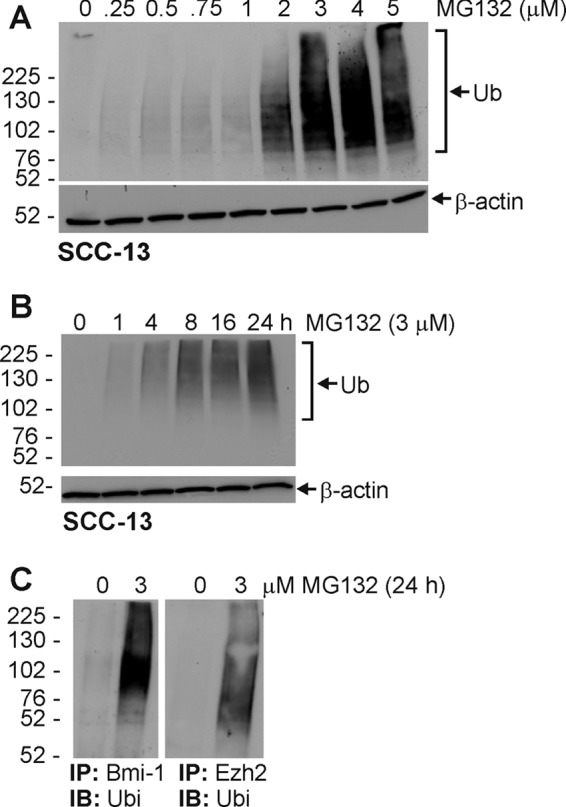
MG132 treatment increases protein ubiquitination. A and B, SCC-13 cells were treated with 0–5 μm for 24 h or 3 μm MG132 for 0–24 h and total cell extracts were prepared to immunoblot with anti-ubiquitin (Ub). β-Actin was used as a loading control. C, MG132 treatment increases ubiquitination (Ubi) of Bmi-1 and Ezh2. Cells were treated with 0 or 3 μm MG132 for 24 h, and extracts were prepared followed by immunoprecipitation (IP) with anti-Bmi-1 or anti-Ezh2 or normal mouse anti-IgG. The precipitate was then electrophoresed on a polyacrylamide gel followed by immunoblot (IB) detection using anti-ubiquitin. Similar results were observed in each of three experiments.
MG132-dependent Regulation of Nrf1/Nrf2
Recent studies indicate that cells can compensate for reduced proteasome activity by increased expression of 26 S proteasome subunit genes leading to increased proteasome formation and activity (14, 15). This increase in subunit gene expression requires the NF-E2-related transcription factors, Nrf1 and Nrf2, which act to increase proteasome subunit gene expression (11–13). We therefore assessed the impact of MG132 treatment on Nrf1 and Nrf2 expression. As shown in Fig. 3A, MG132 concentrations ≥2 μm increase Nrf1 and Nrf2 level, and time-course studies indicate that MG132 treatment increases Nrf1 at 4 h and that the level continues to increase to 24 h (Fig. 3B). Increased Nrf2 is detected at 1 h, and levels peak at 8 h (Fig. 3B). Thus, proteasome inhibitor treatment increases Nrf1 and Nrf2 level.
FIGURE 3.
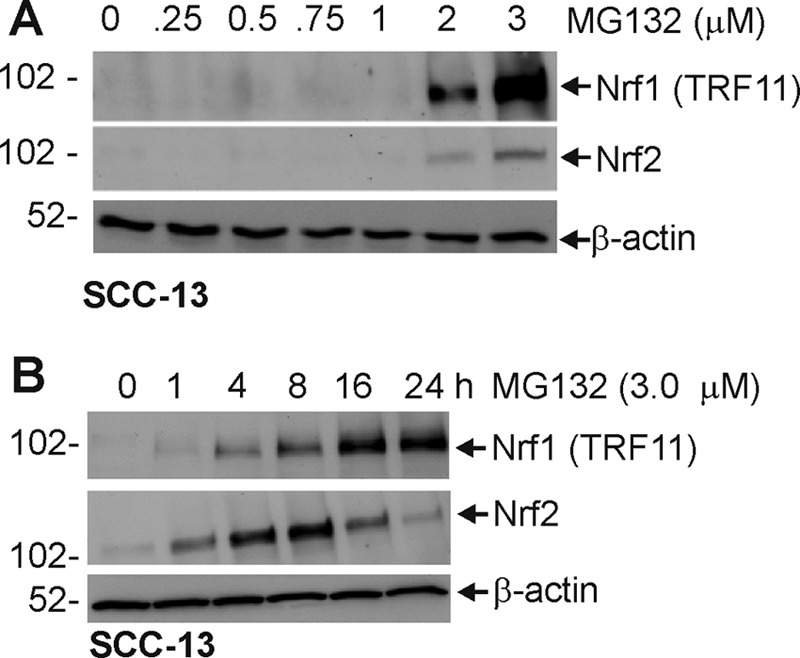
MG132 treatment activates increases Nrf1 and Nrf2 level. A and B, subconfluent cells were treated with 0–3 μm MG132 for 24 h or treated with 3 μm MG132 for 0, 1, 4, 8, 16, and 24 h. Total protein extracts were prepared for electrophoresis on a 10% polyacrylamide gel for immunoblot identification of Nrf1, Nrf2, and β-actin. This experiment is representative of three separate independent experiments.
The fact that Nrf1 and Nrf2 expression is elevated suggests that the proteasome subunit expression may be increased (11–15). We examined this by treating SCC-13 cells with 3 μm MG132 and monitoring proteasome subunit mRNA level at times thereafter. Fig. 4A shows that mRNA encoding the PSMA7, PSMB4, PSMB7, PSMC1, and PSMD12 proteasome subunits is increased and indicates that some are increased in a transient manner (PSMA7, PRMB4, and PSMB7), whereas others (PSMC1 and PSMD12) are stably increased. The increase ranges from 2- to 6-fold depending upon the subunit. Next we determined whether the increase in MG132-dependent proteasome subunit mRNA level is associated with increased proteasome activity. Time-course studies indicate an increase of total proteasome activity at 4 h and a continued increase to 16 h (Fig. 4B). These findings indicate that proteasome inhibitor treatment can result in a compensatory increase in proteasome activity.
FIGURE 4.

MG132 increases the level of mRNA encoding the proteasome subunit proteins. A, SCC-13 cells were treated with 0 (open bars) or 3 μm (closed bars) MG132 for the indicated times. Total RNA was prepared and reverse-transcribed for quantitative PCR analysis. Cyclophilin A was used as control. The mRNA abundance values are mean ± S.E., n = 3. Asterisks indicate a significant increase as compared with the time 0 group (p < 0.05). B, SCC-13 cells were treated without or with 3 μm MG132 for 0–24 h, and total cell lysates was assayed for proteasome activity. Identical results were observed in each of three experiments. The activity values are mean ± S.E., n = 3. Asterisks indicate a significant increase as compared with the time 0 group (p < 0.05).
To study the role of Nrf1 and Nrf2 in this regulation, SCC-13 cells were incubated with Nrf1-specific or Nrf2-specific siRNA and treated with MG132. Fig. 5B shows that siRNA treatment reduces Nrf1 and Nrf2 in an isoform-specific manner. An examination of impact on proteasome subunit mRNA revealed that Nrf1 knockdown completely eliminates the MG132-dependent increase in proteasome subunit expression (Fig. 5A) and that Nrf2 knockdown partially eliminates the response. It is also interesting that basal expression of subunits is not modulated by Nrf1 or Nrf2 knockdown, suggesting that these regulators are involved in the inductive response and not in maintenance of basal expression.
FIGURE 5.

Nrf1 knockdown eliminates MG132-dependent increase in proteasome subunits. A, SCC-13 cells were transfected with Nrf1- or Nrf2-specific or control siRNA. After 24 h, cells were treated with 0 or 2 μm MG132 for 16 h. PSMA7, PSMB4, PSMB4, PSMC1, PSMD12, and cyclophilin A mRNA levels were measured by quantitative RT-PCR. The values are mean ± S.E., n = 3. The single asterisks indicate a significant increase over control (open bar) basal mRNA level. The double asterisks indicate a significant reduction as compared with the MG132-treated control (closed bar) mRNA level (p < 0.05). B, SCC-13 cells were transfected with control or Nrf1- or Nrf2-specific siRNA for 24 h and then treated with 3 μm MG132 for 16 h prior to preparation of cell extracts for immunoblot detection of the indicated proteins. β-Actin was used to normalize protein loading. Similar results were observed in three separate experiments.
We next examined the impact of manipulating Nrf1 and Nrf2 level, whereas inhibiting proteasome activity, on Bmi-1 and Ezh2 level. SCC-13 cells were treated with Nrf1- or Nrf2-specific siRNA in the presence or absence of MG132. As shown in Fig. 6, MG132 treatment increases Nrf1 and Nrf2 level, and this is associated with loss of Bmi-1 and Ezh2. Moreover, Bmi-1 and Ezh2 levels are restored in cells treated with Nrf1-specific siRNA (upper panel). In contrast, Nrf2-specific siRNA is less effective (lower panel). These findings suggest that Nrf1-dependent events (i.e. increased proteasome subunit expression) are required for the loss of PcG proteins in proteasome inhibitor challenged cells.
FIGURE 6.
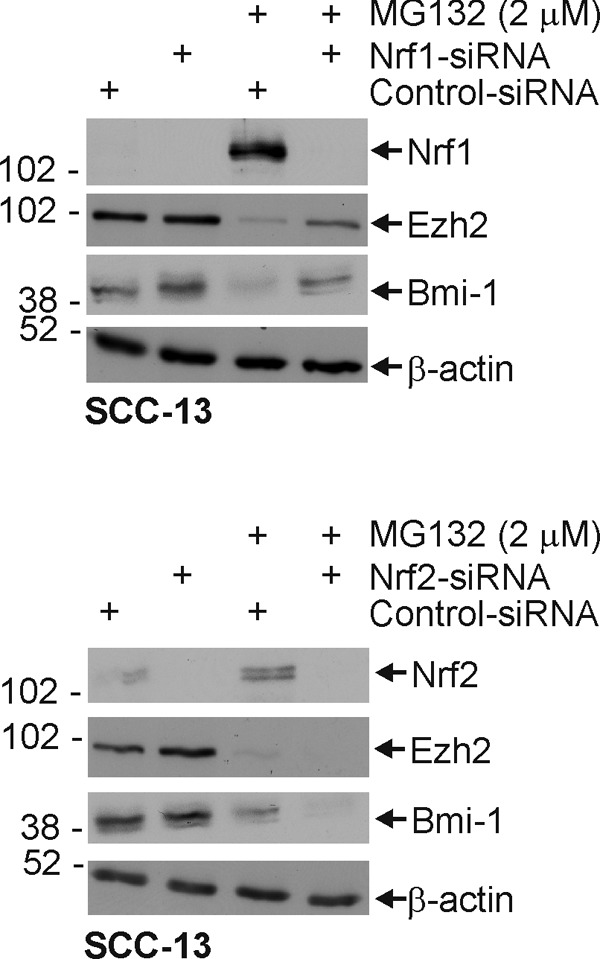
Nrf1 knockdown in SCC-13 cells partially reverses the MG132-dependent reduction in Bmi-1 and Ezh2 protein level. Subconfluent cultures of SCC-13 cells were transfected with either control or Nrf1- or Nrf2-specific siRNA, and after 24 h, they were treated with 0 or 2 μm MG132 for an additional 24 h. Cell lysates were prepared for immunodetection of Nrf1, Nrf2, Bmi-1, Ezh2, and β-actin. Identical results were observed in each of three independent experiments.
Impact of Bmi-1 Overexpression on Response to MG132
We next examined the biological impact of MG132 treatment. As shown in Fig. 7A, treatment with MG132 causes cells to accumulate in the G2/M phase of the cell cycle, and this is associated with a substantial increase in level of the p21Cip1 cyclin-dependent kinase inhibitor (Fig. 7B). In addition to the accumulation of cells in G2/M, there is a substantial increase in sub-G1 DNA content, from 0.3 to 14.6%, suggesting enhanced apoptosis. This is confirmed by an MG132-dependent increase in cleavage of procaspase-9 and PARP (Fig. 7C).
FIGURE 7.
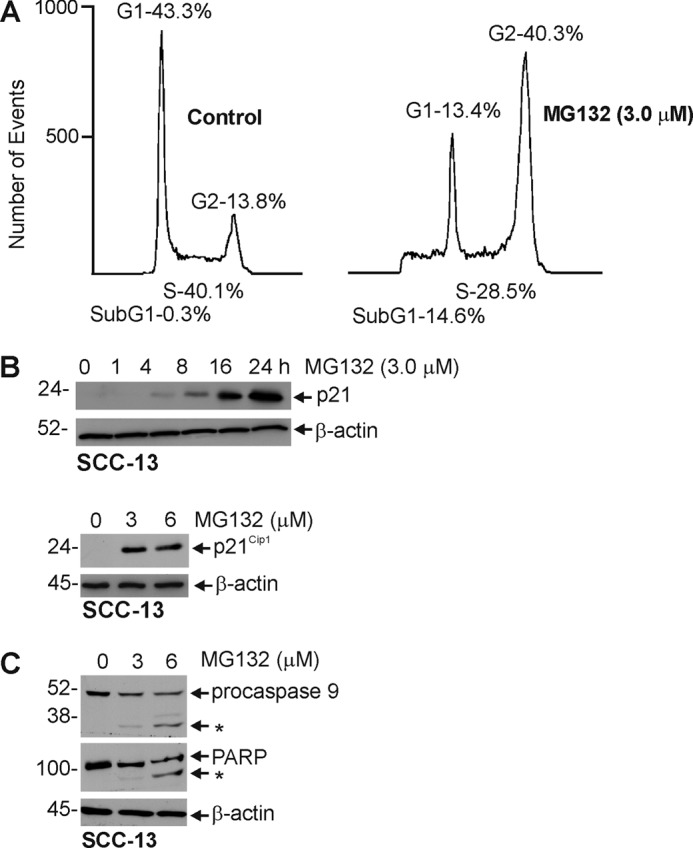
Impact of MG132 on cell cycle and apoptosis. A, SCC-13 cells were treated with 0 or 3 μm MG132 for 24 h, and cells were harvested with 0.025% trypsin, 1 mm EDTA and counted using a coulter counter. B and C, SCC-13 cell were incubated without or with increasing concentrations of MG132 for 24 h or 3 μm MG132 for indicated times. Total cell extracts were prepared and electrophoresed, and procaspase-9 and PARP levels were monitored by immunoblot. β-Actin was used as a loading normalization control. These experiments are representative of three separate experiments.
The above findings suggest that MG132 alters cell cycle progression and promotes apoptosis. A key question is the role of Bmi-1 and Ezh2 in this process. We tested the impact of Bmi-1 on these responses. Bmi-1 is a cell survival protein that is known to reduce expression of tumor suppressor genes (19). As PcG proteins have this prosurvival role, we next determined whether forced expression of Bmi-1 protein could counter the impact of MG132. SCC-13 cells were infected with empty or Bmi-1-encoding adenovirus, and after 24 h, treated with 2 μm MG132 for 48 h. Vector-driven expression of Bmi-1 partially reverses the MG132-dependent reduction in cell number (Fig. 8A) and also the loss of Ezh2 (Fig. 8B). It also suppresses the MG132-associated increase in p21Cip1 level and cleavage of procaspase-9 and PARP (Fig. 8B). In addition, as shown in Fig. 8C, Bmi-1 reverses the MG132-associated change in cell morphology. Thus, PcG protein expression can partially counter the MG132-dependent reduction in cell survival.
FIGURE 8.

Impact of Bmi-1 overexpression on SCC-13 cell response to MG132. A and C, subconfluent SCC-13 cells were infected with 2.5 multiplicity of infection (MOI) of tAd5-EV or tAd5-hBmi-1 in the presence of 2.5 multiplicity of infection of tAd5-TA helper virus. After 24 h, 0 or 2 μm MG132 was added for an additional 48 h, and the cells were then photographed and counted. The cell number values are mean ± S.E., n = 3. The asterisks indicate a significant increase in cell number as compared with control (open bar) (p < 0.05). B, the cells were treated with tAd5-EV or tAd5-hBmi-1 and MG132 as described above, and total cell extracts were prepared for immunoblot analysis of the indicated protein. β-Actin level serves as a loading control.
Impact of Other Proteasome Inhibitors on SCC-13 Cell Proteasome Function
Proteasome inhibitors include peptide aldehydes (MG132), peptide vinyl sulfones, peptide boronates (bortezomib), peptide epoxyketones (epoxomicin), and β-lactones (lactacystin). These are distinguished by different pharmacophores that react with a threonine residue in the proteasome active site (20). To determine whether another proteasome inhibitor can regulate Nrf1 and Nrf2 expression, proteasome subunit expression, and Bmi-1 and Ezh2 degradation, we treated SCC-13 cells with lactacystin for 24 h. Fig. 9A shows that lactacystin treatment increases Nrf1 and Nrf2 level and that this increase is reduced by treatment with specific Nrf1- or Nrf2-specific siRNA. Fig. 9B shows that lactacystin increases the level of mRNA encoding the PSMA7, PSMB4, PSMC1, PSMD12, and PSMB7 proteasome subunits. Moreover, knockdown studies indicate that Nrf1 is required for increased expression of all of these genes, whereas Nrf2 is required for the increased expression of some of them (Fig. 9B). Finally, we show in Fig. 9C that treatment with two inhibitors, bortezomib and lactacystin, reduces Bmi-1 and Ezh2 level. These findings indicate that proteasome inhibitor treatment produces a compensatory increase in proteasome subunit gene expression that requires Nrf1, and in some cases Nrf2, and that the increase in proteasome activity reduces Bmi-1 and Ezh2 levels. Thus, more than one proteasome inhibitor impacts these endpoints.
FIGURE 9.

Lactacystin (LAC) and bortezomib impact on proteasome expression and Bmi-1/Ezh2 level. A, subconfluent SCC-13 cells treated with indicated concentrations of proteasome inhibitor for 24 h. The cells were then harvested, and protein extracts were prepared for immunoblot detection of the indicated proteins. β-Actin level was monitored to normalize protein loading. Similar results were observed in three experiments. B, impact of Nrf1 and Nrf2 knockdown on lactacystin-dependent increase in mRNA encoding proteasome subunits. Subconfluent SCC-13 cells were transfected with 3.0 μg of control or Nrf1- or Nrf2-specific siRNA. After 24 h, the cells were then treated with 0 or 2 μm lactacystin for 16 h before assay of gene expression by quantitative RT-PCR. The values are mean ± S.E., n = 3. The single asterisks indicate a significant increase over control (open bar) basal mRNA level. The double asterisks indicate a significant reduction as compared with the MG132-treated control (closed bar) mRNA level (p < 0.05). C, SCC-13 cells were treated for 24 h with bortezomib or lactacystin, and total extracts were prepared for immunoblot to detect the indicated proteins. Similar results were observed in three separate experiments.
Impact of Proteasome Inhibitors on Other Epidermis-derived Cells
We were curious whether this regulation is also observed in other epidermis-derived cell types, and so we monitored the impact of MG132 treatment on proteasome subunit mRNA level in KERn (normal human keratinocytes), HaCaT (immortalized, but relatively normal keratinocytes), and A431 (transformed keratinocytes) cells. Fig. 10A shows that MG132 treatment increases Nrf1 and Nrf2 level in each cell type and that the increase can be reversed by treating with Nrf1- or Nrf2-specific siRNA. Fig. 10B shows that treatment with 2 μm MG132 for 24 h increases expression of PSMA7, PSMB4, PSMB7, PSMC1, and PSMD12 in each cell type and that the increase is attenuated in the absence of Nrf1. In addition, the increase is attenuated by knockdown of Nrf2, particularly for selected subunit genes, in A431 and HaCaT cells. It is interesting that basal expression for all genes is not impacted by Nrf1 or Nrf2 knockdown (Fig. 10B).
FIGURE 10.

Nrf1 and Nrf2 impact on MG132-induced proteasome subunit expression in normal keratinocytes and A431 and HaCaT cells. A, cells were transfected with 3.0 μg of control or Nrf1- or Nrf2-specific siRNA, and after 24 h, treated with 0 or 2 μm MG132 for an additional 16 h. Cell lysates were prepared for immunodetection of Nrf1, Nrf2, Bmi-1, Ezh2, and β-actin. Similar results were observed in three experiments. B, impact of Nrf1 and Nrf2 knockdown on the MG132-dependent increase in proteasome subunit-encoding mRNA. Subconfluent cells were transfected with 3.0 μg of control, Nrf1-, or Nrf2-specific siRNA. After 24 h, the cells were then treated with 0 or 2 μm lactacystin for 16 h before assay of gene expression by quantitative RT-PCR. The values are mean ± S.E., n = 3. The single asterisks indicate a significant increase over control (open bar) basal mRNA level. The double asterisks indicate a significant reduction as compared with the MG132-treated control (closed bar) mRNA level (p < 0.05).
We also monitored the impact of MG132 on proteasome activity in A431 and HaCaT cells and normal human keratinocytes. Fig. 11 confirms an increase in proteasome activity in each of these cell types.
FIGURE 11.
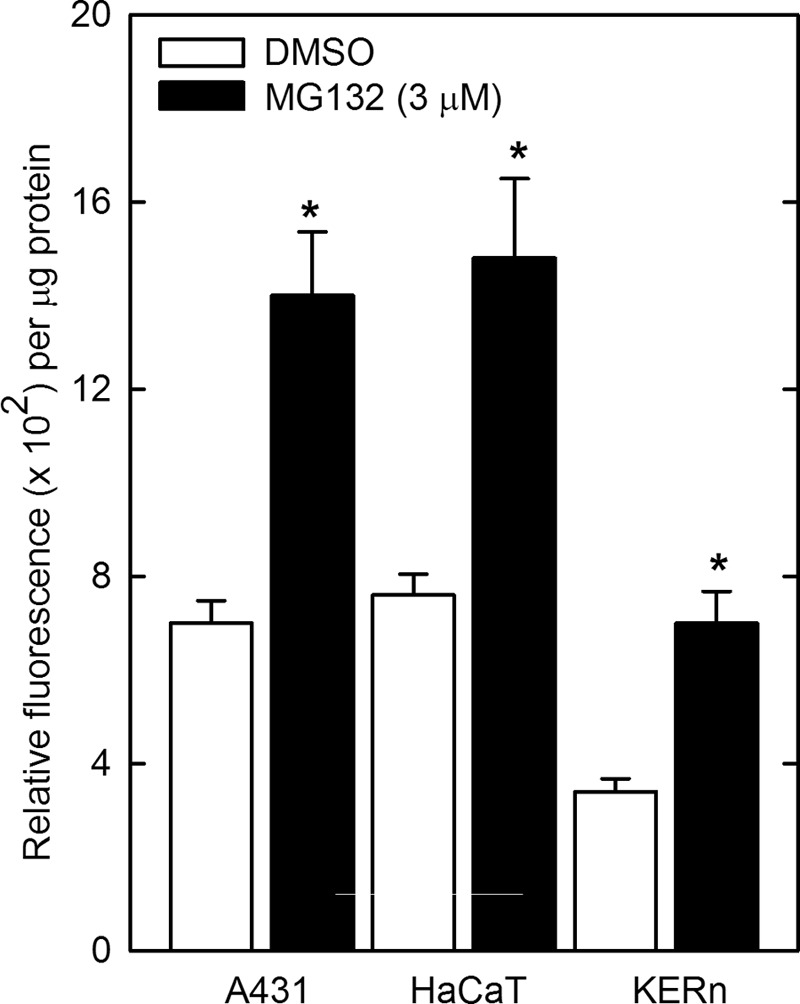
MG132 increases proteasome activity in A431, HaCaT, and normal keratinocytes. Cells were plated at subconfluent density, allowed to attach 24 h, and treated with 3 μm MG132 or DMSO for 16 h. Total cell extracts were prepared for proteasome activity assay. The activity values are mean ± S.E., n = 3. Asterisks indicate a significant increase as compared with the time 0 group (p < 0.05).
DISCUSSION
Polycomb Group Proteins in Skin Cancer
The polycomb genes are key regulators of cell survival that suppress expression of genes that cause terminal differentiation, apoptosis, and cessation of cell proliferation by creating regions of compressed chromatin (1). The mechanism involves two polycomb repressive complexes, PRC2 and PRC1, which act sequentially. A key protein of the PRC2 complex is the Ezh2 catalytic subunit, a methyltransferase that trimethylates lysine 27 of histone H3 (H3K27me3) (1). The PRC1 complex consists of four subunits including Ring1B, Bmi-1, polyhomeotic homolog 1, and CBX (1). CBX binds to H3K27me3 to anchor the PRC1 complex to chromatin (10), and the catalytic subunit, Ring1B, ubiquitinates H2AK119. Ring1B activity is optimal when associated with Bmi-1 (21). These events ultimately lead to suppression of gene expression.
Bmi-1 and Ezh2 overexpression is observed in a host of cancers and is associated with poor prognosis and enhanced oncogenic potential (22). Ezh2, for example, is overexpressed in bladder, prostate, breast, colorectal, and oral squamous cell carcinoma (23–31).
Role of Proteasome in Regulating PcG Protein Level
PcG protein level is reduced in skin cancer cells treated with cancer prevention agents, and this is associated with PcG protein ubiquitination, suggesting that the loss is mediated via the proteasome (6). To expand on these studies, we examined the impact of MG132 on PcG protein level. We had expected that treatment with proteasome inhibitor would preserve PcG protein level, but to our surprise, MG132 treatment reduced Bmi-1 and Ezh2 level. Mechanistic studies reveal that MG132 treatment does not alter the level of Bmi-1- or Ezh2-encoding mRNA. However, MG132 treatment does cause a substantial increase in general protein ubiquitination and ubiquitination of Bmi-1 and Ezh2.
Recent studies describe elevated proteasome synthesis and activity in Drosophila, yeast, and human cells treated with proteasome inhibitors (14, 32–34). This compensatory increase is also observed when the level of one of the proteasome subunits, PSMD4, is reduced in level using siRNA (32). The proteasome inhibitor-associated increase in proteasome subunit expression is absent in Nrf1-null cells (14) and cells treated with Nrf1 siRNA, but not in cells lacking Nrf2 (14, 15), suggesting that the Nrf1 transcription factor drives the increase in subunit protein expression that ultimately leads to increased proteasome activity.
Our present study indicates that proteasome inhibitor treatment of SCC-13 cells increases Nrf1 and Nrf2 level and that this is associated with increased expression of proteasome subunit-encoding mRNAs. The 20 S proteasome core structure features four stacked rings, each of which is made of seven distinct subunits. The α subunit proteins, encoded by the PSMA1–PSMA7 genes, make up the outer proteasome rings, whereas the inner rings are composed of the β subunits encoded by the PSMB1–PSMB7 genes (35). The 20 S core is capped by base and lid complexes (36). The base is encoded by six ATPase genes (PSMC1–PSMC6) and three non-ATPase genes (PSMD1, PSMD2, and PSMD4), and non-ATPase subunits, encoded by genes PSMD3, PSMD6–9, and PSMD11–14, form the lid (37). Our studies show that MG132 treatment increases the level of mRNA encoding representative members of each class of subunits (i.e., PSMA7, PSMB4/PSMB7, PSMC1, and PSMD12), suggesting that MG132 produces a general increase in proteasome subunit gene expression. Subunit mRNA expression increases from 2- to 6-fold depending upon the subunit. An important finding is that knockdown of Nrf1 level eliminates the MG132-dependent increase in subunit mRNA. Moreover, this response is observed for all subunits tested, suggesting that the increase in Nrf1 expression drives the increase in all of the proteasome genes. This finding is consistent with recent studies suggesting that Nrf1 drives stress-induced increased expression of the proteasome subunits, leading to increased proteasome-associated proteolysis (14, 32–34). However, we also observe a role for Nrf2 as Nrf2 knockdown partially attenuated the MG132-dependent increase in expression of some of the subunit genes (i.e. PSMC1 and PSMD12).
In addition to MG132, we also examine the impact of other proteasome inhibitors (i.e. lactacystin and bortezomib) on Nrf1 and Nrf2, proteasome subunit, and Bmi-1 and Ezh2 level. We conclude that, like MG132, these inhibitors increase Nrf1/Nrf2 and proteasome subunit expression and reduce Bmi-1/Ezh2 level. These findings strongly suggest that reduced proteasome activity leads to increased Nrf1 (and Nrf2) expression and that Nrf1 (and Nrf2) increase proteasome subunit gene transcription. Increased subunit production ultimately restores and increases proteasome activity, which ultimately leads to a reduction in Bmi-1 and Ezh2 expression.
Impact of Loss of PcG Protein Expression
We further show that treatment with proteasome inhibitor reduces cell proliferation, as demonstrated by an accumulation of cells in G2/M and increased p21Cip1 level. We also show a proteasome inhibitor-associated increase in apoptosis, as evidenced by accumulation of subG1 DNA content and increased procaspase-9 and PARP cleavage. Because is it likely that many changes occur in proteasome inhibitor-treated cells, we assessed whether loss of PcG expression was a key event related to loss of cell survival potential. These experiments show that forced expression of Bmi-1 attenuates the MG132-associated reduction in cell survival and that this is associated with a Bmi-1-dependent suppression of p21Cip1 level and inhibition of procaspase-9 and PARP cleavage. These findings suggest that loss of Bmi-1 is essential for the full impact of MG132.
PcG Genes in Epidermal Squamous Cell Carcinoma and Role as Cancer Prevention Targets
PcG proteins have an important prosurvival role in epidermis, and Bmi-1 and Ezh2 expression is markedly elevated in epidermal squamous cell carcinoma (10). As such, the PcG proteins are important chemopreventive targets (10). Indeed, treating keratinocyte with cancer prevention agents reduces PcG protein expression. Treatment with (−)-epigallocatechin-3-gallate (EGCG), a major bioactive chemopreventive agent in green tea (38), reduces Bmi-1 level in keratinocytes (9, 39). This reduction is associated with reduced cell survival and proliferation and reduced cyclin and cyclin-dependent kinase level. In addition, EGCG treatment reduces the level of the PRC2 complex proteins, Ezh2 and Suz12, and reduces H3K27me3 formation (9). These findings indicate that treatment with EGCG reduces the level and function of both the PRC2 and the PRC1 complexes. Sulforaphane is another important cancer prevention agent (40–42). Topical application of sulforaphane-containing broccoli sprout extract protects against UVB-induced skin carcinogenesis in SKH-1 mice (43). SFN also inhibits 7,12-dimethylbenz(a)anthracene/12-O-tetradecanoylphorbol-13-acetate-induced cancer in C57BL/6 mice (44). Our studies show that SFN treatment reduces Bmi-1 and Ezh2 level in skin cancer cells and that this is associated with reduced H3K27me3 formation, accumulation of cells in G2/M, loss of cyclins and cyclin-dependent kinases, accumulation of cdk inhibitors, and enhanced apoptosis (6). An important feature of this regulation is that SFN and EGCG reduce Bmi-1 and Ezh2 level via a proteasome-dependent mechanism. This is evidenced by the fact that both Bmi-1 and Ezh2 are ubiquitinated in SFN- and EGCG-treated cells and is inhibited by low levels of lactacystin (6, 9, 39). Proteasome inhibitors are also important anticancer agents that are presently in clinical trials and have been used extensively to treat multiple myeloma (45–48). An interesting feature of these agents, as compared with the chemopreventive agent, SFN, is that both induce proteasome-dependent degradation of Bmi-1 and Ezh2, and this is associated with similar changes in cell cycle and apoptosis regulation and accumulation of cells in G2/M. This suggests that increased proteasome activity may be the common facilitator of both responses. It is also of interest that forced expression of Bmi-1 attenuates the response to SFN and MG132, suggesting that Bmi-1-dependent epigenetic change antagonizes the action of these agents. However, we also note that Bmi-1 overexpression does not overcome the impact of treatment with elevated levels of MG132 (greater than 3 μm, not shown). This suggests, as expected, that the proteasome is affecting numerous processes, of which reduction of Bmi-1 level is only one. These studies suggest that co-treatment with proteasome inhibitor and green tea polyphenol or SFN may produce an enhanced cell death phenotype via action to increase proteasome-dependent loss of prosurvival regulators.
Universality of the Proteasome Compensatory Response
A feature of cell function that is increasingly appreciated is that proteasome function is necessary for cell function and survival. Thus, reducing basal proteasome activity is expected to drive a compensatory increase in proteasome activity as cells attempt to restore basal proteasome function. We show in the present study that treatment with proteasome inhibitor activates Nrf1 expression, which leads to increased proteasome subunit production and increased proteasome activity. We do not anticipate that this is unique to the particular cell types we are using as two previous studies describe activation of proteasome activity in response to treatment with proteasome inhibitor (14, 15). For example, Steffen et al. (15) showed that treatment of human Ea.hy926 and CRL2429 cells with proteasome inhibitor triggers accumulation of damaged proteins in the cells, which leads to nuclear accumulation of Nrf1, where it activates proteasome gene expression, leading to enhanced proteasome activity. It is possible that altered redox state and accumulation of mutant proteins are the trigger for Nrf1 accumulation in their system. It is likely that increased proteasome subunit synthesis is a common cellular response to inhibition of proteasome function in most and perhaps all cell types. We do not presently know what induces Nrf1 level in keratinocytes, but it is possible that it is due to accumulation of mutant proteins, which leads to Nrf1 production and stimulation of proteasome subunit synthesis. Additional studies will be required to assess this possibility.
This work was supported, in whole or in part, by National Institutes of Health Grants R01 AR053851 and R01 CA131074 (to R. L. E.).
- PcG
- polycomb group
- Bmi-1
- B-cell-specific Moloney murine leukemia virus integration site 1
- hBmi-1
- human Bmi-1
- Ezh2
- enhancer of zeste homolog 2
- H3K27me3
- histone H3 lysine 27 trimethylation
- Nrf1
- nuclear factor erythroid-derived 2-related factor 1
- CBX
- chromobox homolog
- SFN
- sulforaphane
- PARP
- poly(ADP-ribose) polymerase-2
- EGCG
- (−)-epigallocatechin-3-gallate
- DMSO
- dimethyl sulfoxide
- AMC
- 7-amino-4-methylcoumarin.
REFERENCES
- 1. Simon J. A., Kingston R. E. (2009) Mechanisms of polycomb gene silencing: knowns and unknowns. Nat. Rev. Mol. Cell Biol. 10, 697–708 [DOI] [PubMed] [Google Scholar]
- 2. Simon J. A., Lange C. A. (2008) Roles of the EZH2 histone methyltransferase in cancer epigenetics. Mutat. Res. 647, 21–29 [DOI] [PubMed] [Google Scholar]
- 3. Cao R., Zhang Y. (2004) The functions of E(Z)/EZH2-mediated methylation of lysine 27 in histone H3. Curr. Opin. Genet. Dev. 14, 155–164 [DOI] [PubMed] [Google Scholar]
- 4. Pasini D., Bracken A. P., Jensen M. R., Lazzerini Denchi E., Helin K. (2004) Suz12 is essential for mouse development and for EZH2 histone methyltransferase activity. EMBO J. 23, 4061–4071 [DOI] [PMC free article] [PubMed] [Google Scholar]
- 5. Hatano A., Matsumoto M., Higashinakagawa T., Nakayama K. I. (2010) Phosphorylation of the chromodomain changes the binding specificity of Cbx2 for methylated histone H3. Biochem. Biophys. Res. Commun. 397, 93–99 [DOI] [PubMed] [Google Scholar]
- 6. Balasubramanian S., Chew Y. C., Eckert R. L. (2011) Sulforaphane suppresses polycomb group protein level via a proteasome-dependent mechanism in skin cancer cells. Mol. Pharmacol. 80, 870–878 [DOI] [PMC free article] [PubMed] [Google Scholar]
- 7. Choudhury S. R., Balasubramanian S., Chew Y. C., Han B., Marquez V. E., Eckert R. L. (2011) (−)-Epigallocatechin-3-gallate and DZNep reduce polycomb protein level via a proteasome-dependent mechanism in skin cancer cells. Carcinogenesis 32, 1525–1532 [DOI] [PMC free article] [PubMed] [Google Scholar]
- 8. Balasubramanian S., Lee K., Adhikary G., Gopalakrishnan R., Rorke E. A., Eckert R. L. (2008) The Bmi-1 polycomb group gene in skin cancer: regulation of function by (−)-epigallocatechin-3-gallate. Nutr. Rev. 66, Suppl. 1, S65–S68 [DOI] [PMC free article] [PubMed] [Google Scholar]
- 9. Balasubramanian S., Adhikary G., Eckert R. L. (2010) The Bmi-1 polycomb protein antagonizes the (−)-epigallocatechin-3-gallate-dependent suppression of skin cancer cell survival. Carcinogenesis 31, 496–503 [DOI] [PMC free article] [PubMed] [Google Scholar] [Retracted]
- 10. Eckert R. L., Adhikary G., Rorke E. A., Chew Y. C., Balasubramanian S. (2011) Polycomb group proteins are key regulators of keratinocyte function. J. Invest. Dermatol. 131, 295–301 [DOI] [PMC free article] [PubMed] [Google Scholar]
- 11. Kwak M. K., Cho J. M., Huang B., Shin S., Kensler T. W. (2007) Role of increased expression of the proteasome in the protective effects of sulforaphane against hydrogen peroxide-mediated cytotoxicity in murine neuroblastoma cells. Free Radic. Biol. Med. 43, 809–817 [DOI] [PubMed] [Google Scholar]
- 12. Kwak M. K., Wakabayashi N., Greenlaw J. L., Yamamoto M., Kensler T. W. (2003) Antioxidants enhance mammalian proteasome expression through the Keap1-Nrf2 signaling pathway. Mol. Cell Biol. 23, 8786–8794 [DOI] [PMC free article] [PubMed] [Google Scholar]
- 13. Kwak M. K., Kensler T. W. (2010) Targeting NRF2 signaling for cancer chemoprevention. Toxicol. Appl. Pharmacol. 244, 66–76 [DOI] [PMC free article] [PubMed] [Google Scholar]
- 14. Radhakrishnan S. K., Lee C. S., Young P., Beskow A., Chan J. Y., Deshaies R. J. (2010) Transcription factor Nrf1 mediates the proteasome recovery pathway after proteasome inhibition in mammalian cells. Mol. Cell 38, 17–28 [DOI] [PMC free article] [PubMed] [Google Scholar]
- 15. Steffen J., Seeger M., Koch A., Krüger E. (2010) Proteasomal degradation is transcriptionally controlled by TCF11 via an ERAD-dependent feedback loop. Mol. Cell 40, 147–158 [DOI] [PubMed] [Google Scholar]
- 16. Chew Y. C., Adhikary G., Wilson G. M., Reece E. A., Eckert R. L. (2011) Protein kinase C (PKC) δ suppresses keratinocyte proliferation by increasing p21Cip1 level by a KLF4 transcription factor-dependent mechanism. J. Biol. Chem. 286, 28772–28782 [DOI] [PMC free article] [PubMed] [Google Scholar] [Retracted]
- 17. Jans R., Sturniolo M. T., Eckert R. L. (2008) Localization of the TIG3 transglutaminase interaction domain and demonstration that the amino-terminal region is required for TIG3 function as a keratinocyte differentiation regulator. J. Invest. Dermatol. 128, 517–529 [DOI] [PubMed] [Google Scholar]
- 18. Sturniolo M. T., Chandraratna R. A., Eckert R. L. (2005) A novel transglutaminase activator forms a complex with type 1 transglutaminase. Oncogene. 24, 2963–2972 [DOI] [PubMed] [Google Scholar]
- 19. Bracken A. P., Kleine-Kohlbrecher D., Dietrich N., Pasini D., Gargiulo G., Beekman C., Theilgaard-Mönch K., Minucci S., Porse B. T., Marine J. C., Hansen K. H., Helin K. (2007) The Polycomb group proteins bind throughout the INK4A-ARF locus and are disassociated in senescent cells. Genes Dev. 21, 525–530 [DOI] [PMC free article] [PubMed] [Google Scholar]
- 20. Di Fiore B., Ciciarello M., Mangiacasale R., Palena A., Tassin A. M., Cundari E., Lavia P. (2003) Mammalian RanBP1 regulates centrosome cohesion during mitosis. J. Cell Sci. 116, 3399–3411 [DOI] [PubMed] [Google Scholar]
- 21. Li Z., Cao R., Wang M., Myers M. P., Zhang Y., Xu R. M. (2006) Structure of a Bmi-1-Ring1B polycomb group ubiquitin ligase complex. J. Biol. Chem. 281, 20643–20649 [DOI] [PubMed] [Google Scholar]
- 22. Mills A. A. (2010) Throwing the cancer switch: reciprocal roles of polycomb and trithorax proteins. Nat. Rev. Cancer 10, 669–682 [DOI] [PMC free article] [PubMed] [Google Scholar]
- 23. Bachmann I. M., Halvorsen O. J., Collett K., Stefansson I. M., Straume O., Haukaas S. A., Salvesen H. B., Otte A. P., Akslen L. A. (2006) EZH2 expression is associated with high proliferation rate and aggressive tumor subgroups in cutaneous melanoma and cancers of the endometrium, prostate, and breast. J. Clin. Oncol. 24, 268–273 [DOI] [PubMed] [Google Scholar]
- 24. Collett K., Eide G. E., Arnes J., Stefansson I. M., Eide J., Braaten A., Aas T., Otte A. P., Akslen L. A. (2006) Expression of enhancer of zeste homologue 2 is significantly associated with increased tumor cell proliferation and is a marker of aggressive breast cancer. Clin. Cancer Res. 12, 1168–1174 [DOI] [PubMed] [Google Scholar]
- 25. Breuer R. H., Snijders P. J., Smit E. F., Sutedja T. G., Sewalt R. G., Otte A. P., van Kemenade F. J., Postmus P. E., Meijer C. J., Raaphorst F. M. (2004) Increased expression of the EZH2 polycomb group gene in BMI-1-positive neoplastic cells during bronchial carcinogenesis. Neoplasia. 6, 736–743 [DOI] [PMC free article] [PubMed] [Google Scholar]
- 26. Kim J. H., Yoon S. Y., Kim C. N., Joo J. H., Moon S. K., Choe I. S., Choe Y. K., Kim J. W. (2004) The Bmi-1 oncoprotein is overexpressed in human colorectal cancer and correlates with the reduced p16INK4a/p14ARF proteins. Cancer Lett. 203, 217–224 [DOI] [PubMed] [Google Scholar]
- 27. Kim J. H., Yoon S. Y., Jeong S. H., Kim S. Y., Moon S. K., Joo J. H., Lee Y., Choe I. S., Kim J. W. (2004) Overexpression of Bmi-1 oncoprotein correlates with axillary lymph node metastases in invasive ductal breast cancer. Breast 13, 383–388 [DOI] [PubMed] [Google Scholar]
- 28. Vonlanthen S., Heighway J., Altermatt H. J., Gugger M., Kappeler A., Borner M. M., van Lohuizen M., Betticher D. C. (2001) The bmi-1 oncoprotein is differentially expressed in non-small cell lung cancer and correlates with INK4A-ARF locus expression. Br. J. Cancer 84, 1372–1376 [DOI] [PMC free article] [PubMed] [Google Scholar]
- 29. Weikert S., Christoph F., Köllermann J., Müller M., Schrader M., Miller K., Krause H. (2005) Expression levels of the EZH2 polycomb transcriptional repressor correlate with aggressiveness and invasive potential of bladder carcinomas. Int. J. Mol. Med. 16, 349–353 [PubMed] [Google Scholar]
- 30. Mimori K., Ogawa K., Okamoto M., Sudo T., Inoue H., Mori M. (2005) Clinical significance of enhancer of zeste homolog 2 expression in colorectal cancer cases. Eur. J. Surg. Oncol. 31, 376–380 [DOI] [PubMed] [Google Scholar]
- 31. Kidani K., Osaki M., Tamura T., Yamaga K., Shomori K., Ryoke K., Ito H. (2009) High expression of EZH2 is associated with tumor proliferation and prognosis in human oral squamous cell carcinomas. Oral Oncol. 45, 39–46 [DOI] [PubMed] [Google Scholar]
- 32. Lundgren J., Masson P., Mirzaei Z., Young P. (2005) Identification and characterization of a Drosophila proteasome regulatory network. Mol. Cell Biol. 25, 4662–4675 [DOI] [PMC free article] [PubMed] [Google Scholar]
- 33. Meiners S., Heyken D., Weller A., Ludwig A., Stangl K., Kloetzel P. M., Krüger E. (2003) Inhibition of proteasome activity induces concerted expression of proteasome genes and de novo formation of mammalian proteasomes. J. Biol. Chem. 278, 21517–21525 [DOI] [PubMed] [Google Scholar]
- 34. Mitsiades N., Mitsiades C. S., Poulaki V., Chauhan D., Fanourakis G., Gu X., Bailey C., Joseph M., Libermann T. A., Treon S. P., Munshi N. C., Richardson P. G., Hideshima T., Anderson K. C. (2002) Molecular sequelae of proteasome inhibition in human multiple myeloma cells. Proc. Natl. Acad. Sci. U.S.A. 99, 14374–14379 [DOI] [PMC free article] [PubMed] [Google Scholar]
- 35. Unno M., Mizushima T., Morimoto Y., Tomisugi Y., Tanaka K., Yasuoka N., Tsukihara T. (2002) The structure of the mammalian 20 S proteasome at 2.75 Ä resolution. Structure. 10, 609–618 [DOI] [PubMed] [Google Scholar]
- 36. Glickman M. H., Rubin D. M., Coux O., Wefes I., Pfeifer G., Cjeka Z., Baumeister W., Fried V. A., Finley D. (1998) A subcomplex of the proteasome regulatory particle required for ubiquitin-conjugate degradation and related to the COP9-signalosome and eIF3. Cell 94, 615–623 [DOI] [PubMed] [Google Scholar]
- 37. Finley D. (2009) Recognition and processing of ubiquitin-protein conjugates by the proteasome. Annu. Rev. Biochem. 78, 477–513 [DOI] [PMC free article] [PubMed] [Google Scholar]
- 38. Ahmad N., Mukhtar H. (1999) Green tea polyphenols and cancer: biologic mechanisms and practical implications. Nutr. Rev. 57, 78–83 [DOI] [PubMed] [Google Scholar]
- 39. Lee K., Adhikary G., Balasubramanian S., Gopalakrishnan R., McCormick T., Dimri G. P., Eckert R. L., Rorke E. A. (2008) Expression of Bmi-1 in epidermis enhances cell survival by altering cell cycle regulatory protein expression and inhibiting apoptosis. J. Invest. Dermatol. 128, 9–17 [DOI] [PMC free article] [PubMed] [Google Scholar]
- 40. Singh S. V., Srivastava S. K., Choi S., Lew K. L., Antosiewicz J., Xiao D., Zeng Y., Watkins S. C., Johnson C. S., Trump D. L., Lee Y. J., Xiao H., Herman-Antosiewicz A. (2005) Sulforaphane-induced cell death in human prostate cancer cells is initiated by reactive oxygen species. J. Biol. Chem. 280, 19911–19924 [DOI] [PubMed] [Google Scholar]
- 41. Myzak M. C., Tong P., Dashwood W. M., Dashwood R. H., Ho E. (2007) Sulforaphane retards the growth of human PC-3 xenografts and inhibits HDAC activity in human subjects. Exp. Biol. Med. (Maywood) 232, 227–234 [PMC free article] [PubMed] [Google Scholar]
- 42. Myzak M. C., Dashwood W. M., Orner G. A., Ho E., Dashwood R. H. (2006) Sulforaphane inhibits histone deacetylase in vivo and suppresses tumorigenesis in Apcmin mice. FASEB J. 20, 506–508 [DOI] [PMC free article] [PubMed] [Google Scholar]
- 43. Dinkova-Kostova A. T., Jenkins S. N., Fahey J. W., Ye L., Wehage S. L., Liby K. T., Stephenson K. K., Wade K. L., Talalay P. (2006) Protection against UV-light-induced skin carcinogenesis in SKH-1 high-risk mice by sulforaphane-containing broccoli sprout extracts. Cancer Lett. 240, 243–252 [DOI] [PubMed] [Google Scholar]
- 44. Xu C., Huang M. T., Shen G., Yuan X., Lin W., Khor T. O., Conney A. H., Kong A. N. (2006) Inhibition of 7,12-dimethylbenz(a)anthracene-induced skin tumorigenesis in C57BL/6 mice by sulforaphane is mediated by nuclear factor E2-related factor 2. Cancer Res. 66, 8293–8296 [DOI] [PubMed] [Google Scholar]
- 45. Laubach J., Richardson P., Anderson K. (2011) Multiple myeloma. Annu. Rev. Med. 62, 249–264 [DOI] [PubMed] [Google Scholar]
- 46. Lancet J. E., Duong V. H., Winton E. F., Stuart R. K., Burton M., Zhang S., Cubitt C., Blaskovich M. A., Wright J. J., Sebti S., Sullivan D. M. (2011) A phase I clinical-pharmacodynamic study of the farnesyltransferase inhibitor tipifarnib in combination with the proteasome inhibitor bortezomib in advanced acute leukemias. Clin. Cancer Res. 17, 1140–1146 [DOI] [PMC free article] [PubMed] [Google Scholar]
- 47. Chen D., Frezza M., Schmitt S., Kanwar J., Dou Q. P. (2011) Bortezomib as the first proteasome inhibitor anticancer drug: current status and future perspectives. Curr. Cancer Drug Targets. 11, 239–253 [DOI] [PMC free article] [PubMed] [Google Scholar]
- 48. Ling S. C., Lau E. K., Al-Shabeeb A., Nikolic A., Catalano A., Iland H., Horvath N., Ho P. J., Harrison S., Fleming S., Joshua D. E., Allen J. D. (2012) Response of myeloma to the proteasome inhibitor bortezomib is correlated with the unfolded protein response regulator XBP-1. Haematologica 97, 64–72 [DOI] [PMC free article] [PubMed] [Google Scholar]