Abstract
Mobile technologies provide unique opportunities for ubiquitous distribution of scientific information through user-friendly interfaces. Therefore, we have developed a new FlyExpress mobile application that makes available a growing collection (>100 000) of standardized in situ hybridization images containing spatial patterns of gene expression from Drosophila melanogaster (fruit fly) embryogenesis. Using this application, scientists can visualize and compare expression patterns of >4000 developmentally relevant genes. The FlyExpress app displays the expression patterns of the selected gene for different visual projections (e.g. lateral) and displays them according to their developmental stages, which shows a gene’s progression of spatial expression over developmental time. Ultimately, we envision the use of FlyExpress app in the laboratory where scientists may wish to immediately conduct a visual comparison of a known expression pattern with the one observed on the bench top or to display expression patterns of interest during scientific discussions at large.
Availability: Search “FlyExpress” on the Apple iTunes store
Contact: s.kumar@asu.edu
Ubiquitous access to information has become a part of everyday life in commercial and personal spheres. However, access to a vast majority of the scientific knowledge is primarily restricted to complex websites that frequently require the use of desktop computers. Today, the need to access primary scientific data and results extends far beyond personal desktops, as the scientific data and knowledge are needed on-the-go not only during scientific discussions outside of a formal meeting setting, but also on the laboratory benches that are not always equipped with general personal desktop computers. At these venues, mobile devices, such as smartphones, are always at hand and present a medium for effective access to information to accelerate discovery and enrich discussion.
Applications developed for mobile devices serve as a new window to disseminate existing data, and they represent an alternative to traditional software technology. Mobile applications compel developers to focus on specific data cross-sections, which simplifies data and user navigation for even non-experts (e.g., Kumar and Hedges, 2011; James et al., 2012). One may argue that the use of personal devices to deliver scientific knowledge to experts and non-experts is the next frontier to disseminate information in this age of digital biology.
Therefore, we have developed a new mobile application for the iPhone to access images capturing spatial patterns of gene expression during the development of an embryo in the fruit fly. Our application uses the large digital library of expression patterns available in the FlyExpress resource (Kumar et al., 2011). In the first version, we provide spatial patterns in the FlyExpress resource, from high throughput studies: 48 190 images from Berkeley Drosophila Genome Project (BDGP data) and 30 095 images from Fly-FISH resource data (Lécuyer et al., 2007; Tomancak et al., 2002). These data capture the spatial patterns of thousands of genes (Konikoff et al., 2012).
In FlyExpress, all original expression images from BDGP and Fly-FISH resources have been size standardized and aligned, which is necessary for their developmental comparison (Kumar et al., 2011; Konikoff et al., 2012). In addition, FlyExpress makes available information on the anatomical view of each image as well as the developmental stage annotations. Easy access and exploration of all of these data are available at the user’s fingertips as soon they download the FlyExpress application from the Apple iTunes store.
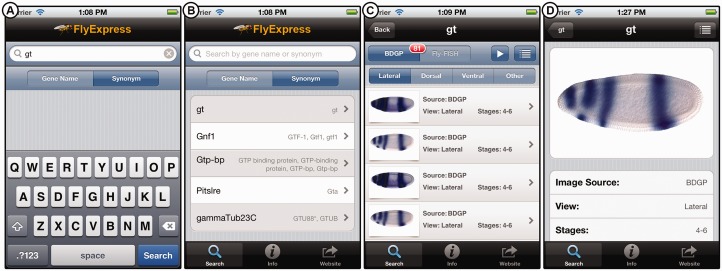
Once downloaded, a user launches the application where they are presented with the main screen that has a gene name search bar, where the user submits a query to the main FlyExpress database. In addition, the user has the option for querying based on a gene name synonym, such as ‘giant’ (Fig. 1A). In both cases, the user is presented with a list of related gene names (Fig. 1B).
Fig. 1.
(A) The FlyExpess app interface showing the search screen. (B) A list of (partially) matching gene names based on the user’s query. The results will also contain associated gene synonyms displayed on the right if the user elects to query using a synonym. (C) An array of expression patterns gene thumbnails list. The user can select to display BDGP (or Fly-FISH, when available) images and view the results by selecting the desired visual projection. The red notification badge gives the number of images available. (D) Detailed view of a selected individual embryo image
Selecting a gene of interest by tapping the row produces a list of embryo expression patterns image thumbnails (Fig. 1C), The embryo image are sorted by their developmental timing, such that they reveal the change in the pattern of gene expression over time. For any image, detailed scientific information is readily available by selecting the appropriate row (Fig. 1D). This includes a larger expression pattern image, information on experimental protocol, link-out to image source, and controlled vocabulary terms (Fig. 1D).
In the development of the FlyExpress app, we used the industry standard XML and HTTP protocols to access the database server remotely. To circumvent potential performance challenges presented by downloading images remotely over the network, we used asynchronous callbacks to load images in the background allowing the user interface to remain interactive even in the case of slow network connection and to display images in a smooth scrolling view. To further maximize performance, we use an image cache directory to store loaded images for reuse when a user returns to a previous screen, and the users can see their last viewed image sets for up to 2 days on app relaunch.
The developmental-stage information available from BDGP and Fly-FISH resources is rather coarse, as images are grouped into six-stage ranges in BDGP data (1–3, 4–6, 7–8, 9–10, 11–12 or 13–16), whereas Fly-FISH embryos are classified into five-stage ranges (1–3, 4–5, 6–7, 8–9 and later) (see Konikoff et al., 2012 for details). This represents low resolution developmental time information, with each group of images capturing significant changes in spatial expression of each gene corresponding to major embryogenesis events. Therefore, we have been developing novel machine-learning methods to determine the developmental order of expression patterns by means of computational analysis (manuscript in preparation). The FlyExpress app provides access to initial results from these approaches for images from BDGP data. For example, all expression patterns in Figure 1C belong to the stage Group 4–6 in the BDGP data, which when ordered using our new method produce a better picture of the changes in gene expression over time for giant, which is shown in Figure 1C.
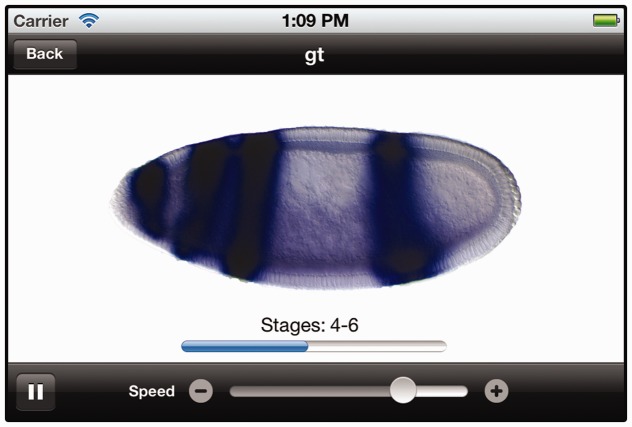
When presenting these results, the FlyExpress app enables the user to view expression patterns in a number of ways. In addition to a list of image thumbnails shown in a columnar format, the user has the option to filter the image list by selecting either a BDGP or Fly-FISH source and to filter by different anatomical views (lateral, ventral, dorsal and other). In addition, we developed a carousel image viewer where users can view sets of larger images in an interactive “carousel” scroll view, allowing them to swipe through the images that are displayed in the order of developmental stages (Fig. 2). We also make available an animation in which expression patterns from consecutive stages are morphed to dynamically display changes in expression over time.
Fig. 2.
A carousel display of expression patterns of giant (see also Fig. 1)
In the near future, we plan to enhance the FlyExpress app to contain finer-stage annotations for all the data, including searching of expression patterns based on GEMs (Genome-scale Expression Maps; Konikoff et al., 2012). Overall, the FlyExpress iPhone application development represents our effort to make the primary scientific data and the derived knowledge of our Web resource readily available in all places and at all times to enhance scientific discovery and discourse.
Acknowledgements
We thank Wayne Parkhurst and Lei Yuan and for their help.
Funding: This work was supported by research grants from the US National Institutes of Health (HG002516-08 and LM010730-02).
Conflict of interest: none declared.
References
- James RA, et al. The Hematopoietic Expression Viewer: expanding mobile apps as a scientific tool. Bioinformatics. 2012;28:1941–1912. doi: 10.1093/bioinformatics/bts279. [DOI] [PMC free article] [PubMed] [Google Scholar]
- Konikoff C, et al. Comparison of embryonic expression within multigene families employing the FlyExpress discovery platform reveals significantly more spatial than temporal divergence. Dev Dyn. 2012;241:150–160. doi: 10.1002/dvdy.22749. [DOI] [PMC free article] [PubMed] [Google Scholar]
- Kumar S, et al. FlyExpress: visual mining of spatiotemporal patterns for genes and publications in Drosophila embryogenesis. Bioinformatics. 2011;27:3319–3320. doi: 10.1093/bioinformatics/btr567. [DOI] [PMC free article] [PubMed] [Google Scholar]
- Kumar S, Hedges SB. TimeTree2: species divergence times on the iPhone. Bioinformatics. 2011;27:2023–2024. doi: 10.1093/bioinformatics/btr315. [DOI] [PMC free article] [PubMed] [Google Scholar]
- Lécuyer E, et al. Global analysis of mRNA localization reveals a prominent role in organizing cellular architecture and function. Cell. 2007;131:174–187. doi: 10.1016/j.cell.2007.08.003. [DOI] [PubMed] [Google Scholar]
- Tomancak P, et al. Systematic determination of patterns of gene expression during Drosophila embryogenesis. Genome Biol. 2002;3:RESEARCH0088. doi: 10.1186/gb-2002-3-12-research0088. [DOI] [PMC free article] [PubMed] [Google Scholar]


