
Fig. 2.
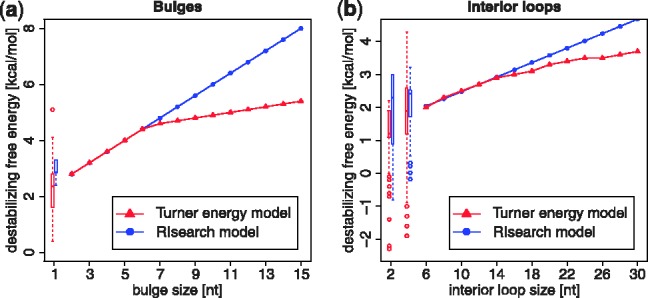
Approximated loop energies. In red, energies as given by Turner 2004 parameters. In blue, the linear approximation used in RIsearch. Values for small loops are given as box plots (RIsearch to the right). (a) Bulge loops: the affine gap model is exact for bulge sizes 2–6, and over-penalizes larger loops. (b) Interior loops: here symmetric case only, for asymmetric loops a penalty is added. Furthermore, parameters for AU/GU closure and terminal mismatch are applied where required in both schemes. Small symmetric internal loops (1 × 1 and 2 × 2) have tabulated free energy changes, here shown as box plots. Next to that, RIsearch approximations are plotted, including the aforementioned parameters