Abstract
Transgenic and knockout mice have been powerful tools for the investigation of the physiology and pathophysiology of airways1,2. In vitro tensometry of isolated tracheal preparations has proven to be a useful assay of airway smooth muscle (ASM) contractile response in genetically modified mice. These in vitro tracheal preparations are relatively simple, provide a robust response, and retain both functional cholinergic nerve endings and muscle responses, even after long incubations.
Tracheal tensometry also provides a functional assay to study a variety of second messenger signaling pathways that affect contraction of smooth muscle. Contraction in trachea is primarily mediated by parasympathetic, cholinergic nerves that release acetylcholine onto ASM (Figure 1). The major ASM acetylcholine receptors are muscarinic M2 and M3 which are Gi/o and Gq coupled receptors, respectively3,4,5. M3 receptors evoke contraction by coupling to Gq to activate phospholipase C, increase IP3 production and IP3-mediated calcium release from the sarcoplasmic reticulum3,6,7. M2/Gi/o signaling is believed to enhance contractions by inhibition of adenylate cyclase leading to a decrease in cAMP levels5,8,9,10. These pathways constitute the so called "pharmaco-contraction coupling" of airway smooth muscle11. In addition, cholinergic signaling through M2 receptors (and modulated by M3 signaling) involves pathways that depolarize the ASM which in turn activate L-type, voltage-dependent calcium channels (Figure 1) and calcium influx (so called "excitation-contraction coupling")4,7. More detailed reviews on signaling pathways controlling airway constriction can be found4,12. The above pathways appear to be conserved between mice and other species. However, mouse tracheas differ from other species in some signaling pathways. Most prominent is their lack of contractile response to histamine and adenosine13,14, both well-known ASM modulators in humans and other species5,15.
Here we present protocols for the isolation of murine tracheal rings and the in vitro measurement of their contractile output. Included are descriptions of the equipment configuration, trachea ring isolation and contractile measurements. Examples are given for evoking contractions indirectly using high potassium stimulation of nerves and directly by depolarization of ASM muscle to activate voltage-dependent calcium influx (1. high K+, Figure 1). In addition, methods are presented for stimulations of nerves alone using electric field stimulation (2. EFS, Figure 1), or for direct stimulation of ASM muscle using exogenous neurotransmitter applied to the bath (3. exogenous ACH, Figure 1). This flexibility and ease of preparation renders the isolated trachea ring model a robust and functional assay for a number of signaling cascades involved in airway smooth muscle contraction.
Keywords: Medicine, Issue 64, Physiology, trachea, force transduction, Airway smooth muscle, constriction, cholinergic receptor
Protocol
1. Equipment
The major components of a contraction measurement device are shown schematically in Figure 2A).
A tissue bath. The tissue bath maintains an oxygenated physiological solution at warm temperature. For mice trachea rings, we use a 10 ml tissue bath that contains a water jacket for circulating a warming solution, a fritted glass inlet to bubble oxygen (95%/5% O2/CO2 mixture) and inlet and outlet ports for changing solutions. A reservoir PSS solution is stored with constant bubbling of 95%/5% O2/CO2 mixture in a 37 °C water bath (not shown). For solution exchanges, PSS solution is pumped from the reservoir to the tissue bath inlet (bottom port) at approximately 100 mls per minute to allow relatively fast solution exchange. The solution outlet is through an overflow port (top port) that allows constant volume (~10 ml) in the tissue bath during solution exchange. We use a Haake heating circulator to pump warm water through the tissue bath jacket (to maintain 37 °C). Tissue baths can be obtained from a number of suppliers and come in a variety of sizes and styles to fit the experimental needs of the investigator.
A force transducer. To measure isometric tension, the trachea tube is threaded over L-shaped ends of two stainless steel rods (Figure 2A). Care should be taken to use a stainless steel type that is compatible with biological material. The top rod is connected via a clip to an isometric force transducer. The bottom rod holds the trachea at a fixed position, and is mounted on a micrometer for adjustment of passive tension and/or muscle length. Contraction of the trachea creates tension on the force transducer, which is converted to a voltage signal at the preamplifier. The bottom rod may also be configured to include two rectangular platinum plates (4 mm apart) that flank the trachea (Figure 2B). The platinum plates are wired to a Grass S88 stimulator that allows delivery of an electric field across the trachea. Open wires and solder are coated with Sylgard (Sylgard 184 Silicone Elastomer, Dow Corning Corp, Midland, MI), to prevent leaching of metals into the bath solution.
A/D converter, computer and acquisition software. Signals from the preamplifiers are recorded on a MacLab 8 A/D system. This is an older version of the current ADInstrument Powerlab hardware. We use the program Chart (ADInstruments) that allows continuous recording of tension throughout the experiment. Tension generation of trachea muscle is quite slow, and therefore we find that acquisition of 100 points per second is adequate. The tension measurement is calibrated using known weights (up to 5 grams) before each experiment. Similar systems are available from other venders (e.g., BioPac, GW Instruments).
2. Trachea Isolation
Before tissue isolation the force transducer is calibrated with known weights, and the tissue bath is filled with normal PSS (see Table I). The air inlet is adjusted to obtain a light stream of O2/CO2.
Tracheas from two month or older mice are optimal. Younger animals may be used but tracheas obtained from these require greater skill to mount on the force transducer wires because of their small size. Prior to dissection, mice are deeply sedated with isoflurane. The proper level of sedation is reached when a toe-pinch with forceps is unable to elicit a response. Mice are immediately sacrificed by cervical dislocation. An important note: We have observed that Avertin (Tribromoethanol), a sedative commonly used in mice, has strong relaxant effects on airway smooth muscle and therefore should not be used for trachea contraction studies.
The skin (and fur) is removed from thorax to throat. Ribs are cut from the base of the sternum, laterally (on both sides) to the top of the heart. The sternum and ribs are then pulled forward to the throat to reveal the heart/lungs, thymus, trachea (ventral) and esophagus (attached to - and dorsal to trachea).
The trachea is excised by cutting below the bronchial bifurcation and above the pharynx. The trachea is placed into an ice-cold oxygenated (95/5) PSS solution (composition given in Table I).
The trachea is dissected clean of surrounding tissues. During cleaning, the trachea can be held at the pharynx or below the bifurcation. However, caution should be taken not to directly apply the forceps to the trachea itself. Fine scissors may be used to cut off surrounding tissues, but the cut should always be made parallel to the trachea to avoid damage. This part of the procedure is facilitated if the trachea preparation is pinned below the bifurcation and above the pharynx onto a Sylgard-coated dish (Sylgard 184 Silicone Elastomer, Dow Corning Corp, Midland, MI).
After removing surrounding tissue, the trachea is cut below the pharynx and above the bronchial bifurcation and gently mounted on the force transducer wires.
The trachea is threaded over two L-shaped metal prongs (Figure 2A). One prong is connected to a force-displacement transducer for continuous recording of isometric tension. Another prong is connected to a micrometer. The tissue bath is then raised so that the trachea is immersed in PSS. Mounting of the trachea should be done as quickly as possible to minimize the time that trachea are held outside of PSS. With practice, mounting of the trachea can be done within one minute but we generally avoid times longer than 3 minutes to avoid loss of viability.
The micrometer is adjusted slowly to obtain a passive tension of ~10 mN (~ 1 gram-force). The optimal resting tension was determined empirically and we have found that passive tension of ~ 5 - 10 mN results in an equivalent, maximal response to high potassium stimulation. This is consistent with a number of other studies that utilize a passive tension in this range16,17,18. Over the first 5-10 minutes, trachea passive tension tends to decline somewhat (stress-relaxation phenomenon) and the micrometer is used to adjust the passive tension to ~10 mN during equilibration. The trachea is allowed to equilibrate for at least 1 hour before experimental challenges.
3. High Potassium Stimulation
Following equilibration, the trachea is challenged twice with a high potassium PSS solution (67 mM KCl, Table I). The contraction generally requires ~ 5-10 minutes to reach steady-state at which time the tissue bath is rinsed several times with normal PSS to completely relax the trachea. The potassium contraction is repeated a second time, and a third time (if necessary) until reproducible contractions are obtained.
4. Contraction Evoked by Electrical Stimulation
The trachea is flanked by two rectangular platinum plates (electrodes) that allow electric field stimulation (EFS) to the preparation. The contractile response to EFS is a function of frequency and voltage. It is also affected by physical parameters such as the area of the electrodes and the distance between them. The power characteristics of the stimulator also affect responses such that at higher voltages and current outputs the stimulator can reach its maximum. The characteristics of any EFS system should be determined by examining the muscle contractile responses at differing stimulus durations, frequencies, voltages and pulse durations. For our experimental setup, we have found that electrodes separated by ~ 4 mm, and stimulation amplitude of 44 V (0.5 ms pulses) and 30 Hz are optimal to achieve reproducible near-maximal contractile responses.
5. Contraction Evoked by Cholinergic Stimulation
The responsiveness of the trachea to exogenously applied compounds is evaluated either by addition of a single dose of the drug of interest or, by multiple additions of the drug in a cumulative dose fashion. For the trachea, our laboratory routinely used carbachol to activate cholinergic receptors because, unlike acetylcholine, carbachol is not degraded by acetylcholinesterase. A reasonable dose-response range is from 10-8 to 10-5 M carbachol. Fitting of the Log[carbachol]-contractile response curve with a Hill-type equation allows an estimation of EC50 (half-maximal effective concentration) that is a measure of sensitivity of tracheal contraction to the cholinergic agonist 19. It is worth noting that a given dose of carbachol will give a slightly greater response as a single dose than as part of a cumulative dose response curve.
6. Representative Results
An example of a contractile response to high potassium is shown in Figure 3A. The contraction reaches a maximum within approximately 10 minutes but may show a small decline thereafter. During early washout of high potassium, the muscle may show a transient increase in contraction that is due to a drop in temperature as the small volume of unheated PSS solution in the solution lines transiently perfuses the preparation. This can be minimized by having a minimum dead volume in the tubing connecting the heated PSS reservoir and tissue bath, and also by exchanging solution relatively quickly (generally we pump solutions at 100 ml/min). Each preparation will have some differences in contractile response due to differences in muscle mass or damage incurred during the dissection. Figure 3B shows two tracheas of different muscle mass challenged with high potassium and carbachol. Although the cholinergic-evoked contractions differ, they are similar after normalization to the response with high potassium solution (Figure 3C).
Figure 4 shows an example of a carbachol (cholinergic) evoked contraction using single doses (A) and a cumulative increase (B). The carbachol solutions are added directly to the bath and the bubbled gas helps in rapid mixing. It is worth noting that addition of a single dose (i.e. 1 μM, Figure 4A) has a slightly larger response than the equivalent concentration during a cumulative dose-response curve (1 μM, Figure 4B). Figure 4C shows a plot of contraction force as a function of carbachol concentrations using data from Figure 4B. Effects of carbachol saturate at 10-5 M concentration. Although cholinergic agonists initiates contraction through calcium release mechanisms, a substantial component of the contraction is also mediated by depolarization and activation of voltage-dependent calcium channels 20.
Figure 5A shows an example of EFS-evoked contractions. Tracheas are stimulated using 0.5 millisecond duration, 40 volt pulses until contractions reach a plateau (see inset a1). An increase in stimulation frequency causes an increased contractile response (frequency-response curve is plotted in Figure 5B). Electric field stimulation has been shown to evoke contractions predominantly by activating presynaptic nerves. This is evidenced by the effect of botulinum toxin, a blocker of neurotransmitter release that blocks the majority of the EFS-evoked contractions of trachea 21. Moreover, tetrodotoxin, an agent that blocks Na+ channels also inhibits nerve activity and eliminates the response of trachea to EFS.
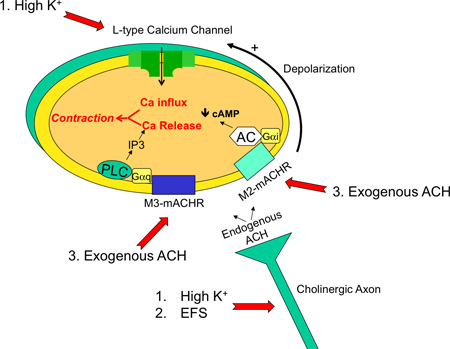 Figure 1. Diagram of the major signaling pathways in an isolated trachea preparation. Shown is a cholinergic axon terminal innervating a tracheal smooth muscle cell. The major signaling pathways are M3- and M2- muscarinic acetylcholine receptor activation (mACHR) that cause calcium release through IP3 receptors (M3) and reduction of cAMP (M2). M2 receptors (and some contribution of M3 receptors) also cause cholinergic-evoked depolarization that activates L-type voltage-dependent calcium channels and calcium influx. Common contractile agents and their effectors are 1. high potassium (depolarize smooth muscle cell and cholinergic axon), 2. electric field stimulation (EFS, depolarizes cholinergic axon) and 3. exogenous application of cholinergic agents such as acetylcholine or carbachol (activates muscarinic receptors directly).
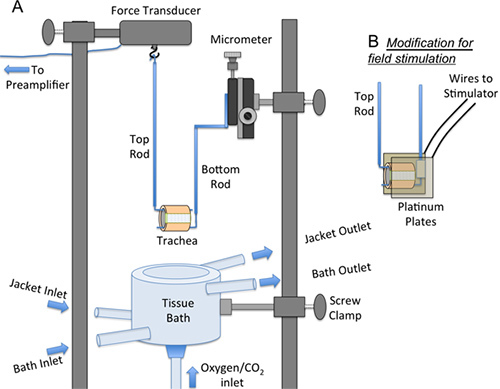 Figure 2. Diagram of equipment used to measure tracheal contractions. A. The force transducer, micrometer and tissue bath are mounted on supporting rods via screw clamps. The tracheal ring is threaded over the top and bottom rods. In the diagram, the tissue bath is positioned below the preparation (i.e. during mounting of the trachea onto the force transducer). During contraction studies, the tissue bath is moved vertically to bathe the preparation. B. For electric field stimulation the bottom rod is modified to include two platinum plates that are mounted laterally to the trachea holding wire. The platinum plates are connected by electrical wires to a stimulator.
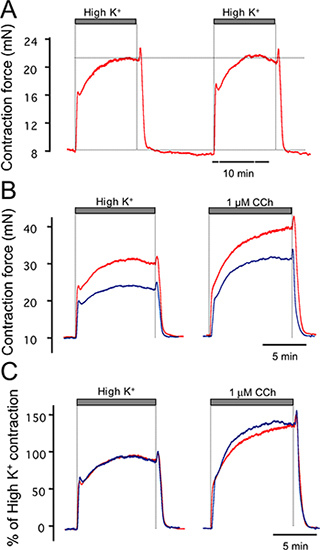 Figure 3. Examples of high potassium (67 mM) contractile response of trachea. (A) shows duplicate, reproducible responses to high potassium. (B) Examples of contractile response to carbachol of two different tracheas. (C) Responses to the tracheas in B are similar when normalized to the high potassium response.
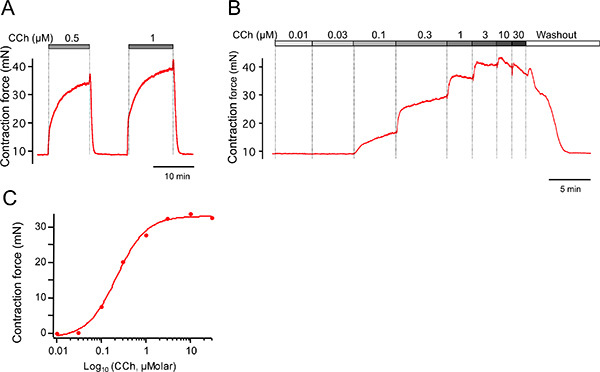 Figure 4. Examples of carbachol-induced contractions. (A) Carbachol-induced contractions using single doses followed by washout. (B) Example cumulative dose-response curve for trachea in A. (C) Peak contractions from B are plotted as a function of carbachol concentration.
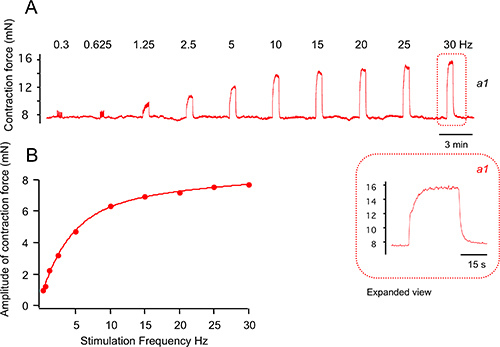 Figure 5. Examples of contractions evoked by electric field stimulation. (A) Electric field stimulation of trachea contraction using 0.5 ms pulse, 40 volts, and various stimulation frequencies as indicated. Inset is time-expanded contraction at 30 Hz. (B) Peak contractions from A are plotted as a function of stimulation frequency.
Normal PSS
| Salt | Conc.(mM) | Amount(g/2 L) |
| NaCl | 119 | 13.91 |
| KCl | 4.7 | 0.7 |
| KH2PO4 | 1.18 | 0.32 |
| MgSO4 x 7H2O | 1.17 | 0.58 |
| NaHCO3 | 18 | 3.02 |
| EDTA | 0.026 | 0.1 ml of 0.5 M |
| Glucose | 11 | 3.96 |
| Sucrose | 12.5 | 8.56 |
| CaCl2 | 2 | 400 ml of 10 mM |
High K+ PSS (NaCl and KCl adjustments)
| Salt | Conc. (mM) | Amount (g/2 L) |
| NaCl | 56.7 | 6.628 |
| KCl | 67 | 9.991 |
Table 1. Recipe for PSS solutions. Note: Solutions are made fresh weekly, with ultrapure quality water, and are stored in a refrigerator for no longer than 5 days to avoid contaminating growth.
Discussion
The protocol presented here provides a physiological preparation to assess airway muscle function. We generally operate 3-4 organ bath preparations simultaneously, however, prepackaged systems are available from a number of suppliers that allow simultaneous measurements of up to 8 preparations (ADInstruments, World Precision Instruments, and Harvard Apparatus). We have utilized a number of force transducers and tissue organ baths with equivalent results. However, we find that electric field stimulation provides some variability based on slight differences between stimulating electrodes size, distance between electrode plates, and position of the preparation within the electric field. Thus, extra care should be undertaken to make field electrodes as similar as possible.
One of the most critical parameters in isometric force measurements is the issue of normalizing contractions to compensate for variations in muscle mass, or health of muscle tissue between different preparations. In part, differences can be minimized by comparing animals of similar age and same sex (female mice tend to generate reduced trachea tension). Further, we have found that normalization to trachea wet or dry weight lacks sufficient precision, possibly due to the small size of mouse trachea. Rather, the use of multiple, high potassium, contractions is quite advantageous. High potassium contractions serve two purposes. The high potassium contraction appears to "awaken" the tracheal muscle and ensures that contractions are reproducible before proceeding with experimental challenges. The high potassium contraction also appears to be an accurate normalization for active muscle mass that is present in the preparation. Thus, experimental tension measurements are often expressed as force normalized to high potassium contraction. In addition, the quality of a preparation can be evaluated using the high potassium-induced contraction. For example, we find that 8 - 10 week old C57BL/6J male mice have a high potassium-induced contraction of 20 ± 3.8 mN (mean ± standard deviation, n = 17). If a trachea preparation contracts well below this range (below 12 mN or two standard deviations below mean), then it is generally regarded as "damaged" and not utilized for experimentation. Alternatively, normalization of tension to the maximum tension at saturating cholinergic agonist may be used. This is useful for observing changes in sensitivity to agonist, but may miss changes that effect the maximum contraction.
Methods were presented to activate contraction either using a cholinergic agonist or with electrical stimulation. Cholinergic agonist application to the tissue bath directly activates smooth muscle. In contrast, with moderate EFS stimulation frequency (up to 25 Hz) the majority of the contraction is mediated through nerve activation and release of neurotransmitter 22. Thus the investigator has the opportunity to investigate agents that affect presynaptic/nerve-mediated contraction using EFS stimulation. Finally, studies indicate that other cell types such as mast cells 23, and epithelial cells 24 also influence contractility in the isolated trachea preparation. Thus, the in vitro mouse trachea preparation provides a robust functional assay for a number of cell types that influence airway smooth muscle contractility.
In summary, the mouse in vitro trachea preparation has been particularly useful in analysis of genetic alterations that affect airway function. Some examples include analysis of gene knockouts of ion channels 17,20,25,26, metabotropic receptors 27,28,29,30, and downstream signaling cascades 31. In addition, the antigen challenged mouse is frequently used for asthma studies 32 and the in vitro trachea preparation provides a useful assay for changes in contractility that ensues following development of asthma.
Disclosures
No conflicts of interest declared.
Acknowledgments
This work was funded by a grant from the Center for Innovation in Prevention and Treatment of Airway Diseases, NINDS grant (NS052574), and from the Sandler Program for Asthma Research.
References
- Lloyd CM. Building better mouse models of asthma. Curr. Allergy Asthma Rep. 2007;7:231–236. doi: 10.1007/s11882-007-0077-0. [DOI] [PMC free article] [PubMed] [Google Scholar]
- Hausding M, Sauer K, Maxeiner JH, Finotto S. Transgenic models in allergic responses. Curr. Drug Targets. 2008;9:503–510. doi: 10.2174/138945008784533570. [DOI] [PubMed] [Google Scholar]
- Eglen RM, Hegde SS, Watson N. Muscarinic receptor subtypes and smooth muscle function. Pharmacol Rev. 1996;48:531–565. [PubMed] [Google Scholar]
- Ehlert FJ. Contractile role of M2 and M3 muscarinic receptors in gastrointestinal, airway and urinary bladder smooth muscle. Life Sci. 2003;74:355–366. doi: 10.1016/j.lfs.2003.09.023. [DOI] [PubMed] [Google Scholar]
- Hall IP. Second messengers, ion channels and pharmacology of airway smooth muscle. Eur. Respir. J. 2000;15:1120–1127. doi: 10.1034/j.1399-3003.2000.01523.x. [DOI] [PubMed] [Google Scholar]
- Berridge MJ. Inositol trisphosphate and calcium signalling. Nature. 1993;361:315–325. doi: 10.1038/361315a0. [DOI] [PubMed] [Google Scholar]
- Ehlert FJ. Pharmacological analysis of the contractile role of M2 and M3 muscarinic receptors in smooth muscle. Receptors Channels. 2003;9:261–277. [PubMed] [Google Scholar]
- Sankary RM, Jones CA, Madison JM, Brown JK. Muscarinic cholinergic inhibition of cyclic AMP accumulation in airway smooth muscle. Role of a pertussis toxin-sensitive protein. Am. Rev. Respir Dis. 1988;138:145–150. doi: 10.1164/ajrccm/138.1.145. [DOI] [PubMed] [Google Scholar]
- Widdop S, Daykin K, Hall IP. Expression of muscarinic M2 receptors in cultured human airway smooth muscle cells. Am. J. Respir. Cell Mol. Biol. 1993;9:541–546. doi: 10.1165/ajrcmb/9.5.541. [DOI] [PubMed] [Google Scholar]
- Karaki H. Calcium movements, distribution, and functions in smooth muscle. Pharmacol. Rev. 1997;49:157–230. [PubMed] [Google Scholar]
- Somlyo AV, Somlyo AP. Electromechanical and pharmacomechanical coupling in vascular smooth muscle. J. Pharmacol Exp. Ther. 1968;159:129–145. [PubMed] [Google Scholar]
- Fryer AD, Jacoby DB. Muscarinic receptors and control of airway smooth muscle. Am. J. Respir. Crit. Care Med. 1998;158:154–160. doi: 10.1164/ajrccm.158.supplement_2.13tac120. [DOI] [PubMed] [Google Scholar]
- Fernandez-Rodriguez S, Broadley KJ, Ford WR, Kidd EJ. Increased muscarinic receptor activity of airway smooth muscle isolated from a mouse model of allergic asthma. Pulm. Pharmacol. Ther. 2010;23:300–307. doi: 10.1016/j.pupt.2010.03.001. [DOI] [PubMed] [Google Scholar]
- Garssen J, Loveren HVan, Van Der Vliet H, Nijkamp FP. An isometric method to study respiratory smooth muscle responses in mice. J. Pharmacol. Methods. 1990;24:209–217. doi: 10.1016/0160-5402(90)90031-f. [DOI] [PubMed] [Google Scholar]
- Vass G, Horvath I. Adenosine and adenosine receptors in the pathomechanism and treatment of respiratory diseases. Curr. Med. Chem. 2008;15:917–922. doi: 10.2174/092986708783955392. [DOI] [PubMed] [Google Scholar]
- Borchers MT. Methacholine-induced airway hyperresponsiveness is dependent on Galphaq signaling. Am. J. Physiol. Lung Cell Mol. Physiol. 2003;285:114–120. doi: 10.1152/ajplung.00322.2002. [DOI] [PubMed] [Google Scholar]
- Sausbier M. Reduced rather than enhanced cholinergic airway constriction in mice with ablation of the large conductance Ca2+-activated K+ channel. Faseb. J. 2007;21:812–822. doi: 10.1096/fj.06-7167com. [DOI] [PubMed] [Google Scholar]
- Scheerens H. Long-term topical exposure to toluene diisocyanate in mice leads to antibody production and in vivo airway hyperresponsiveness three hours after intranasal challenge. Am. J. Respir. Crit. Care. Med. 1999;159:1074–1080. doi: 10.1164/ajrccm.159.4.9701012. [DOI] [PubMed] [Google Scholar]
- Kenakin TP. A pharmacology primer : theory, applications, and methods. 3rd edn. Academic Press/Elsevier; 2009. [Google Scholar]
- Semenov I, Wang B, Herlihy JT, Brenner R. BK Channel {beta}1 Subunits Regulate Airway Contraction Secondary to M2 Muscarinic Acetylcholine Receptor Mediated Depolarization. J. Physiol. 2011. pp. 1803–1817. [DOI] [PMC free article] [PubMed]
- Moffatt JD, Cocks TM, Page CP. Role of the epithelium and acetylcholine in mediating the contraction to 5-hydroxytryptamine in the mouse isolated trachea. Br. J. Pharmacol. 2004;141:1159–1166. doi: 10.1038/sj.bjp.0705720. [DOI] [PMC free article] [PubMed] [Google Scholar]
- Bachar O, Adner M, Uddman R, Cardell LO. Nerve growth factor enhances cholinergic innervation and contractile response to electric field stimulation in a murine in vitro model of chronic asthma. Clin. Exp. Allergy. 2004;34:1137–1145. doi: 10.1111/j.1365-2222.2004.1868.x. [DOI] [PubMed] [Google Scholar]
- Weigand LA, Myers AC, Meeker S, Undem BJ. Mast cell-cholinergic nerve interaction in mouse airways. J. Physiol. 2009;587:3355–3362. doi: 10.1113/jphysiol.2009.173054. [DOI] [PMC free article] [PubMed] [Google Scholar]
- Kao J, Fortner CN, Liu LH, Shull GE, Paul RJ. Ablation of the SERCA3 gene alters epithelium-dependent relaxation in mouse tracheal smooth muscle. Am. J. Physiol. 1999;277:264–270. doi: 10.1152/ajplung.1999.277.2.L264. [DOI] [PubMed] [Google Scholar]
- Krane CM. Aquaporin 5-deficient mouse lungs are hyperresponsive to cholinergic stimulation. Proc. Natl. Acad. Sci. U.S.A. 2001;98:14114–14119. doi: 10.1073/pnas.231273398. [DOI] [PMC free article] [PubMed] [Google Scholar]
- Semenov I, Wang B, Herlihy JT, Brenner R. BK channel beta1-subunit regulation of calcium handling and constriction in tracheal smooth muscle. Am. J. Physiol. Lung. Cell Mol. Physiol. 2006;291:L802–L810. doi: 10.1152/ajplung.00104.2006. [DOI] [PubMed] [Google Scholar]
- Fortner CN, Breyer RM. EP2 receptors mediate airway relaxation to substance P ATP, and PGE2. Am. J. Physiol. Lung Cell Mol. Physiol. 2001;281:469–474. doi: 10.1152/ajplung.2001.281.2.L469. [DOI] [PubMed] [Google Scholar]
- Hay DW. Differential modulation of endothelin ligand-induced contraction in isolated tracheae from endothelin B (ET(B)) receptor knockout mice. Br. J. Pharmacol. 2001;132:1905–1915. doi: 10.1038/sj.bjp.0703957. [DOI] [PMC free article] [PubMed] [Google Scholar]
- Stengel PW, Yamada M, Wess J, Cohen ML. M(3)-receptor knockout mice: muscarinic receptor function in atria, stomach fundus, urinary bladder, and trachea. Am. J. Physiol. Regul. Integr. Comp Physiol. 2002;282:R1443–R1449. doi: 10.1152/ajpregu.00486.2001. [DOI] [PubMed] [Google Scholar]
- Trevisani M. Evidence for in vitro expression of B1 receptor in the mouse trachea and urinary bladder. Br. J. Pharmacol. 1038;126:1293–1300. doi: 10.1038/sj.bjp.0702410. [DOI] [PMC free article] [PubMed] [Google Scholar]
- Mehats C. PDE4D plays a critical role in the control of airway smooth muscle contraction. FASEB J. 2003;17:1831–1841. doi: 10.1096/fj.03-0274com. [DOI] [PubMed] [Google Scholar]
- Kumar RK, Herbert C, Foster PS. The "classical" ovalbumin challenge model of asthma in mice. Curr. Drug Targets. 2008;9:485–494. doi: 10.2174/138945008784533561. [DOI] [PubMed] [Google Scholar]


