Abstract
This paper details the quantitative three-dimensional anatomy of cervical, thoracic and lumbar vertebrae (C3–T12) of Chinese Singaporean subjects based on 220 vertebrae from 10 cadavers. The purpose of the study was to measure the linear dimensions, angulations and areas of individual vertebra, and to compare the data with similar studies performed on Caucasian specimens. Measurements were taken with the aid of a three-dimensional digitiser. The means and standard errors for linear, angular and area dimensions of the vertebral body, spinal canal, pedicle, and spinous and transverse processes were obtained for each vertebra. Compared to the Caucasian data, all the dimensions were found to be smaller. Of significance were the spinal canal area, and pedicle width and length, which were smaller by 31.7%, 25.7% and 22.1% on average, respectively. A slight divergence, instead of convergence, was found from T8 to T12. According to the findings, the use of a transpedicle screw may not be feasible. The results can also provide more accurate modelling for analysis and design of spinal implants and instrumentations, and also allow more precise clinical diagnosis and management of the spine in Chinese Singaporeans.
Keywords: Anatomy, Chinese, Caucasian, Human spine, Vertebral dimensions
Introduction
Performing studies using mathematical models of the spine can provide a better understanding of spinal behaviour [8, 12]. The results from the studies can provide crucial information for spinal instrumentation [3, 5, 6, 10] and spinal management, and useful guidelines for the use of devices [1, 9]. However, one of the major factors that can affect the accuracy of the results is the accuracy of the vertebrae modelled.
The majority of the quantitative studies on the human vertebrae have been conducted on Caucasian subjects [4, 7, 11, 13, 14, 15, 16]. This paper presents the quantitative three-dimensional anatomical parameters of the cervical (C3–C7), thoracic (T1–T12) and lumbar (L1–L5) spine of Chinese Singaporeans. The purpose of this paper is to report the quantitative three-dimensional dimensions (linear, angular and area) of the thoracic vertebrae, and to compare the data with similar studies performed on Caucasian subjects [11, 13, 14, 15, 16].
Materials and methods
C3–L5 vertebrae were removed from ten Chinese cadavers of Singaporean origin. The mean age of the subjects was 65.7 years (range 56–77), the mean weight was 61.6 kg (range 50–70) and the mean height was 1.66 m (range 1.59–1.72). The vertebrae were prepared by trimming off the soft tissue, leaving only the skeletal remains. The specimens were then immersed in sodium hydrochloride solution for 30 min to dissolve soft-tissue remnants. Excess sodium hydrochloride was removed by rinsing the specimens under running lukewarm water for 20 min. The specimens were then air dried and stored at a constant temperature and humidity to prevent any change in shape or dimension.
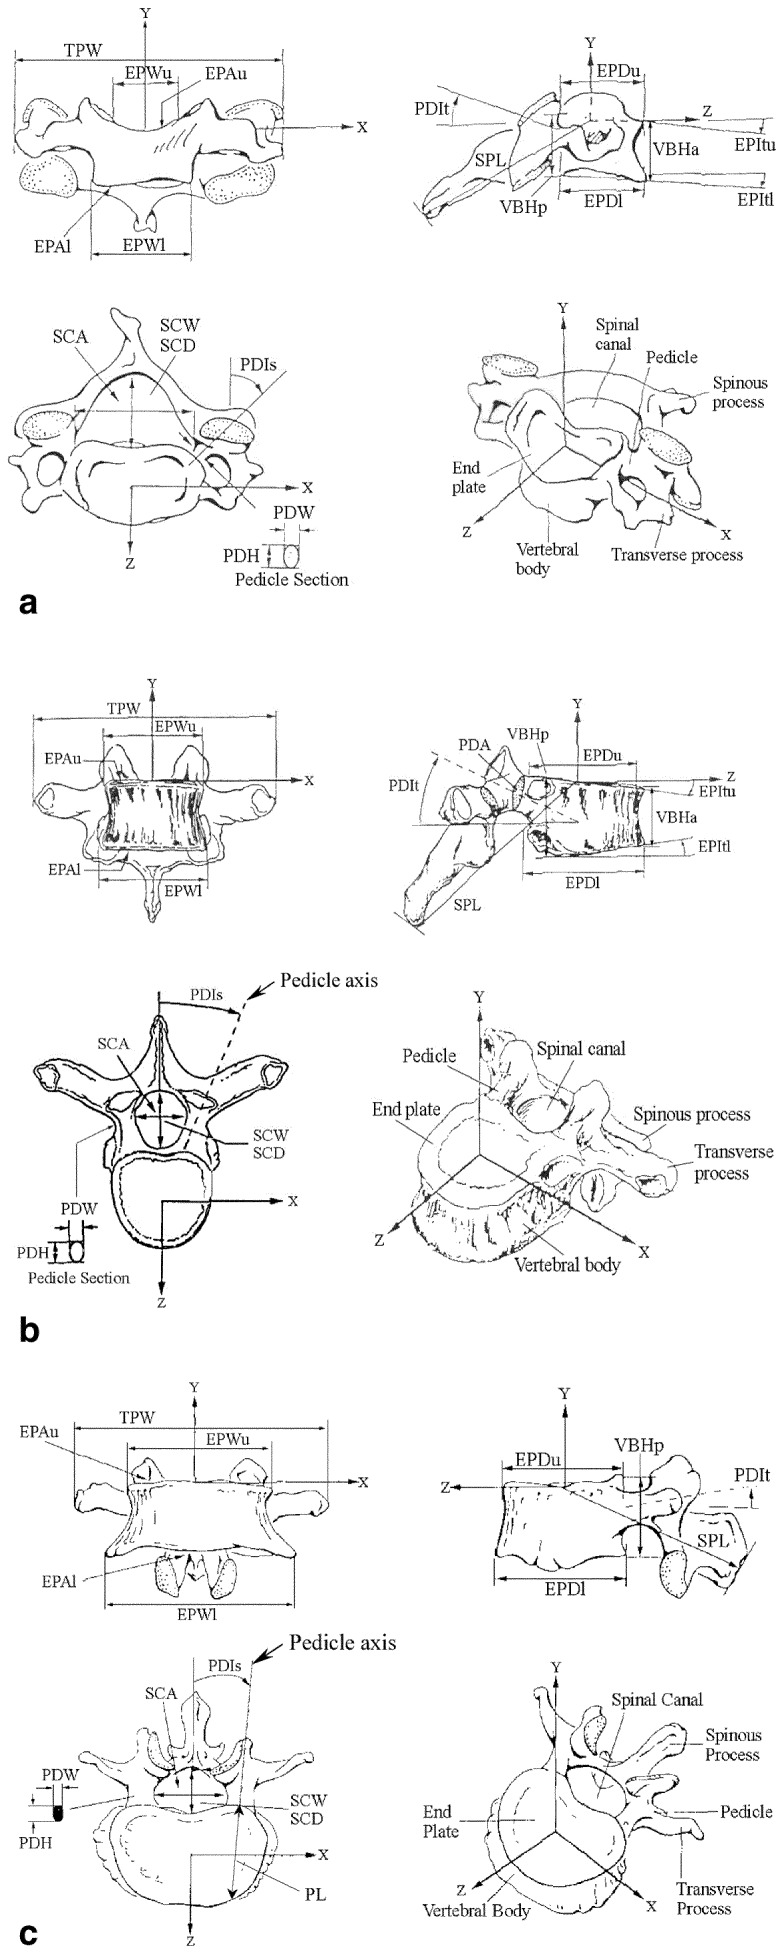
Figure 1a–c shows the orthogonal views of a cervical, thoracic and lumbar vertebra, respectively. Linear dimensions, angulations and areas of various vertebral parts were studied. For comparison purposes, the definitions of all the parameters are similar to those used by Panjabi et al. [13, 14, 15], McLain et al. [11] (for pedicle length, PL) and Zindrick et al. [16] (for PL and pedicle sagittal inclination, PDIs).
Fig. 1a–c.
Four views (front, side, top and isometric) of a cervical, thoracic and lumbar vertebra. EPAl Lower end-plate area, EPAu upper end-plate area, EPDl lower end-plate depth, EPDu upper end-plate depth, EPWl lower end-plate width, EPWu upper end-plate width, PDH pedicle height, PDIs left pedicle, sagittal inclination, PDIt left pedicle, transverse inclination, PDW pedicle width, SCA spinal canal area, SCD spinal canal depth, SCW spinal canal width, SPL spinous process length, TPW transverse process width, VBHa anterior vertebral body height, VBHp posterior vertebral body height. (Reproduced with permission from Panjabi et al. [13, 14, 15])
A hole of 5 mm in diameter was drilled about three-quarters of the way into the vertebral body from the anterior position (Fig. 2). A screw was used to secure the vertebra to prevent it from moving. This screw was in turn clamped in a vice clamp. Clay was used to further restrict movement of the vertebra in all degrees of freedom. The setup allowed the measuring instrument to access the vertebra conveniently. The three-dimensional co-ordinates were obtained without repositioning either the vertebra or the instrument. This ensured consistency in the data collection. Before commencing data collection, the measuring instrument was calibrated following established procedures recommended by the manufacturer.
Fig. 2.
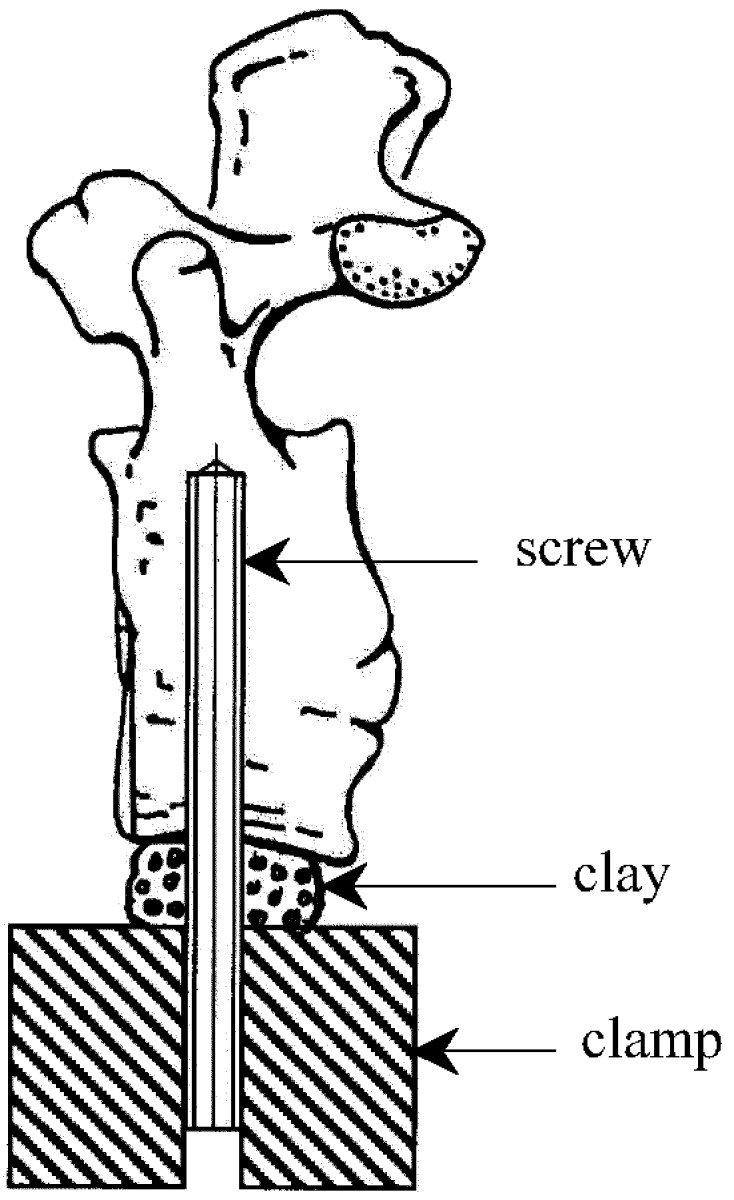
Setup of specimen prior to measurement. The clay prevents the specimen from moving during digitising
The measuring instrument was a direct-contact, three-dimensional digitiser with an accuracy of 0.01 mm. It uses a direct contact probe to establish the co-ordinate system and profile of the vertebra. The instrument was connected to a computer for direct data collection and processing. To ensure the reliability of the measurements taken by the digitiser, accuracy tests were conducted. For the linear parameter, a micrometer screw gauge was used for comparison. When the micrometer was set at 20 mm, the error was 1.28%, but when the instrument was set at 10 mm this error was lower (0.44%). For the angular parameter, two angle gauge blocks of 15° and 30° were used for the test. A mean error of 0.68% was obtained. For the area parameter, two different area bars with a similar area of 2,250 mm2 were used, and the mean error was found to be 1.71%. The verification shows that the accuracy of the digitiser is high and acceptable.
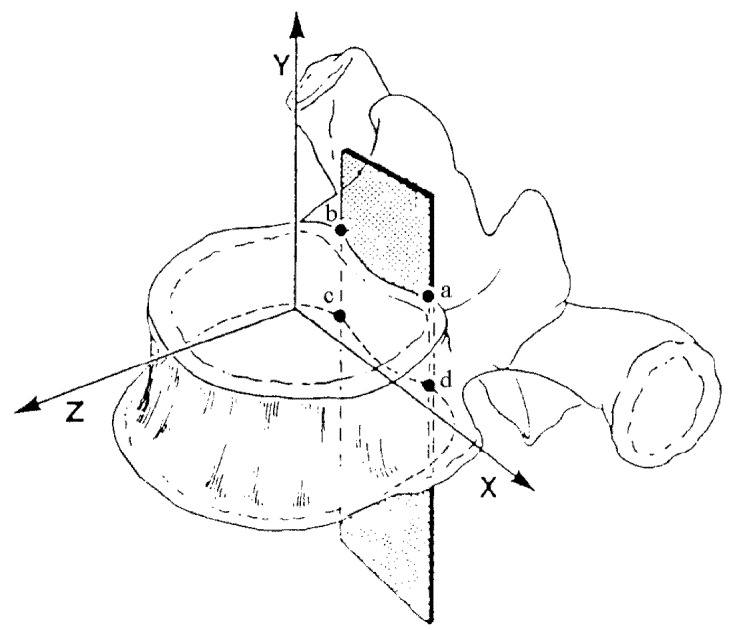
Before measurements were made and the data collected, the vertebra co-ordinate system had to be defined. As shown in Fig. 3, the origin of the vertebra co-ordinate system (x-, y-, z-axes) coincides with the centroid or centre of gravity of the upper end-plate. The posterior wall was used as a reference plane because it was fairly consistent and showed minimum variation in the presence of osteophytes. The plane is formed by three points: the first two points correspond to the first and second digitised positions “a” and “b”, and the third point is the average of the third and fourth digitised positions “c” and “d”, respectively. The sequence of digitising, which follows the right-hand thumb rule, determines the z-axis. Each digitised position was the average of ten hits to minimise error. The x-axis was established by the first digitising position “b” followed by position “a”. The point was then digitised approximately at the centroid of the upper end-plate, which was later specified more exactly by polygonising the end- plate. The polygonised area was generated into a volume by giving it an infinitesimal thickness (0.1 mm), and the axis origin was obtained from the volume.
Fig. 3.
Definition of the vertebra co-ordinate system with the origin at the centre of the upper end-plate
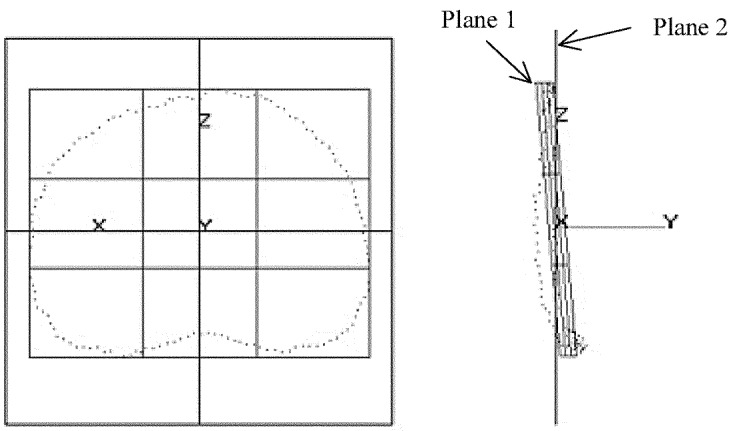
Once the co-ordinate system has been established, the profile of the vertebra can be traced manually and digitised using the direct contact probe of the digitiser. The digitised profile was converted into a three-dimensional surface image, from which the three-dimensional best-fit plane could be generated automatically in any orientation. Figure 4 shows the selected best-fit plane of a vertebra end-plate. Linear and area parameters of interest can then be obtained. For the former, only two points need to be marked on the figure. For the latter, the best-fit plane is polygonised into a triangular mesh, from which the area is computed. The angle between any two selected planes, e.g. plane 1 and plane 2 of Fig. 4, can be calculated automatically.
Fig. 4.
The plan and side views of the best-fit upper (selected) end-plate are shown. The linear and area dimensions can be obtained from the plan section, while the side view is used to yield the angles
An average of three readings was taken for each parameter. The results are divided into five areas, i.e. vertebral body, spinal canal, pedicle, spinous process and transverse process. Table 1 presents the findings for the parameters. The values of the parameters are shown as mean ± standard error of mean, where the standard error of mean is the sample standard deviation divided by the sample size.
Table 1.
Dimensions of parametersa (see Fig. 1 for nomenclature)
| Vertebral level | ||||||||||||||||||||||
|---|---|---|---|---|---|---|---|---|---|---|---|---|---|---|---|---|---|---|---|---|---|---|
| C3 | C4 | C5 | C6 | C7 | T1 | T2 | T3 | T4 | T5 | T6 | T7 | T8 | T9 | T10 | T11 | T12 | L1 | L2 | L3 | L4 | L5 | |
| Linear dimension (mm) | ||||||||||||||||||||||
| EPWu | 13.8±0.1 | 14.7±0.1 | 14.9±0.1 | 15.8±0.0 | 19.0±0.1 | 24.7±0.2 | 23.6±0.2 | 23.3±0.4 | 22.5±0.3 | 23.3±0.3 | 23.7±0.3 | 24.6±0.3 | 25.9±0.5 | 27.0±0.3 | 28.8±0.4 | 31.6±0.3 | 34.5±0.3 | 36.3±0.4 | 38.2±0.4 | 39.9±0.3 | 42.0±0.2 | 41.6±0.3 |
| EPWl | 14.3±0.1 | 15.0±0.1 | 15.9±0.1 | 19.5±0.2 | 20.3±0.2 | 27.1±0.4 | 25.3±0.4 | 24.4±0.4 | 25.0±0.4 | 23.8±0.1 | 24.8±0.5 | 26.8±0.3 | 27.9±0.4 | 29.2±0.4 | 31.9±0.2 | 35.3±0.2 | 36.4±0.4 | 39.2±0.5 | 41.4±0.3 | 43.5±0.3 | 45.3±0.5 | 43.7±0.4 |
| EPDu | 13.6±0.1 | 14.0±0.1 | 14.3±0.1 | 14.6±0.2 | 15.1±0.2 | 14.9±0.3 | 16.3±0.2 | 18.0±0.2 | 18.9±0.3 | 20.5±0.2 | 21.8±0.2 | 22.7±0.3 | 23.3±0.3 | 24.4±0.4 | 25.4±0.4 | 25.4±0.3 | 26.7±0.3 | 27.5±0.4 | 28.3±0.5 | 29.9±0.3 | 30.8±0.2 | 30.4±0.5 |
| EPDl | 15.1±0.2 | 15.2±0.4 | 15.1±0.3 | 15.7±0.3 | 15.6±0.3 | 15.8±0.2 | 17.7±0.3 | 19.0±0.2 | 20.0±0.3 | 21.6±0.3 | 23.0±0.2 | 23.5±0.3 | 24.7±0.4 | 25.5±0.4 | 26.2±0.3 | 26.9±0.2 | 27.7±0.3 | 28.5±0.5 | 29.2±0.5 | 30.2±0.4 | 30.3±0.6 | 28.7±0.4 |
| VBHa | 10.0±0.2 | 9.9±0.3 | 9.6±0.2 | 10.4±0.3 | 11.2±0.2 | 12.8±0.1 | 14.2±0.2 | 14.5±0.3 | 14.7±0.1 | 15.2±0.2 | 15.5±0.2 | 15.1±0.2 | 16.1±0.3 | 16.5±0.2 | 17.5±0.3 | 17.5±0.2 | 18.7±0.4 | 20.2±0.7 | 20.8±0.5 | 21.4±0.5 | 21.6±0.6 | 22.0±0.6 |
| VBHp | 11.2±0.1 | 11.3±0.2 | 11.3±0.1 | 11.3±0.2 | 11.8±0.3 | 14.0±0.2 | 15.2±0.2 | 15.3±0.2 | 15.8±0.2 | 16.4±0.2 | 17.0±0.3 | 17.4±0.3 | 17.8±0.3 | 18.0±0.3 | 19.1±0.2 | 20.4±0.2 | 21.5±0.2 | 22.4±0.4 | 23.1±0.3 | 22.1±0.4 | 21.6±0.3 | 20.0±0.6 |
| SCW | 19.2±0.4 | 19.3±0.5 | 20.3±0.4 | 20.6±0.4 | 19.7±0.4 | 17.7±0.3 | 15.2±0.3 | 14.2±0.3 | 13.5±0.3 | 13.6±0.3 | 13.8±0.3 | 13.9±0.4 | 14.1±0.3 | 14.2±0.4 | 14.2±0.4 | 15.3±0.2 | 17.9±0.3 | 19.4±0.2 | 19.5±0.2 | 19.4±0.4 | 20.2±0.5 | 23.4±0.6 |
| SCD | 10.3±0.3 | 10.3±0.3 | 10.3±0.3 | 10.3±0.3 | 11.0±0.2 | 11.6±0.3 | 11.7±0.2 | 12.0±0.2 | 11.8±0.2 | 11.5±0.2 | 11.6±0.2 | 11.9±0.1 | 11.9±0.2 | 11.8±0.2 | 11.9±0.3 | 11.8±0.2 | 12.4±0.3 | 12.5±0.2 | 11.7±0.2 | 11.2±0.3 | 11.2±0.4 | 11.4±0.4 |
| PDHl | 6.7±0.2 | 6.6±0.2 | 6.3±0.3 | 6.0±0.3 | 6.5±0.2 | 8.3±0.3 | 9.4±0.3 | 9.8±0.3 | 9.0±0.2 | 8.9±0.2 | 8.7±0.1 | 9.5±0.2 | 10.6±0.2 | 10.8±0.3 | 12.8±0.2 | 14.2±0.3 | 14.2±0.2 | 13.1±0.4 | 13.0±0.2 | 12.1±0.8 | 13.0±0.4 | 17.7±0.4 |
| PDHr | 6.8±0.2 | 6.7±0.2 | 5.9±0.2 | 6.0±0.1 | 6.1±0.1 | 8.7±0.2 | 9.6±0.2 | 9.8±0.3 | 9.3±0.2 | 9.2±0.3 | 9.1±0.2 | 9.6±0.1 | 10.1±0.2 | 11.0±0.3 | 13.0±0.2 | 14.3±0.2 | 14.0±0.3 | 13.1±0.3 | 12.7±0.2 | 12.9±0.4 | 13.40.3 | 17.1±0.3 |
| PDWl | 4.5±0.2 | 4.6±0.2 | 4.7±0.1 | 5.1±0.2 | 5.6±0.2 | 7.4±0.2 | 6.1±0.2 | 4.8±0.2 | 4.1±0.2 | 3.8±0.2 | 4.4±0.1 | 4.3±0.2 | 4.3±0.1 | 5.0±0.3 | 6.0±0.4 | 7.1±0.2 | 7.8±0.2 | 5.6±0.2 | 6.4±0.3 | 7.6±0.2 | 9.1±0.4 | 11.3±0.4 |
| PDWr | 4.4±0.2 | 4.5±0.2 | 4.9±0.2 | 5.4±0.2 | 5.7±0.2 | 7.5±0.2 | 5.8±0.1 | 4.4±0.1 | 3.9±0.1 | 4.2±0.3 | 4.3±0.1 | 4.6±0.2 | 4.7±0.2 | 4.9±0.3 | 5.9±0.3 | 6.9±0.2 | 7.3±0.3 | 5.5±0.3 | 6.2±0.3 | 7.6±0.2 | 8.6±0.4 | 11.8±0.5 |
| PL | - | - | - | - | - | 30.4±0.5 | 27.5±0.4 | 28.6±0.4 | 27.6±0.3 | 31.2±0.4 | 30.3±0.4 | 35.0±0.7 | 34.3±0.6 | 32.7±0.6 | 34.6±0.5 | 32.8±0.7 | 31.5±0.6 | 41.4±0.8 | 43.8±0.8 | 42.2±0.8 | 39.7±0.7 | 39.2±0.7 |
| SPL | 25.6±0.5 | 30.3±0.4 | 33.6±1.0 | 40.5±1.5 | 46.9±1.1 | 48.3±0.8 | 48.3±0.5 | 49.0±0.8 | 48.4±0.8 | 49.8±0.8 | 50.7±1.0 | 51.8±0.9 | 51.9±0.9 | 51.5±0.9 | 49.8±0.9 | 48.4±1.1 | 48.5±1.0 | 51.5±0.9 | 54.4±0.8 | 57.6±0.8 | 55.1±0.9 | 50.6±0.9 |
| TPW | 41.4±0.8 | 44.9±0.8 | 47.6±1.0 | 48.4±0.9 | 53.8±1.0 | 63.8±1.0 | 57.5±0.7 | 51.3±0.9 | 49.8±1.0 | 49.7±1.0 | 50.2±0.9 | 49.7±0.6 | 47.8±0.8 | 47.9±0.2 | 45.4±0.6 | 43.0±0.9 | 41.0±0.5 | 53.6±1.5 | 64.3±1.5 | 71.4±1.9 | 67.7±1.4 | 71.3±2.5 |
| Surface area (mm2) | ||||||||||||||||||||||
| EPAu | 154.7±3.8 | 169.2±4.9 | 187.4±6.6 | 210.5±10.0 | 220.8±9.0 | 304.8±13.8 | 347.6±10.5 | 352.9±7.2 | 373.6±5.2 | 408.7±10.9 | 452.1±15.7 | 477.5±15.2 | 552.6±18.9 | 587.9±19.9 | 640.6±22.5 | 706.6±21 | 795.6±20.8 | 889.8±25 | 984.0±32 | 1117.7±28.5 | 1151.8±20.3 | 1127.3±24.5 |
| EPAl | 216.8±10.1 | 241.5±10.6 | 286.4±10.3 | 316.3±7.4 | 340.0±10.3 | 372.8±11.4 | 399.2±12.5 | 387.1±9.0 | 420.0±6.7 | 450.0±13.4 | 506.9±15.0 | 543.0±16.8 | 610.3±19.9 | 645.0±21.2 | 715.7±19.0 | 803.0±21 | 877.7±24.7 | 1009.8±30 | 1090.9±26.9 | 1172.0±20.6 | 1199.3±35.5 | 1054.1±21.0 |
| SCA | 149.7±9.0 | 159.9±8.4 | 166.8±8.0 | 163.7±10.2 | 167.5±6.7 | 169.4±4.5 | 145.7±2.0 | 145.4±2.9 | 140.1±3.4 | 141.5±3.4 | 144.8±3.7 | 144.2±2.5 | 148.1±4.3 | 145.9±5.4 | 142.3±6.1 | 148.6±4.1 | 177.8±5.5 | 200.0±2.2 | 184.6±4.4 | 166.4±5.7 | 163.8±10.9 | 186.6±9.2 |
| PDAl | 27.6±1.0 | 27.7±0.8 | 27.4±1.1 | 29.4±1.5 | 33.7±2.6 | 55.2±3.4 | 47.0±3.2 | 40.8±2.7 | 33.4±2.0 | 31.3±1.8 | 34.4±1.1 | 37.5±1.4 | 42.3±1.0 | 52.9±3.7 | 72.2±3.6 | 95.6±3.4 | 99.1±2.1 | 67.8±3.2 | 74.5±3.6 | 96.2±2.5 | 105.8±4.9 | 158.9±5.8 |
| PDAr | 28.5±1.0 | 28.8±1.0 | 28.5±1.1 | 33.0±1.3 | 32.1±1.6 | 57.8±3.2 | 49.1±2.6 | 36.1±1.7 | 31.0±1.2 | 35.9±2.7 | 33.8±1.4 | 39.2±1.8 | 43.5±2.0 | 49.5±3.7 | 73.7±3.7 | 90.5±3.0 | 92.0±3.7 | 68.6±3.9 | 69.5±3.4 | 89.7±2.3 | 96.7±3.2 | 156.2±6.0 |
| Angular dimension (degrees) | ||||||||||||||||||||||
| EPItu | 5.0±4.1 | 5.2±5.2 | 7.1±1.2 | 5.8±0.6 | 5.8±0.8 | 7.2±0.7 | 3.9±0.4 | 3.2±0.6 | 1.5±0.2 | 1.4±0.4 | 1.0±0.2 | 2.1±0.5 | 2.2±0.2 | 1.6±0.4 | 1.4±0.2 | 3.4±0.7 | 4.5±0.7 | 1.8±0.4 | 3.4±0.4 | 1.9±0.3 | 3.7±0.6 | 6.9±0.9 |
| EPItl | 3.3±0.5 | 3.5±0.7 | 2.7±0.3 | 4.2±0.4 | 5.1±0.5 | −2.9±0.4 | −3.0±0.5 | −1.8±0.3 | −4.1±0.6 | −2.6±0.4 | −3.8±0.4 | −3.2±0.4 | −2.2±0.6 | −2.6±0.4 | −3.0±0.2 | −3.2±0.3 | −3.1±0.3 | −2.6±0.4 | −1.1±0.2 | 1.8±0.1 | 3.2±0.6 | 10.5±0.8 |
| PDIsl | −42.9±1.0 | −44.0±1.3 | −46.3±1.0 | −41.9±1.6 | −30.6±1.1 | −24.0±1.0 | −14.7±1.2 | −10.4±1.5 | −8.3±1.4 | −9.7±2.0 | −5.9±0.9 | −5.2±1.0 | 9.6±1.6 | 6.3±1.3 | 3.2±0.5 | 6.5±1.5 | 7.2±1.5 | −2.0±0.5 | −5.6±0.8 | −11.9±0.9 | −11.5±0.8 | −22.4±0.6 |
| PDIsr | 39.6±1.0 | 38.9±1.1 | 38.1±1.6 | 38.5±2.3 | 30.3±0.9 | 24.4±1.8 | 19.9±0.8 | 13.6±2.0 | 9.0±1.3 | 9.2±1.4 | 8.4±1.3 | 8.6±1.6 | −7.6±1.2 | −7.2±1.4 | −7.2±1.0 | −7.2±0.9 | −5.3±0.9 | 7.6±1.0 | 9.2±1.4 | 16.8±1.8 | 10.7±1.2 | 17.4±1.3 |
| PDItl | −4.8±1.0 | −3.2±0.7 | 2.6±0.7 | 4.8±1.0 | 5.8±0.7 | 2.2±0.5 | 8.5±1.3 | 7.0±0.7 | 4.0±0.8 | 6.5±0.9 | 6.3±0.9 | 5.6±0.8 | 4.8±0.9 | 4.8±0.5 | 3.0±0.5 | 3.3±0.8 | 3.5±0.8 | −1.7±0.3 | −2.4±0.2 | −5.0±0.9 | −7.3±0.7 | −7.8±0.6 |
| PDItr | −6.5±1.0 | −5.4±1.1 | 4.9±1.0 | 6.0±1.3 | 3.1±0.7 | 5.9±0.8 | 5.9±1.1 | 8.6±1.4 | 5.1±0.8 | 5.9±1.2 | 6.2±0.7 | 5.7±0.6 | 7.3±0.6 | 4.4±0.6 | 4.3±0.5 | 4.5±0.7 | 4.0±0.7 | −1.6±0.3 | −1.9±0.4 | −2.6±0.5 | −6.3±0.9 | −6.3±0.8 |
aThe value of each parameter represents the mean ± standard error of mean
Results
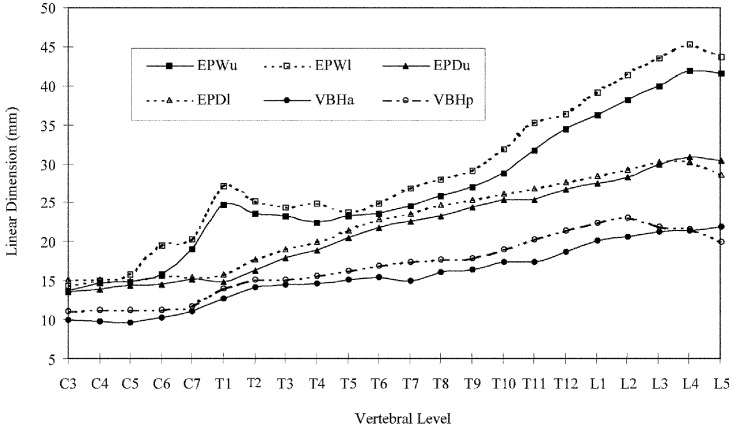
The trends of the linear, area and angular parameters studied are shown in Figs. 5, 6, 7, 8, 9. Their numerical values are presented in Table 1.
Fig. 5.
Linear dimensions of the vertebral body as functions of vertebral levels C3–L5. The linear dimensions are the upper (u) and lower (l) end-plate width (EPW) and depth (EPD), and the anterior (a) and posterior (p) vertebral body height (VBH)
Fig. 6.
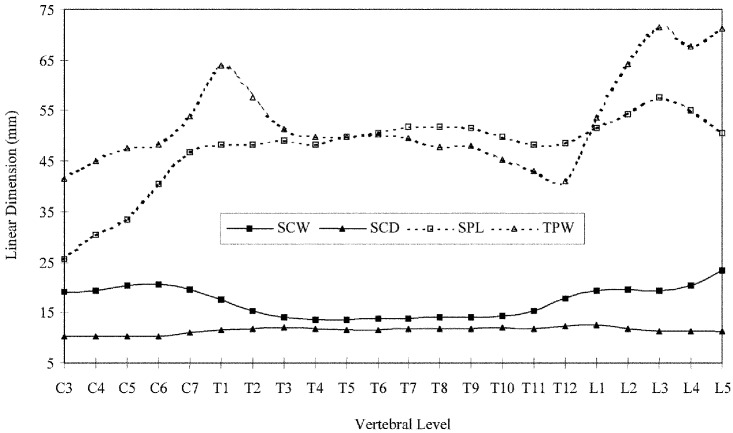
Linear dimensions of the spinal canal, spinous process and transverse process as functions of vertebral levels C3–L5. The linear dimensions are the spinal canal width (SCW) and depth (SCD), and the spinous process length (SPL) and transverse process width (TPW)
Fig. 7.
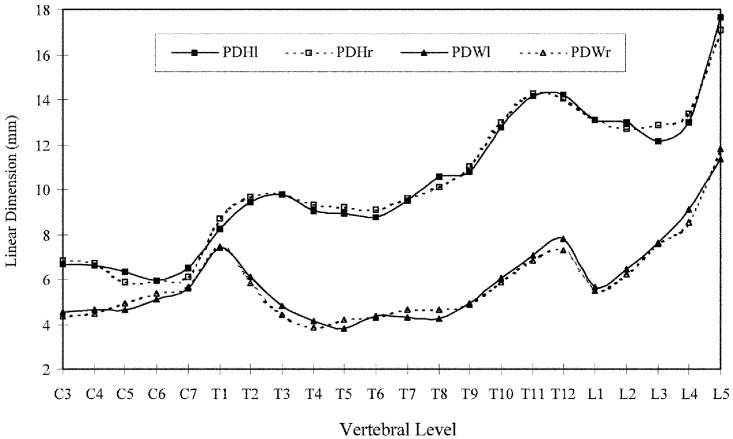
Linear dimensions of the pedicles as functions of vertebral levels C3–L5. The linear dimensions are the left (l) and right (r) pedicle height (PDH) and width (PDW)
Fig. 8.
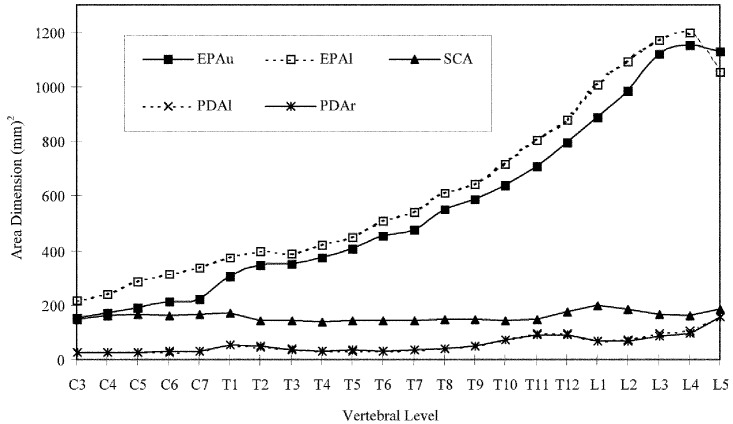
Areas of end-plates, spinal canal and pedicles as functions of vertebral levels C3–L5. The areas are the upper (u) and lower (l) end-plates (EPA), spinal canal (SCA), and left (l) and right (r) pedicle (PDA)
Fig. 9.
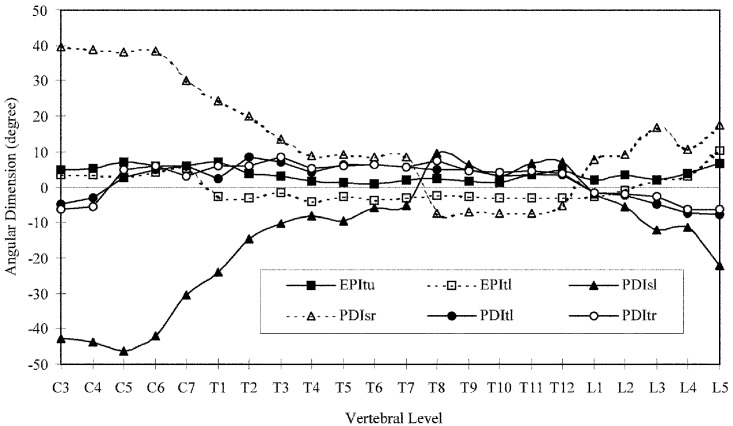
Angular dimensions of the end-plates and pedicles as functions of vertebral levels C3–L5. The angles are the upper (u) and lower (l) end-plate transverse inclinations (EPI), and the left (l) and right (r) pedicles, and sagittal (s) and transverse (t) inclinations (PDI)
Linear parameters
The linear parameters of the vertebral body are the upper and lower end-plate width (EPW) and depth (EPD), and the anterior and posterior vertebral body height (VBH) (Fig. 5). From C3 to C5, the EPW, EPD and VBH are fairly constant before increasing to T1. The increase in the EPW is more drastic compared to that of the EPD and VBH, both of which have almost a similar trend. The posterior VBH and lower EPW and EPD are larger than their respective counterparts.
There is a slight decrease from T1 to T4, followed by an increase to T12 for the upper and lower EPW. The EPD increases in a linear manner from T1 to T12. The lower parameters are generally larger than the upper parameters. The trend of the VBH is similar to that of the EPD. The posterior VBH are larger than the anterior VBH due to the wedge shape of the vertebra, which defines the kyphotic curve in the thoracic spine.
There is a constant increase from L1 to L4, followed by a dip to L5 for the upper and lower EPW. The EPD are relatively constant throughout the lumbar spine. The lower parameters are generally larger than the upper parameters. The posterior VBH is higher than the anterior VBH, except at L5. This is due to the wedge shape of the vertebra, which defines the spinal curvature in the lumbar region.
The linear parameters of the spinal canal are the lateral width (SCW) and the anteroposterior depth (SCD), while those of the process are the spinous process length (SPL) and the transverse process length (TPL) (Fig. 6). Both the SCW and SCD are almost constant from C3 to C6. The former starts to decrease quite steeply into the thoracic spine, while the latter increases very gradually. The smallest SCW of 10.3 mm occurred at C3–C6. Both the SPL and TPL exhibit a similarly steep increasing trend.
The SCW decreases by about 5 mm from T1 to T4, remaining relatively constant thereafter to T10 before increasing to T12. The SCD is almost constant throughout the thoracic spine. The narrowest portion in the SCD and SCW parameter occurs at the T4–T5 transition, with an average value of 11.5 and 13.5 mm, respectively. The values for the SPL are almost constant. The TPW exhibits a steep decrease from T1 to T5, before remaining almost constant to T8 and thereafter decreasing gradually to T12.
The SCW is almost constant from L1 to L3 and increases towards a maximum of 23.5 mm at L5. The SCD exhibits a gradual decreasing trend from L1 to L5, with an average value of 11.4 mm at L5. The trend of the SPL is parabolic. The TPL exhibits a drastic increase in the lumbar spine, with a maximum of 71.4 mm at L3.
The linear parameters of the pedicle are the cross-sectional height (PDH) and width (PDW) (Fig. 7). The values of the left and right parameters of height or width are close to each other. Both the left and right PDH decrease gradually from C3 to a minimum of 6 mm at C6, and increase thereafter. The left and right PDW exhibit an increasing trend into the thoracic spine.
Both the left and right parameters of height or width have values close to each other. From T3 to T12, both the PDH and PDW have the same trend, i.e. remaining almost constant from T3 to T7 before increasing to T12. The main difference is in the first three vertebrae. The pedicle height increases from T1 to T3, but the reverse is true for the pedicle width. The pedicle height is consistently larger than the width.
For the lumbar spine, both the left and right parameters of height or width have values close to each other. The pedicle width increases steeply from L1 to a maximum mean of 11.6 mm at L5. The pedicle height remains relatively constant from L1 to L4 before increasing steeply to a maximum mean of 17.4 mm at L5. The pedicle height is consistently larger than the width.
Area parameters
The area parameters are the upper and lower end-plate area (EPA), spinal canal area (SCA) and left and right pedicle cross-sectional area (PDA) (Fig. 8). The EPA increases from C3 to C7, with the smallest area of about 155 mm2 at the upper EPA at C3. The upper area is always larger than the lower area for each vertebra. The trend of both the PDA and SCA is generally similar, i.e. almost constant throughout the cervical spine.
The upper and lower EPA increases steeply from T1 to T12. It is evident that the EPA is small from the cervico-thoracic transition, increasing steadily to the thoraco-lumbar transition. The lower EPA is consistently larger than its respective upper EPA. The SCA decreases very gradually from the cervico-thoracic transition to the middle thoracic region where it experiences the narrowest canal opening before increasing into the lumbar region. The SCA is smallest at T4, with an average value of about 140 mm2. The PDA decreases gradually from T1 to T5 before increasing to T12. This is not surprising because both the height and width also increase.
The upper and lower EPA increase rather sharply from L1 to L4 before tapering off at L5. The lower EPA of L4 is the largest at about 1,200 mm2. The SCA decreases gradually from L1 to L4 and then increases slightly to L5. The smallest SCA of about 164 mm2 is found at L4. The PDA increases gradually from L1 to L5. This is not surprising because both the height and width also increase.
Angular parameters
The angular parameters are the upper and lower end-plate inclination (EPI) and the pedicle sagittal (PDIs) and transverse (PDIt) inclination (Fig. 9). Both the lower and upper EPI of the cervical vertebrae are angled cephalad at a constant inclination. The former is always smaller than the latter. The PDIs of the pedicles of C3–C6 has a rather constant mean maximum divergence of about 40 . From C6 onwards, the pedicles begin to converge. The PDIt angled caudally from C3 to C4 and then reversed into a constant cephalad with the transition at C4–C5.
The EPI are in opposite sense throughout the thoracic spine. The upper EPIt has a sharper cephalad inclination at the upper and lower region of the thoracic spine. The steep convergence of the PDIs begins from T1 to T7. Thereafter, shallow divergence occurs from T8 to T12, with the transition at T7–T8. The largest divergence is seen at T1 with a mean of 24°. The largest divergent angle of the pedicle inclination occurred at T8 with a mean of 8.6°. The PDIt are angled rather constantly in a cephadad manner throughout the thoracic spine, with the largest mean angle of 7.8° at T3.
In the lumbar spine, the upper EPI increases in a cephalad manner. The lower EPI increases caudally from L1 to L2, and then increases cephalad to L5 with the transition at L2–L3. The pedicles diverge increasingly from L1 to L5, with the maximum mean of 19.9° at L5. The PDIt increases caudally from L1 to L5, with a mean maximum of 7° at L5.
Discussion
Selected parameters obtained in the present study and those from Panjabi et al. [13, 14, 15] are compared and tabulated in Table 2 using the Caucasian parameter as the reference.
Table 2.
Comparison of measurements from the present study with those from Panjabi et al. [13, 14, 15]a (see Fig. 1 for nomenclature)
| Parameter | Vertebral level | ||||||||||||||||||||||
|---|---|---|---|---|---|---|---|---|---|---|---|---|---|---|---|---|---|---|---|---|---|---|---|
| C3 | C4 | C5 | C6 | C7 | T1 | T2 | T3 | T4 | T5 | T6 | T7 | T8 | T9 | T10 | T11 | T12 | L1 | L2 | L3 | L4 | L5 | Average | |
| Difference compared with Panjabi et al. (%) | |||||||||||||||||||||||
| EPWu | −12.7 | −14.5 | −14.9 | −14.6 | −12.8 | +0.8 | −5.2 | −5.3 | −8.2 | −6.4 | −9.5 | −11.5 | −12.2 | −11.8 | −9.7 | −9.5 | −11.5 | −11.9 | −10.3 | −9.5 | −9.9 | −12.1 | −10.2 |
| EPWl | −16.9 | −11.8 | −18.0 | −11.4 | −13.2 | −2.5 | −9.0 | −10.9 | −3.5 | −8.5 | −12.1 | −7.9 | −8.5 | −11.5 | −9.9 | −9.7 | −13.5 | −9.5 | −9.0 | −9.4 | −8.5 | −11.5 | −10.4 |
| EPDu | −9.3 | −8.5 | −5.9 | −11.0 | −16.6 | −19.5 | −16.8 | −20.7 | −18.9 | −15.6 | −16.1 | −17.2 | −16.5 | −16.7 | −16.7 | −20.4 | −18.6 | −19.4 | −18.2 | −15.1 | −13.2 | −12.4 | −15.6 |
| EPDl | −3.2 | −4.4 | −15.6 | −15.1 | −7.1 | −19.8 | −18.1 | −18.5 | −18.4 | −16.3 | −14.5 | −17.5 | −16.0 | −17.7 | −17.1 | −15.4 | −17.1 | −19.3 | −16.3 | −13.2 | −10.6 | −13.6 | −14.7 |
| VBHp | −3.4 | −0.8 | −0.8 | +3.7 | −7.8 | −0.7 | −2.6 | −6.2 | −2.5 | +1.2 | −2.3 | −4.4 | −4.8 | −6.7 | −5.5 | −4.2 | +0.9 | −5.9 | −4.9 | −7.1 | −10.4 | −12.7 | −4.0 |
| SCW | −16.2 | −21.9 | −18.5 | −20.7 | −19.6 | −18.8 | −22.1 | −22.4 | −20.6 | −20.5 | −20.2 | −19.7 | −20.3 | −20.7 | −22.0 | −21.1 | −19.4 | −18.1 | −18.1 | −20.2 | −20.5 | −13.7 | −19.8 |
| SCD | −36.4 | −41.8 | −40.8 | −43.1 | −27.6 | −29.3 | −23.5 | −24.5 | −27.2 | −29.5 | −29.7 | −26.1 | −25.2 | −24.8 | −23.2 | −26.3 | −31.5 | −34.2 | −35.7 | −36.0 | −39.8 | −42.1 | −31.8 |
| PDHl | −6.9 | −9.6 | −13.7 | −20.0 | −13.3 | −16.2 | −19.0 | −18.3 | −26.2 | −21.9 | −25.0 | −22.1 | −15.2 | −21.7 | −14.7 | −20.2 | −15.5 | −17.1 | −12.8 | −17.1 | −14.5 | −9.2 | −16.8 |
| PDHr | −10.5 | −9.5 | −11.9 | −15.5 | −18.7 | −6.5 | −13.5 | −16.9 | −21.9 | −17.9 | −24.2 | −18.6 | −19.2 | −20.9 | −11.6 | −15.4 | −15.2 | −17.6 | −15.3 | −9.2 | −14.7 | −12.8 | −15.4 |
| PDWl | −16.7 | −9.8 | −7.9 | −8.9 | −13.9 | −14.9 | −22.8 | −26.2 | −41.4 | −33.3 | −26.7 | −17.3 | −35.8 | −35.1 | −38.1 | −33.6 | −9.3 | −39.1 | −26.4 | −24.8 | −38.1 | −41.1 | −25.5 |
| PDWr | −24.1 | −21.1 | −19.7 | −14.3 | −13.6 | −8.5 | −31.0 | −37.1 | −29.1 | −32.3 | −28.3 | −29.2 | −29.9 | −35.5 | −28.9 | −21.6 | −17.1 | −31.3 | −20.5 | −25.5 | −35.8 | −34.4 | −25.9 |
| SPL | −13.5 | +0.0 | +17.8 | +18.4 | +2.6 | −3.6 | −7.3 | −5.2 | −5.3 | −4.4 | −5.8 | +2.6 | −1.7 | −0.4 | +1.0 | +6.1 | +2.3 | −23.0 | −24.1 | −19.7 | −21.4 | −25.9 | −5.5 |
| TPW | −17.7 | −7.4 | +2.6 | −2.2 | −19.2 | −15.3 | −17.2 | −15.6 | −12.5 | −20.0 | −18.1 | −17.7 | −20.2 | −16.2 | −22.3 | −17.6 | −12.6 | −24.7 | −15.5 | −16.7 | −14.7 | −22.9 | −15.6 |
| EPAu | −8.7 | −7.5 | +2.5 | −4.8 | −20.7 | +1.6 | +4.4 | −5.4 | −1.9 | −4.1 | −6.4 | −12.8 | −8.6 | −13.3 | −11.8 | −16.0 | −16.6 | −15.8 | −13.4 | −6.4 | −7.0 | −8.9 | −8.3 |
| EPAl | +13.7 | +21.2 | +16.3 | +9.1 | +21.2 | −0.9 | −0.3 | −6.0 | −5.4 | −9.1 | −8.2 | −10.0 | −8.1 | −14.5 | −14.2 | −15.0 | −14.3 | −9.6 | −8.9 | −9.2 | −5.8 | −13.5 | −3.3 |
| SCA | −39.8 | −41.2 | −33.1 | −38.6 | −25.2 | −20.5 | −17.3 | −19.2 | −27.1 | −29.6 | −29.7 | −27.6 | −23.7 | −27.0 | −29.7 | −32.3 | −36.4 | −37.5 | −34.5 | −40.7 | −43.5 | −43.3 | −31.7 |
aThe value from Panjabi et al. is used as the reference
For the vertebral body, the EPW, EPD, VBHp, and EPAu are smaller by an average of 10.3%, 15.2%, 4.0% and 8.3%, respectively. The mean maximum difference is 16.5% at C5, 19.7% at T1, 12.7% at L5 and 20.7% at C7, respectively. Although smaller by 3.3% on average, the EPAl of C3–C7 are actually larger by 16.3% on average. The trends of the above vertebral body parameters are similar in both studies.
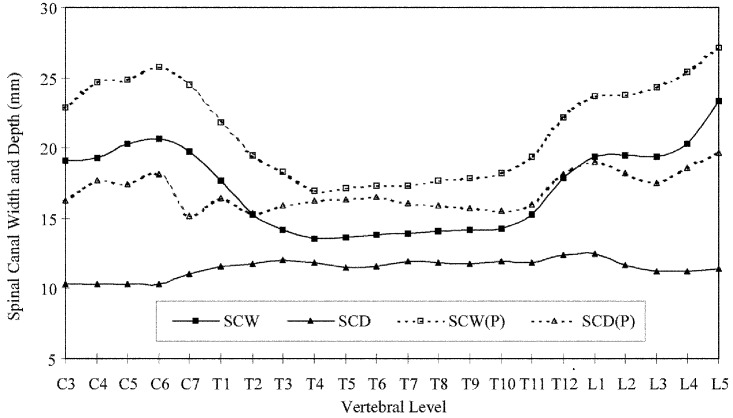
For the spinal canal parameters, the mean difference is about −19.8% for the SCW and −31.8% for the SCD. This is reflected in the large mean difference of −31.7% in the SCA, with the largest difference of −43.5% at L4 instead of L3 as reported by Panjabi et al. [14]. The trend of the SCW and SCD, and hence the SCA, was found to be different in the present study, as shown in Fig. 10. In the thoracic spine, the smallest SCA is located at T4 (140.1 mm2) instead of T3 as reported by Panjabi et al. [15]. This middle region is important because it is the critical vascular zone for the spinal cord. It has the narrowest opening, and blood supply to the spinal cord is least profuse [2]. The considerable decrease in SCD and SCA may affect surgical management of the spine, especially low back pain in the lumbar spine, in the population studied.
Fig. 10.
Comparison of the spinal canal width (SCW) and depth (SCD) of the present study with that of Panjabi et al. [13, 14, 15]. The results from the latter are represented by P
Using the average of the right and left measurements, the mean difference for the PDH and PDW is −16.1% and −25.7%, respectively, when compared to the Caucasian values. The difference in the latter is rather significant because most of the existing spinal implants have been developed on the basis of measurements obtained from Caucasians and may not produce the desired and best effect in the population studied. It should be pointed out that, except for T1 and T10–L5, the pedicle width is not wide enough to accommodate a 5-mm transpedicle screw (Table 1). The maximum difference of about −41% is found in the PDWl at T4 and L5. On average, the SPL and TPW are smaller by 5.5% (maximum of 25.9% at L5) and 15.6% (maximum of 24.7% at L1), respectively. However, the SPL of C5–C7, T7 and T10–T12 is slightly larger.
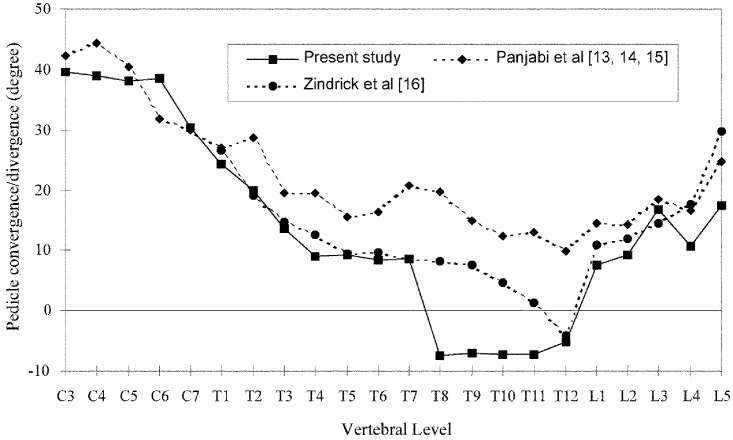
Figure 11 shows the comparison of the PDIs from the present study with those from Panjabi et al. [13, 14, 15] and Zindrick et al. [16]. The study by the latter did not include the cervical spine. Except for T8–T12, the trend is in agreement with the Caucasian spine in general. The slight divergence of about 7° from T8 to T12 is a significant difference to the Caucasian thoracic spine and may affect the pedicle screw placement procedure. In terms of percentage difference, the values are too high to be meaningful and are indicated in Table 3. It is interesting to note that the divergence at T4 was also found in the study by Zindrick et al. [16].
Fig. 11.
Comparison of the pedicle sagittal inclination (PDIs) of the present study with that of Panjabi et al. [13, 14, 15] and Zindrick et al. [16]
Table 3.
Comparison of pedicle sagittal inclination PDIs
| Vertebral level | Difference compared with Panjabi et al. [13, 14, 15] (%) | Difference compared with Zindrick et al. [16] (%) |
|---|---|---|
| C3 | −6.4 | - |
| C4 | −12.2 | - |
| C5 | −5.5 | - |
| C6 | 20.6 | - |
| C7 | 1.3 | - |
| T1 | −10.0 | −8.3 |
| T2 | −30.4 | 4.2 |
| T3 | −29.9 | −6.8 |
| T4 | −53.8 | −28.6 |
| T5 | −41.0 | −2.1 |
| T6 | −48.8 | −12.5 |
| T7 | −58.5 | −1.1 |
| T8 | a | a |
| T9 | a | a |
| T10 | a | a |
| T11 | a | a |
| T12 | a | 26.2 |
| L1 | −47.6 | −30.3 |
| L2 | −35.2 | −23.3 |
| L3 | −9.2 | 16.7 |
| L4 | −35.5 | −39.5 |
| L5 | −29.3 | −41.7 |
aValue is too large to be meaningful
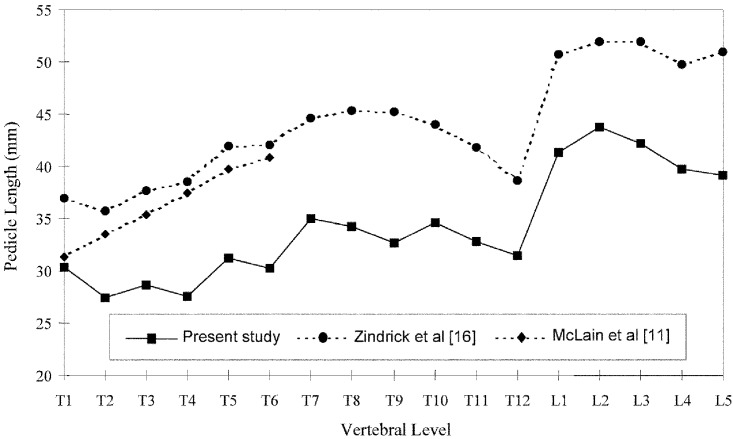
The comparison of the pedicle length from the present study with those from McLain et al. [11] and Zindrick et al. [16] is shown in Fig. 12. The study by the former involved only the upper thoracic spine. The pedicle lengths defined in all the studies concerned are similar, i.e. the distance from the facet cortex to the anterior cortex in the line of the pedicle sagittal inclination PDIs (Fig. 1a–c). The general trend of the pedicle length is the same in all the studies, although McLain et al. [11] found that the increase is almost linear. The pedicle length of the thoracic and lumbar vertebrae is significantly shorter than the Caucasian counterparts, and the quantitative difference is tabulated in Table 4. In the cervical spine, the average difference from McLain et al. [11] may be smaller due to the cadavers used (11 women and 7 men aged from 62 to 85 years). The greatest difference of −25.7% (from McLain et al. [11]) and 28% (from Zindrick et al. [16]) occurred at T6. The mean difference compared with the latter is –22.1%. The maximum pedicle length of the upper thoracic spine (T1–T6) is 30.4 mm (Table 1). In view of the rather small pedicle width PDW mentioned earlier, the use of a transpedicle screw may not be suitable for the population studied.
Fig. 12.
Comparison of the pedicle length (PL) of the present study with that of McLain et al. [11] and Zindrick et al. [16]
Table 4.
Comparison of pedicle length PL
| Vertebral level | Difference compared with McLain et al. [11] (%) | Difference compared with Zindrick et al. [16] (%) |
|---|---|---|
| T1 | −2.9 | −17.6 |
| T2 | −17.9 | −23.0 |
| T3 | −19.2 | −24.1 |
| T4 | −26.2 | −28.3 |
| T5 | −21.6 | −23.5 |
| T6 | −25.7 | −28.0 |
| T7 | - | −21.5 |
| T8 | - | −24.4 |
| T9 | - | −27.7 |
| T10 | - | −21.4 |
| T11 | - | −21.5 |
| T12 | - | −18.4 |
| L1 | - | −18.3 |
| L2 | - | −15.6 |
| L3 | - | −18.7 |
| L4 | - | −20.1 |
| L5 | - | −23.1 |
Conclusion
A comprehensive study of the three-dimensional quantitative anatomy of cervical, thoracic and lumbar vertebrae of Chinese Singaporeans is presented in this paper. Selected linear dimensions, angulations and areas obtained are compared with a similar study performed on Caucasian specimens. The comparison revealed that the quantitative dimensions are generally smaller than the respective values of the Caucasian specimens. The significant difference in the spinal canal area (especially in the lumbar spine) should be considered during clinical treatment and management, especially for low back pain. The use of a transpedicle screw may not be feasible in view of the slight divergence of the pedicle sagittal inclination in the upper thoracic spine, shorter pedicle length in the upper thoracic spine and much smaller pedicle width in a large part of the thoracic spine. The quantitative and comparative findings can hopefully provide more accurate modelling and information in the design of spinal implants and surgical instruments for the surgical management of the spine of the population studied.
References
- 1.DanielSpine 19861123704777 [Google Scholar]
- 2.Dommisse J Bone Joint Surg. 1974;56B:225. [PubMed] [Google Scholar]
- 3.Dresher Spine. 2002;2:151. doi: 10.1016/S1529-9430(02)00155-9. [DOI] [Google Scholar]
- 4.Ebraheim Spine. 1996;21:1296. doi: 10.1097/00007632-199606010-00003. [DOI] [PubMed] [Google Scholar]
- 5.George Spine. 2001;1:190. doi: 10.1016/S1529-9430(01)00030-4. [DOI] [Google Scholar]
- 6.Kovac Int. 2001;Orthop:66. doi: 10.1007/s002640100233. [DOI] [PMC free article] [PubMed] [Google Scholar]
- 7.Laporte Eur J Orthop Surg Traumatol. 2000;10:85. [Google Scholar]
- 8.Liljenqvist Eur Spine J. 2002;11:336. doi: 10.1007/s00586-002-0415-9. [DOI] [PMC free article] [PubMed] [Google Scholar]
- 9.Machleder Ann Vasc Surg. 1997;11:359. doi: 10.1007/s100169900061. [DOI] [PubMed] [Google Scholar]
- 10.McLain Spine. 2001;1:310. doi: 10.1016/S1529-9430(01)00101-2. [DOI] [Google Scholar]
- 11.McLain Spine. 2002;27:2467. doi: 10.1097/00007632-200211150-00009. [DOI] [PubMed] [Google Scholar]
- 12.Muschik Eur Spine J. 1999;8:93. doi: 10.1007/s005860050136. [DOI] [PMC free article] [PubMed] [Google Scholar]
- 13.Panjabi Spine. 1991;16:861. doi: 10.1097/00007632-199108000-00001. [DOI] [PubMed] [Google Scholar]
- 14.Panjabi Spine. 1992;17:299. doi: 10.1097/00007632-199203000-00010. [DOI] [PubMed] [Google Scholar]
- 15.Panjabi Spine. 1991;16:888. doi: 10.1097/00007632-199108000-00006. [DOI] [PubMed] [Google Scholar]
- 16.Zindrick Spine. 1987;12:160. doi: 10.1097/00007632-198703000-00012. [DOI] [PubMed] [Google Scholar]


