

Abstract
The carotid body (CB) is the key oxygen sensing organ. While the expression of CB specific genes is relatively well studied in animals, corresponding data for the human CB are missing. In this study we used five surgically removed human CBs to characterize the CB transcriptome with microarray and PCR analyses, and compared the results with mice data. In silico approaches demonstrated a unique gene expression profile of the human and mouse CB transcriptomes and an unexpected upregulation of both human and mouse CB genes involved in the inflammatory response compared to brain and adrenal gland data. Human CBs express most of the genes previously proposed to be involved in oxygen sensing and signalling based on animal studies, including NOX2, AMPK, CSE and oxygen sensitive K+ channels. In the TASK subfamily of K+ channels, TASK-1 is expressed in human CBs, while TASK-3 and TASK-5 are absent, although we demonstrated both TASK-1 and TASK-3 in one of the mouse reference strains. Maxi-K was expressed exclusively as the spliced variant ZERO in the human CB. In summary, the human CB transcriptome shares important features with the mouse CB, but also differs significantly in the expression of a number of CB chemosensory genes. This study provides key information for future functional investigations on the human carotid body.
Key points
The carotid body (CB) is the key oxygen sensor and governs the ventilatory response to hypoxia.
CB oxygen sensing and signalling gene expression is well described in animals whereas human data are absent.
Here we have characterized the human CB global gene expression in comparison with functionally related tissues and mouse CB gene expression.
We show that the human CB expresses oxygen sensing genes in common with mice but also differs on key genes such as certain K+ channels. There is moreover increased expression of inflammatory response genes in human and mouse CBs in comparison with related tissues.
The study establishes similarities but also important differences between animal and human CB gene expression profiles and provides a platform for future functional studies on human CBs.
Introduction
The carotid body (CB) is the primary oxygen sensor in mammals, located in the carotid bifurcation and composed of chemosensory neuron-like type 1 cells, which respond to acute changes in arterial oxygenation. During evolution, there is a striking species-dependent redistribution of oxygen sensing chemoreceptor cells from multiple sites in aquatic or bimodal respiratory animals to the direction of a single oxygen sensory site in air breathing mammals and man (Milsom & Burleson, 2007). Notably, most vertebrates have oxygen sensitive cells involved in regulation of breathing both in the carotid and aortic bodies, while in humans only the CBs seem to be involved in regulation of breathing during hypoxia (Fitzgerald & Lahiri, 1986; Milsom & Burleson, 2007). While the developmental reorientation of oxygen sensing and signalling involves the loss of oxygen sensing at multiple sites, the primary molecules involved in oxygen sensing and signalling are generally well preserved between species (Nurse, 2005). Although the exact mechanisms of CB oxygen sensing are not fully known, certain common components have been identified in many species. For example, hypoxia typically leads to the inhibition of O2 sensitive K+ channels (e.g. Maxi-K and/or TASK-like (TWIK-related acid sensitive K+ channel) channels) (Peers et al. 2010). The candidate molecules and processes involved in such hypoxia-induced modification of K+ channel function are gasotransmitters, such as CO (carbon monoxide), NO (nitric oxide) and H2S (hydrogen disulfide), as well as the AMP activated protein kinase (AMPK), which phosphorylates the K+ channel(s) (Prabhakar, 1999; Wyatt et al. 2007; Hou et al. 2009; Peng et al. 2010; Telezhkin et al. 2010). The synthesis and/or modification of these signalling molecules are accomplished by haem oxygenase-2 (HO-2), NO synthase (NOS-1), cystathionine γ-lyase (CTH/CSE) or cystathione-β-synthase (CBS) (Prabhakar, 1999; Williams et al. 2004; Gadalla & Snyder, 2010). Reactive oxygen species (ROS), which are generated by a family of NADPH oxidase (NOX) enzymes or in the mitochondria (Brown & Griendling, 2009; Lassegue & Griendling, 2010), have also been proposed as primary oxygen sensors. In addition to these biosynthetic and bioenergetic sensors, several authors have proposed so called conformational sensors, i.e. sensors that upon hypoxic activation undergo conformational changes that in turn can affect for example K+ channels (Gonzalez et al. 1994; McCartney et al. 2005; Park et al. 2009). Activation of these oxygen sensing pathways initiates a synchronous release of multiple neurotransmitters, which, via the activation of the carotid sinus nerve, ultimately trigger central respiratory neuronal circuits involved in regulation of breathing. Besides the important function in oxygen sensing, the rodent CB has recently been found to respond to inflammatory cytokines, thereby transferring information on peripheral inflammation to the CNS (Zapata et al. 2011). Thus, the CB has been proposed to have a regulatory role in the inflammatory response (Tracey, 2002).
Despite the evolutionary conservation of oxygen sensory and signal transduction mechanisms, there is still considerable uncertainty regarding the identity of primary oxygen sensor(s), as well as their expression in different species (Peers et al. 2010). Moreover, there is a conspicuous lack of knowledge on the oxygen sensing mechanisms of the human CB, the shortcoming entirely dependent on the lack of human CB tissue. Consequently, notwithstanding the wealth of data from animal studies, understanding the molecular mechanisms of oxygen sensing in the human CB requires detailed mapping of the human orthologues of candidate oxygen sensory genes in human tissue samples. In a recent publication on human CB gene expression we focused on the oxygen signalling genes (Fagerlund et al. 2010). The aim of this study was to make a comprehensive characterization of the whole human CB transcriptome and to compare the expression of key genes involved in oxygen sensing with corresponding mouse data (Ganfornina et al. 2005; Balbir et al. 2007).
Methods
Ethical approval
This study was approved by the local ethics committee on human research at Karolinska Institutet, Stockholm, Sweden and the Animal Care and Use Committees of the University of Valladolid, Spain and Johns Hopkins University, Baltimore, USA. The study protocol follows the guidelines stated by Karolinska Institutet, University of Valladolid and the National Institute of Health in the USA (Guide for the Care and Use of Laboratory Animals), for research on humans and animals. All patients gave their written informed consent and the study was performed in agreement with the standards of the 2008 revision of the Declaration of Helsinki.
Patients and tissue samples
Five patients (A–E) scheduled for unilateral neck dissection due to head and neck cancer were included in the study. None of the patients had received radiation or chemotherapy prior to surgery or had a tumour involving the CB and none were using nicotine. Exclusion criteria were severe cardio-pulmonary (New York Heart Association >2), neurological or metabolic disease and smoking. Demographic data are presented in Table 1.
Table 1.
Demography of the patients included in the study
| Patient | Sex (male/female) | Age (years) | BMI | ASA physical score (1–4) |
|---|---|---|---|---|
| A | M | 68 | 19.6 | 1 |
| B | M | 64 | 31.1 | 2 |
| C | M | 56 | 23.5 | 1 |
| D | M | 43 | 27.8 | 1 |
| E | F | 57 | 26.0 | 2 |
Sex (male/female), age (years), BMI (body mass index) and ASA physical score (1–4) according to the American Society of Anaesthesiologists classification, a system to stratify the severity of a patient's underlying disease and thereby risk of complications from general anaesthesia.
Under general anaesthesia with sevoflurane and opioids, and under normoxic and normocarbic mechanical ventilation, the CBs were surgically removed during elective unilateral neck dissection. After removal, the CBs (weight range 46–81 mg) were divided into pieces of equal size and immediately either frozen in liquid nitrogen for RNA isolation or fixed in 4% paraformaldehyde at 4°C for haematoxylin–eosin staining. Three of these CBs (patients A–C) were analysed in a previous study that focused on the expression of individual oxygen signalling genes (Fagerlund et al. 2010).
Haematoxylin–eosin staining
After fixation in 4% paraformaldehyde for 2–4 h, the CB pieces were cryoprotected in 30% sucrose in phosphate-buffered saline (PBS) at 4°C for 3–4 days, frozen in O.C.T. (TissueTek, Sakura, Zueterwoude, Netherlands) and stored at −80°C. Fourteen-micrometre sections were cut on a cryostat and mounted onto microscope slides (Kahlin et al. 2010). Slides were subsequently stained with haematoxylin and eosin (Histolab, Gothenburg, Sweden) and the cellular structures of the CB were identified with light microscopy using a Zeiss Axioscope 2, equipped with an Axiocam digital camera (Zeiss, Munich, Germany; Kahlin et al. 2010).
Total RNA extraction and purification
Pieces of CBs (20–35 mg) were immediately frozen and stored at –80°C until RNA isolation. Samples were homogenized in 1 ml of TRIzol (Invitrogen, Eugene, OR, USA) and total RNA was extracted with chloroform and isolated using the RNAeasy kit according to the manufacturer's recommendations (Invitrogen, Eugene, OR, USA) as described previously (Fagerlund et al. 2010). RNA quality was assessed using the Agilent 2100 bioanalyzer and the associated RNA 6000 Nano and Pico LabChip kits (Agilent Technologies, Palo Alto, CA, USA). The RNA samples with RNA Integrity Number (RIN) higher than 5.5 were used for further microarray analysis.
Microarray analysis of the human CB
RNA was labelled and hybridized according to the standard Affymetrix procedure (Affymetrix, Santa Clara, CA, USA) at the Karolinska Institute's Bioinformatics and Expression core facility (http://www.bea.ki.se/affymetrix) using Affymetrix Human Genome U133 2.0 Plus oligonucleotide microarrays (Fagerlund et al. 2010).
The RNA hybridization intensity signals were analysed using Affymetrix Microarray Suite (MAS) software to estimate the expression values for each probe. Using the statistical detection algorithms in MAS 5.0, we differentiated the transcripts that were reliably detected (present or marginally present expression calls) from the transcripts below the threshold of detection and therefore considered as absent. In addition, the number of expressed genes was estimated with ‘The Gene Expression Barcode’ software (McCall et al. 2011) (http://rafalab.jhsph.edu/barcode/index.php?page=intro) using the raw gene expression data (CEL files) produced by the Affymetrix GeneChip Command Console software.
Mouse CB microarray data
Raw global gene expression data (Affymetrix CEL files) from the CBs of normoxic control mice (Ganfornina et al. 2005; Balbir et al. 2007) were used for differential gene expression analysis to determine the tissue gene expression profile and to extract the expression calls for CB oxygen sensing genes. These data were not presented in the original publications.
In the first study, RNA from normoxic control C57BL/6J01aHsd mice CBs was hybridized to the Affymetrix Mouse MOE430A GeneChip array. RNA quality and purity in this study had been assessed by OD measurement at 260 and 280 nm, and by electrophoresis on agarose gels. No signs of RNA degradation were present, and ribosomal RNAs were observed in the agarose gels as tight bands (Ganfornina et al. 2005). In the other study, RNA from two different mice strains had been hybridized to the Affymetrix Mouse Genome 430 v.20 GeneChip array. We used the microarray results from the normoxic DBA/2J mice, which are high responders to hypoxia (Balbir et al. 2007). RNA integrity had been assessed using the Agilent 2100 bioanalyzer (Balbir et al. 2007).
In silico comparative analysis of microarray data
The CB gene expression tissue profile was evaluated using the Barcode online resource that compares the raw data (CEL files) with the pre-computed transcriptomes of different cell types (Sample Processing). Seven whole human brain and seven human adrenal gland gene expression samples from NCBI Gene Expression Omnibus (GEO) and ArrayExpress databases were used as reference sets. These data sets from four different laboratories were obtained using the same Affymetrix Human Genome U133 2.0 Plus oligonucleotide microarrays that were used in this study, with similar or identical methods for isolation, labelling and hybridization of RNA. Details can be extracted using the GEO browser (http://www.ncbi.nlm.nih.gov/sites/GDSbrowser/) with the following GEO IDs: human whole brain tissue samples: GSM187156, GSM187170, GSM187180, GSM379859, CEL GSM379862, GSM397660, GSM397659, human adrenal gland samples: GSM211447, GSM211448, GSM211449, GSM310491, GSM703788, GSM310488, GSM211450. The Barcode based tissue profiling was verified with the DAVID online bioinformatics resource (Huang et al. 2009; http://david.abcc.ncifcrf.gov).
Differential gene expression analyses of the human CB versus human brain or adrenal gland data sets (see above), and mouse CB versus mouse brain (mouse whole brain GEO IDs: GSM139538, GSM511621, GSM511622, GSM511623, GSM511624) were carried out using an open source integrated microarray database and analysis suite, WebArrayDB (Wang et al. 2009; http://www.webarraydb.org) that allows a differential analysis of the submitted microarray raw data with the data sets available in public repositories. Taking the limitations of this in silico analysis into account, we applied a stringent inclusion threshold for the evaluation of differential gene expression, i.e. P < 0.01 and fold change >5. The ensuing lists of upregulated and downregulated genes were analysed for the Gene Ontology (GO) term enrichment using the functional annotation tool from DAVID, and also with the WEB-based GEne SeT AnaLysis Toolkit (WebGestalt) (http://bioinfo.vanderbilt.edu/webgestalt).
PCR
Total RNA (0.5 μg) isolated from the human CBs was used in a complementary DNA (cDNA) synthesis reaction utilizing the SuperScript II First-Strand Synthesis System for RT-PCR (Invitrogen, Eugene, OR, USA) and oligo(dT) primers. The resulting cDNA was amplified using Applied Biosystems 7500 Real Time PCR System. Twenty-five microlitres of amplification reaction included 200 ng of cDNA template, TaqMan Universal Master Mix and TaqMan Gene Expression Assays for one of the following genes (catalog no.): TH (Hs01002182_m1), TBP (4333769F), TASK-1 (Hs00605529_m1), TASK-3 (hs00363153_m1), Maxi-K (Hs00266938_m1), Maxi-K Strex (Hs01121124_m1), HO-2 (Hs00157969_m1), NOX2 (Hs00166163_m1), NOS1 (Hs00167223_m1), CBS (Hs00163925_m1), CSE (Hs00542284_m1) and AMPK (Hs01562308_m1). All samples were amplified in triplicates. The relative abundance (R) of each transcript was estimated according to the common ΔCt method using the following formula:
Ct is the mean critical threshold, i.e. the PCR cycle number at which the increase in fluorescence is exponential. The Ct value of 40 of the no-template control (NTC) was used as an arbitrary reference point, against which the sample Ct values were compared (subtracted). Assuming that the efficiency of the PCR reaction was 100%, it corresponded to a 2-fold increase in amplicon amount with each cycle of PCR. With this assumption,  was used to determine the relative transcript abundance. These values were normalized to the reference housekeeping gene (TATA box binding protein, TBP) and then related to the expression of tyrosine hydroxylase (TH), an established marker for CB type 1 cells (Kline et al. 2002; Nurse & Fearon, 2002).
Human CB cDNA was also amplified with conventional PCR using the set of primers encompassing the putative Strex exon of Maxi-K (forward primer, 5′-CATTACCATGAGCTCAAGCAC, reverse primer, 5′-GTGCTTGAGCTCATGGTAATG). The resulting short PCR fragment (without the Strex exon) is indicative of the expression of the ZERO splice form, whereas the long amplicon is generated by the Strex isoform. In addition, we have used a set of primers specific only for Strex Maxi-K (forward primer, 5′-CACTTTCTTCTGTCTCTGTTAATG, used in combination with the reverse primer from the previous set, reverse primer, 5′-GAGCAATCATTAACAGAGACAG, used in combination with the forward primer from the previous set). The PCR conditions used were an annealing temperature of 60°C, 35 cycles and 1.0 mm MgCl2. The less stringent conditions used were an annealing temperatures of 55°C and 58°C, 40 cycles and 1.5 mm MgCl2.
Total RNA isolated from the DBA/2J mouse CBs was used to obtain cDNA in the same way as described for the human CBs. TASK-1 and TASK-3 were amplified using the primer sets and PCR conditions reported earlier (Ortega-Saenz et al. 2010). PCR fragments were resolved in a 1% agarose gel and visualized using the LAS 1000+ gel documentation system (Fujifilm).
Results
Morphology of the human CB
Pieces of the human CBs were cut and stained with hematoxylin–eosin for histological confirmation of the CB tissue. In all samples, the sections revealed typical CB appearance with dark type 1 cells arranged in an irregular cluster-like pattern, as described previously by us and others (Mills, 2007; Fagerlund et al. 2010) (Fig. 1). Tumour infiltration was not detected in any of the CBs.
Figure 1. Haematoxylin–eosin staining of the human carotid body.
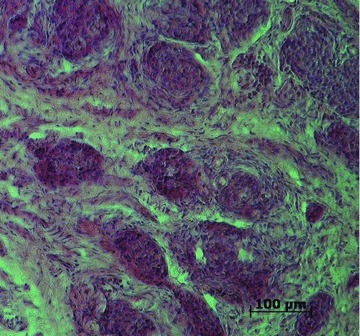
A representative section of the human carotid body stained with hematoxylin–eosin.
Microarray analysis of the human CB
The global gene expression in the five human CBs was studied using the oligonucleotide microarray technique. After data normalization with Affymetrix statistical algorithms the average gene expression level was estimated to ∼13,500 expressed genes according to the presence/absence expression qualification, which is comparable to the average number of expressed genes in a variety of human tissues (Ramskold et al. 2009). An alternative estimation was made with a novel methodology, The Gene Expression Barcode, an online tool that extracts information on expressed/unexpressed calls (barcode) for each gene from a single microarray, using a statistical model based on gene expression data from public repositories (McCall et al. 2011). The average number of genes as determined by Barcode was 8245, which is comparable with the gene expression levels of a magnitude of normal human tissues stored in the Barcode database (McCall et al. 2011).
Comparative gene expression analysis
Using the same Barcode online tool (McCall et al. 2011), we evaluated the uniqueness of the CB gene expression profile. This particular tool compares the uploaded gene expression raw data (CEL files produced by the Affymetrix software) with the pre-computed transcriptomes of different cell types, and reports back the distances between the sample-specific barcode and tissue type-specific transcriptome. Whole brain and adrenal gland (tissues sharing common developmental origin with the CB) gene expression data sets from public repositories (see Methods) were used as positive controls. Brain and adrenal gland samples demonstrated excellent matches to the transcriptomes of the corresponding tissues in the Barcode database (Table 2). However, no close resemblance to any of the cell types stored in the database was found for the human CB transcriptome, except for a weak similarity to a number of diverse tissues. The only tissue from the list that might be of a remote developmental/functional relevance to CB is the trigeminal ganglion, which shares same neural crest origin with the CB (Table 2). Further exploration using the DAVID online bioinformatics resource (Huang et al. 2009) provided similar results (data not shown). We also used the Barcode and DAVID tools to analyse the mouse CB transcriptomes and neither of these tools could find any explicit tissue matches, confirming the results for the human CB (data not shown).
Table 2.
Gene expression tissue profile of the human CB, brain and adrenal gland
| Sample Name | Number of genes expressed | Nearest tissues | Number of differentially expressed genes |
|---|---|---|---|
| Human CB | 8245 (genes expressed in 60% of uploaded samples) | Synovial membrane: normal | 891 |
| Myometrium: normal | 1020 | ||
| Adipose tissue: normal | 1058 | ||
| Urethra: normal | 1123 | ||
| Cervix: normal | 1127 | ||
| Ovary: normal | 1178 | ||
| Caecum: normal | 1200 | ||
| Vagina: normal | 1220 | ||
| Trigeminal ganglia: normal | 1244 | ||
| Skin: normal | 1278 | ||
| Human brain | 5289 (genes expressed in 60% of uploaded samples) | Temporal lobe: normal | 313 |
| Frontal lobe: normal | 341 | ||
| Cerebral cortex: normal | 352 | ||
| Parietal lobe: normal | 363 | ||
| Amygdala: normal | 364 | ||
| Occipital lobe: normal | 366 | ||
| Hippocampus: normal | 400 | ||
| Entorhinal cortex layer ii | |||
| Stellate island cells: normal | 426 | ||
| Entorhinal cortex: normal | 449 | ||
| Thalamus: normal | 469 | ||
| Human adrenal gland | 5898 (genes expressed in 60% of uploaded samples) | Adrenal cortex: normal | 509 |
| Caecum: normal | 895 | ||
| Adipose tissue: normal | 906 | ||
| Cervix: normal | 934 | ||
| Ovary: normal | 936 | ||
| Myometrium: normal | 948 | ||
| Skin: normal | 1023 | ||
| Pituitary gland: normal | 1039 | ||
| Vagina: normal | 1061 | ||
| Breast: normal | 1086 |
The raw gene expression data from human CBs, human whole brain tissue samples and adrenal gland tissue samples were analysed by the online Barcode tool that compares the uploaded the microarray raw gene expression data with the set of different tissue transcriptomes (see Methods). The number of differentially expressed genes correlates with the distance between the compared tissues (i.e. the similarity between gene expression profiles of two tissues increases with the decrease in the number of differentially expressed genes).
In addition to the qualitative estimation of the CB tissue signature, we aimed at a quantitative comparison of CB gene expression levels with tissues possessing similar chemosensory function and/or developmental origin, e.g. neonatal adrenal medulla cells, smooth muscle cells of the pulmonary artery or ganglia. Due to the lack of data sets in public repositories for these tissues, we conducted a differential gene expression analysis between the human CB and brain or adrenal gland tissues, and between the mouse CB and the mouse brain using the WebArrayDB (Wang et al. 2009).
The resulting lists with brain and adrenal gland tissue genes that were upregulated in comparison with the CB (Supplements S1–S4) were analysed with DAVID for gene ontology (GO) terms enrichment. As expected, these lists were enriched with GO groups functionally related to diverse brain and adrenal specific functions correspondingly (Supplements S5, S6). A different pattern of GO term distribution was observed in the CB versus brain and adrenal gland lists (Supplements S7, S8). Interestingly, besides the GO terms of more general significance, these lists were enriched with genes related to angiogenesis and the inflammatory response (Table 3). In addition, a number of the CB versus adrenal gland upregulated genes belong to neuron differentiation and neuronal development GO groups (Table 3). The GO term distribution was double-checked using a different online tool, the WebGestalt, and the results closely resembled those produced by DAVID (results not shown).
Table 3.
Gene Ontology (GO) groups overrepresented in human CB compared to human brain and adrenal gland tissues
| GO sub-ontologies | GO terms (groups) |
|---|---|
| A. Human CB versus human brain | |
| Inflammatory and immune response | |
| GOTERM_BP | Response to wounding |
| GOTERM_BP | Wound healing |
| GOTERM_BP | Immune response |
| GOTERM_BP | Inflammatory response |
| GOTERM_BP | Regulation of response to external stimulus |
| GOTERM_BP | Response to extracellular stimulus |
| GOTERM_BP | Defense response |
| GOTERM_BP | TGF beta receptor signaling pathway |
| GOTERM_BP | Positive regulation of response to external stimulus |
| GOTERM_BP | Response to cytokine stimulus |
| GOTERM_BP | Regulation of TGF beta receptor signaling pathway |
| GOTERM_BP | Activation of plasma proteins involved in acute inflammatory response |
| GOTERM_BP | Acute inflammatory response |
| GOTERM_BP | Positive regulation of immune system process |
| GOTERM_BP | Response to molecule of bacterial origin |
| GOTERM_BP | Adaptive immune response |
| GOTERM_BP | Response to lipopolysaccharide |
| GOTERM_BP | Immunoglobulin mediated immune response |
| GOTERM_BP | Positive regulation of immune response |
| GOTERM_MF | Glycosaminoglycan binding |
| GOTERM_MF | Polysaccharide binding |
| GOTERM_MF | Chemokine activity |
| GOTERM_MF | Chemokine receptor binding |
| Angiogenesis | |
| GOTERM_BP | Blood vessel development |
| GOTERM_BP | Vasculature development |
| GOTERM_BP | Blood vessel morphogenesis |
| GOTERM_BP | Angiogenesis |
| GOTERM_BP | Patterning of blood vessels |
| GOTERM_BP | Regulation of blood vessel size |
| B. Human CB versus human adrenal gland | |
| Inflammatory and immune response | |
| GOTERM_BP | Inflammatory response |
| GOTERM_BP | Response to wounding |
| GOTERM_BP | Wound healing |
| GOTERM_MF | Polysaccharide binding |
| Angiogenesis | |
| GOTERM_BP | Blood vessel development |
| GOTERM_BP | Vasculature development |
| GOTERM_BP | Blood vessel morphogenesis |
| GOTERM_BP | Regulation of blood vessel size |
| GOTERM_BP | Angiogenesis |
| GOTERM_MF | Blood vessel development |
| Neurological processes | |
| GOTERM_BP | Neuron differentiation |
| GOTERM_BP | Neuron development |
| GOTERM_BP | Neuron projection development |
| GOTERM_BP | Neuron projection morphogenesis |
| GOTERM_BP | Vasculogenesis |
| GOTERM_BP | Axon ensheathment |
| GOTERM_BP | Axonogenesis |
| GOTERM_BP | Regulation of neurogenesis |
| GOTERM_BP | Myelination |
| GOTERM_BP | Regulation of neuron differentiation |
| GOTERM_CC | Neuron projection |
| GOTERM_CC | Myelin sheath |
Human CB raw data were subjected to differential gene expression analysis against human brain tissue and adrenal gland tissue samples using WebArrayDB. The corresponding CB upregulated gene lists (S3–4) were examined by DAVID (see Materials and Methods). The full lists of the enriched GO groups with p < 0.01 are presented in supplementary tables S6–7, whereas current list is a selection of the specific GO groups of interest for CB function. GOTERM, Gene Ontology (GO) hierarchy containing three sub-ontologies; BP, biological process; CC, cellular component; MF, molecular function.
We carried out a similar differential gene expression and GO term enrichment analysis for the mouse CBs. The mouse raw data (Ganfornina et al. 2005; Balbir et al. 2007) were compared with the five data sets from mouse whole brain tissue (obtained from GEO and Array Express repositories) using the WebArrayDB (Supplements S9, S10). The resulting lists of differentially expressed genes were examined by DAVID and produced a pattern similar to human GO term distribution (Supplements S11, S12).
Comparison of expression of selected CB genes between human and mouse
We examined the expression of selected individual genes with immediate relevance to CB chemosensory function, i.e. the spectrum of the candidate oxygen sensors and K+ channels, and compared these data with the expression of the corresponding mouse genes (Ganfornina et al. 2005; Balbir et al. 2007) (Table 4). For some of the human genes, microarray results were also validated by real time PCR (Fig. 2). For all of these analyses we used microarray and PCR data from the CBs of five patients.
Table 4.
Expression of the oxygen sensing genes in the human and mouse CB
| Gene symbol (HGNC) | Gene symbol (IUPHAR) | Human | Mice | |||||
|---|---|---|---|---|---|---|---|---|
| Chemosensory function | A | B | C | D | E | C57BL/6J | DBA/2J | |
| HMOX2 (HO-2) | p | p | p | p | p | p | p | |
| NOX1 | a | a | a | a | a | a | a | |
| CYBB (NOX2) | p | p | p | p | p | a | p | |
| NOX3 | a | a | a | a | a | a | a | |
| NOX4 | p | p | p | p | p | p | p | |
| NOX5 | a | a | a | a | a | a | a | |
| DUOX1 | a | a | a | a | a | a | a | |
| DUOX2 | a | a | a | a | a | a | a | |
| SOD2 | p | p | p | p | p | p | p | |
| CAT | p | p | p | p | p | p | p | |
| CTH (CSE) | p | p | p | p | p | a | a | |
| CBS | u | u | u | u | u | p | a | |
| PRKAA1 (AMPK) | p | p | p | p | p | u | p | |
| HIF1A | p | p | p | p | p | p | p | |
| EPAS1 | p | p | p | u | u | a | a | |
| NOS1 | u | u | u | u | u | a | p | |
| K+ channels | ||||||||
| KCNA1 | Kv1.1 | a | a | a | a | a | a | p |
| KCNA2 | Kv1.2 | u | u | u | u | u | a | a |
| KCNA3 | Kv1.3 | a | a | a | a | a | a | a |
| KCNA5 | Kv1.5 | p | p | a | p | p | p | p |
| KCNB1 | Kv2.1 | p | p | p | p | p | p | p |
| KCNC1 | Kv3.1 | a | a | a | a | a | a | a |
| KCNC2 | Kv3.2 | a | a | a | a | a | u | a |
| KCNC3 | Kv3.3 | a | a | a | a | a | a | p |
| KCND1 | Kv4.1 | a | a | p | a | a | p | p |
| KCND2 | Kv4.2 | a | a | a | p | p | a | p |
| KCND3 | Kv4.3 | a | a | a | a | a | a | p |
| KCNK2 | TREK-1 | a | a | a | a | a | a | p |
| KCNK3 | TASK-1 | p | p | p | p | p | a | p |
| KCNK9 | TASK-3 | a | a | a | a | a | nd | nd |
| KCNK13 | THIK-1 | a | a | a | a | a | a | a |
| KCNK15 | TASK-5 | a | a | a | a | a | a | a |
| KCNMA1 | KCa1.1 | p | p | p | p | p | p | p |
| (Maxi-K, BKCa, slo) | ||||||||
Abbreviations: p, present call; a, absent; u, uncertain (due to the conflicting results from the multiple probe sets interrogating the same gene), nd, not detected. Expression calls for HO-2, Maxi-K and TASK-1 were shown also in our previous publication (Fagerlund et al. 2010). KCNK9 (TASK-3) gene was not included in the set of oligonucleotides present on Affymetrix mouse arrays and therefore the expression could not be detected. HGNC, Human Genome Name Classification), IUPHAR, International Union of Pharmacology. In parentheses, frequently used gene symbol synonyms. Full gene names are presented in the Supplementary Table S13.
Figure 2. Expression of selected chemosensory genes in the human carotid body.
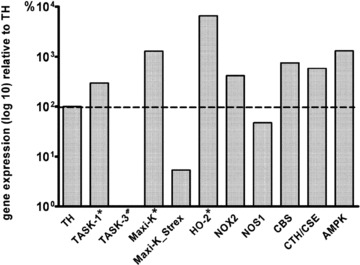
Relative expression of selected genes was determined by real time PCR. Data were analysed according to the common ΔCt method (see Methods), normalized to the reference gene TBP and related to the expression of tyrosine hydroxylase (TH). The resulting values are expressed as means, n = 5, with the exception of Maxi-K_Strex, which was expressed only in the CBs of patients B and E. *Combined data using previously published results from patients A–C (Fagerlund et al. 2010) and data from two additional patients D and E. #Data from patients B and C. The full gene names are shown in Supplement S13.
Oxygen sensors
The microarray data on the expression of potential oxygen sensors in human and mice CBs are summarized in Table 4, and PCR validation for selected genes is presented in Fig. 2.
Distinct similarities in expression of oxygen sensing genes in human and mouse CBs were demonstrated. We show expression of the α catalytic subunit of AMPK and confirm the expression of HO-2 in the human CB (Fagerlund et al. 2010) and in both of the mice strains. Both humans and mice express CB genes responsible for the formation and processing of ROS, i.e. two NADPH oxidases, NOX2, represented by the main membrane subunit, gp91phox and NOX4, superoxide dismutase 2 (SOD2) and catalase, with the exception of an absent expression of NOX2 in the C57BL/6J mice.
However, there were also certain species differences in the expression of other oxygen sensors. In the human CB, the expression of the H2S-synthesizing enzyme CSE was detected with microarray analysis and confirmed by PCR, but was absent in both of the mouse strains. The expression of the other H2S-synthesizing enzyme, CBS, was shown in the human CB, although only by real time PCR, and in the C57BL/6J mice. Similarly, NOS-1 was expressed in the human CBs and in DBA/2J mice.
K+ channels
A variety of K+ channels in different species have been suggested to play an important role in CB oxygen sensing (Peers et al. 2010). Here we show the expression of Kv1.5 and Kv2.1, and confirm the expression of TASK-1 and Maxi-K in the human CB (Fagerlund et al. 2010) (Table 4, Fig. 2). In contrast, the TASK-3, TASK-5 and TREK-1 K+ channels were absent in all five patients (Table 4, Fig. 2). The expression pattern for all of these genes in the C57BL/6J mice CB mostly followed the human data trend, whereas the DBA/2J mice CBs appeared to express more K+ channel subtypes, for example Kv1.1, Kv3.3, Kv4.1, Kv4.2, Kv4.3 and TREK-1 (Table 4). Notably, while TASK-1 was expressed, neither microarrays, nor conventional PCR could demonstrate gene expression of TASK-3 in the human CB, whereas PCR for TASK-3 in the DBA/2J mice CBs was positive (Fig. 3A).
Figure 3. Expression of TASK-like channels and Maxi-K in mouse and human carotid bodies analysed with PCR.
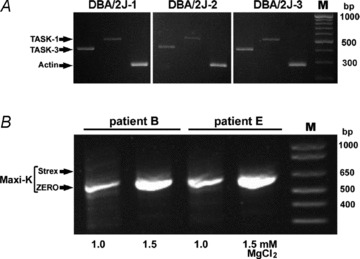
A, expression of TASK-1 and TASK-3 K+ channels in the DBA/2J mouse CB. cDNA from three DBA/2J mice (DBA/2J-1-3) was used as a template to generate TASK-1 (515 bp) and TASK-3 (413 bp) PCR fragments. Primer sequences and PCR conditions are described by Ortega-Saenz et al. (2010). Amplification of actin was used as a loading control. B, expression of splice variants of Maxi-K in the human CB. A set of primers generating 615 and/or 777 bp long amplicons indicative of the expression of ZERO (without the Strex exon) and/or Strex isoforms of Maxi-K, respectively, was used for PCR analysis of cDNA from two human CBs (patients B and E). Note the absence of the 777 bp fragment in both CBs under stringent (1.0 m MgCl2) and less stringent (1.5 mm MgCl2) PCR conditions. Even increased number of cycles (40) and lower annealing temperature (55°C) failed to produce the 777 bp amplicon (results not shown). An additional, more Strex-specific set of primers (see Methods) was similarly ineffective (results not shown). M, DNA ladder.
In the rat CB, the Maxi-K splice variant containing the stress-regulated exon (Strex) appears to be less potently inhibited by AMPK than the ZERO variant lacking this exon (Ross et al. 2011). Microarray analysis of the human CBs could not distinguish between these two isoforms. Therefore, we examined the expression of both the Maxi-K variants with real time PCR. This showed expression of the ZERO variant in all of the tested CBs and low levels of Strex in two CBs (Fig. 2). Further analysis of these two CBs with conventional PCR revealed only the short PCR fragment, indicative of the ZERO isoform expression (Fig. 3B).
Expression of the inflammatory response genes in CB
As indicated above, the human CB appears to be enriched with the GO groups responsible for the inflammatory response (Table 3). In Table 5, we present a summary of the expression of important pro- and anti-inflammatory markers and corresponding receptors in the human and mouse CB. The transcripts of toll-like receptors (TLR) 1 and 4, the interleukin (IL) receptors IL-1R1and IL-6R, as well as the tumour necrosis factor receptor TNFR were present in the human CB. In addition, the microarray data show the expression of the IL-10R. All of these receptors were also expressed in the mouse CB, except for TLR1 and IL-1R. The key regulatory protein of inflammation, NF-κB (nuclear factor κB), was expressed in both human and mouse CBs, as well as the late inflammatory mediator, high mobility group protein B-1 (HMGB-1) (Table 5). Other inflammatory mediators, such as TNFα, IL-10 and NOS-2 (iNOS) were absent in both human and mouse CBs.
Table 5.
Expression of inflammatory response genes in the human and mouse CB
| Gene symbol (HGNC) | Human | Mice | |||||
|---|---|---|---|---|---|---|---|
| Inflammatory response | A | B | C | D | E | C57BL/6J | DBA/2J |
| TLR1 | p | p | p | p | p | a | a |
| TLR4 | p | p | p | p | p | p | p |
| IL1R1 (IL1-R1) | p | p | p | p | p | a | a |
| IL1A | a | a | a | p | a | a | a |
| IL6R (IL6-R) | p | p | p | p | p | u | a |
| IL6 | p | p | p | p | p | a | a |
| IL10RA | p | p | p | p | p | p (IL10RB) | p (IL10RB) |
| IL10 | a | a | a | a | a | a | a |
| NOS2 (iNOS) | a | a | a | a | a | a | a |
| TNFRSF1A | p | p | p | p | p | p | p |
| TNFRSF1B | p | p | p | p | p | p | p |
| TNF (TNF-α) | a | a | a | a | a | a | a |
| TGFBR1 | p | p | p | p | p | p | p |
| TGFB1 (TGF-β) | a | a | a | p | p | a | a |
| HMGB1 | p | p | p | p | p | p | p |
| NFKB1 | p | p | p | p | p | p | p |
Abbreviations: p, present call; a, absent; u, uncertain (due to the conflicting results from the multiple probe sets interrogating the same gene). HGNC, Human Genome Name Classification. In parenthesis, frequently used gene symbol synonyms. Full gene names are available from the Supplementary Table S13.
Discussion
The present study introduces a comprehensive map of the human CB transcriptome, bridging the gap of knowledge between animal and human CB oxygen sensing. In the human CB we show a unique pattern of expression of the oxygen sensitive K+ channels and key oxygen sensing genes, and a higher expression of the inflammatory response genes compared to brain and adrenal gland tissues. Comparison of these data with mouse CB transcriptomes revealed a similar pattern of gene expression, yet with a number of important distinctions.
The CB has a unique gene expression profile, since comparison of human and mouse CB expressed genes with known transcriptomes failed to find a similarity with a variety of studied tissues. However, similar to the transcriptomes of many tissues with a mixed cell population, the RNA obtained from the CB contains transcripts from at least four different cell types, namely CB type 1 cells, glia-like sustentacular type 2 cells, vascular cells and circulating blood cells. Therefore, tissue comparisons should be interpreted with a certain degree of caution. Nevertheless, it is not a coincidence that the Barcode tissue comparison tool detected a weak similarity between the gene expression patterns of the human CB and neural cells of trigeminal ganglia.
While being a useful tool for estimating the expression states (presence/absence expression calls) for all genes from a single microarray and predicting the gene expression tissue profile, the Barcode approach cannot directly compare the gene expression levels between the uploaded datasets from different tissues. Therefore, we have carried out a differential analysis of the CB gene expression with brain and adrenal tissues using an additional online tool, the WebArrayDB. Despite the complex nature of both tissues with multiple cell types, our analysis reveals a number of interesting differences in the expression of the specific GO groups between these tissues. Thus, the CB in comparison with both tested tissues appears to be enriched with gene products involved in angiogenesis, vasculature development and similar biological processes. This finding confirms the status of the CB as a highly vascularized organ, thus able to rapidly respond to changes in arterial oxygenation. Another expected finding is the enrichment in the CB of the GO groups related to neurological processes when compared to adrenal tissue.
Although not a functional study, this work can help to resolve some controversies in the proposed molecular mechanisms of oxygen sensing in CB. One of them is the identity and number of expressed O2 sensitive K+ channels, which varies between different species (Buckler & Vaughan-Jones, 1994; Peers et al. 2010). It appears that the human CB expresses four putative O2 regulated channel subtypes, namely Kv1.5 (KCNA5), Kv2.1 (KCNB1), Maxi-K, and TASK-1 (Table 4). The two latter subtypes are considered the most important K+ channels inhibited by hypoxia in animal CBs. Comparison of these data with the mouse K+ channel expression pattern revealed a number of distinct differences. For instance, whereas the Maxi-K expression was detected in both mouse strains and in the human CB, we show an obvious species difference in the expression of TASK-channels. TASK-1 is expressed in humans and in DBA/2J mice but is absent in C57BL/6J mice. On the other hand, TASK-3 is demonstrated present with PCR in DBA/2J mice but absent in the human CBs and in C57BL/6J mice. The lower number of channels expressed in the latter strain might reflect either strain specificity, or a generally lower sensitivity level of the microarrays used in this study. These data support the previously reported expression of TASK-like channels in rodents, where TASK-1 and TASK-1/-3 heterodimers appear to have a functional role in the rat CB hypoxic response (Kim et al. 2009), whereas knockout mouse studies are more controversial concerning the primary role of TASK-1 and/or TASK-1/-3 complexes (Trapp et al. 2008; Ortega-Saenz et al. 2010). In the human CB we could only detect the expression of TASK-1, whereas the expression of its potential dimerization partners, TASK-3 and TASK-5 (Duprat et al. 2007), and also of another tandem-pore domain K+ channel, TREK-1 (Buckler & Honore, 2005; Yamamoto & Taniguchi, 2006; Kreneisz et al. 2009), were absent. Maxi-K pre-mRNA splicing produces only one of two isoforms in the human CB, i.e. ZERO, shown to be more sensitive to regulation by AMPK under hypoxic conditions in rats (Ross et al. 2011). Interestingly, in contrast to the human CB, the rat CB expresses both isoforms of Maxi-K. It remains to be seen if the ZERO-isoform is produced exclusively in human CB type 1 cells as in the rat CB (Ross et al. 2011). It is not clear whether such a splice variant expression exists also in the mouse CB, since the probe sets interrogating Maxi-K message from both Affymetrix arrays used in the mouse studies cannot specifically distinguish between these variants (results not shown). In summary, the human CB expresses four types of K+ channels, of which Maxi-K and TASK-1 should serve as candidates for a key role in oxygen sensing in functional studies.
Our study can also shed light on the identity of the potential oxygen sensors suggested as triggers for the closure of K+ channels. We have mapped the expression of the majority of these genes. NO, CO and H2S are gasotransmitters suggested as mediators of the CB chemosensory function and our gene expression data indicate the expression of enzymes that catalyse their formation, i.e. NOS-1 (NO synthesis) and HO-2 (CO synthesis). Both gases are negative modulators of CB function and since NOS-1 and HO-2 require O2 for the catalysis it could be speculated that under hypoxic conditions in the human CB, CO and NO formation might be downregulated with the subsequent activation of neurotransmission (Prabhakar, 1999). In contrast, H2S may activate the CB type 1 cell (Peng et al. 2010). Microarray analysis of the human CB demonstrates expression of one of the key enzymes catalysing synthesis of H2S, CSE, whereas real time PCR analysis detected the presence of yet another H2S synthase, CBS. Surprisingly, both mouse microarrays reported absent expression of CSE in contrast to previously published data (Peng et al. 2010). One possible explanation, at least for the DBA/2J mouse, is the strain specific expression of CSE. Alternatively, this might be due to the low-resolution CSE signals produced by mouse microarrays, which does not necessarily preclude possible protein expression (Chen et al. 2002; Tarca et al. 2006). It is suggested that CBS is the predominant enzyme in the brain, whereas CSE expression is observed mostly in peripheral tissues, such as the CB (Yang et al. 2008; Mustafa et al. 2009; Gadalla & Snyder, 2010), although both enzymes have been detected in the rat CB glomus cells (Telezhkin et al. 2010). Notably, CSE deficient mice display a severely impaired CB response to hypoxia (Peng et al. 2010). Taking our data on the gene expression of CSE and CBS into account, we suggest that the formation of H2S in the human CB is catalysed by one of these enzymes, namely CSE. It remains to be seen if PCR data on CBS expression reflect the true type 1 cell expression, where it might contribute to oxygen sensing, or if other cells in the CB, for example type 2 cells or fibroblasts, produce this transcript.
In addition to the oxygen sensing mechanisms discussed, our data suggest a role for ROS-mediated regulation. We found expression of a wide spectrum of human CB genes that may participate in the formation and processing of ROS, such as NOX2, NOX4, SOD-2 and catalase. These data are mirrored by the mice CB transcriptome with the exception of the negative expression call for NOX2 in C57BL/6J mouse (Table 4). As in the case of CSE, a low sensitivity level of the microarray assay might explain NOX2 absence. NOX2 is of particular interest since it has been suggested to act as a primary oxygen sensor in the CB (Lopez-Barneo et al. 2008). While NOX2 has previously been reported to be located mainly in macrophages in the rat CB and not in the type 1 cells (Dvorakova et al. 2000), a recent report demonstrated expression of NOX2 protein in the rat type 1 cells (Peng et al. 2009). Studies on knock-out mice suggest that although NOX2 may not be involved in the primary oxygen sensing under acute hypoxia conditions (Roy et al. 2000; He et al. 2002), it plays an important role in the induction of sensory plasticity of the CB under chronic intermittent hypoxia (Peng et al. 2009).
Recently, the CB has gained attention as a sensor and modulator of systemic inflammation. In this context, the expression of pro-inflammatory cytokines and their corresponding receptors (TLR4, TNF-α, TNF-R1 and TNF-R2) was demonstrated in the rat CB. Additionally, LPS and TNF-α have been shown to modulate the CB activity (Fernandez et al. 2008; Del Rio et al. 2011; Zapata et al. 2011). In line with this, we have previously confirmed the presence of the α7 nicotinic acetylcholine receptor subunit in the human CB, shown to be a central part of the cholinergic anti-inflammatory pathway (Tracey, 2002, 2009; Fagerlund et al. 2010). Consequently, the present data support the potential involvement of the human CB in the inflammatory response as evidenced by overrepresentation of the inflammatory GO groups in the human CB compared to brain and adrenal gland. Alternatively, the immune system has the capacity to regulate the chemo-adaptive response of the CB to physiologically relevant levels of hypoxia (Liu et al. 2011). Either or both contentions are further supported by the expression of the most important genes from these GO groups.
Since the human CB tissue could not be perfused, there is still a possibility that small amounts of blood cells, and here monocytes or macrophages, might have affected the expression profile of the inflammatory genes in the total CB tissue. However, we believe there is a very small contribution of RNA from the low amount of macrophages in circulating blood to the pool of RNA isolated from total CB tissue. In addition, neither of the comparison tissues from the public repositories, nor the human or the mouse CBs, was perfused to clear the tissue of circulating blood cells. Therefore the contribution of macrophages should be equal in all of these studied tissues.
This study is based exclusively on mRNA expression data. Since mRNA translation is not always a linear process, additional investigations on protein level would have extended our knowledge of molecular mechanisms of human CB chemoreception. However, this was not feasible due to the limited amounts of tissue available from the human subjects. Finally, we cannot completely rule out a minor influence on the levels of gene expression by the anaesthetic compounds given to the patients prior to CB removal.
Excitation of the CB by hypoxia evokes the hypoxic ventilatory response (HVR), a major component of the physiological defence against hypoxic cell damage. This response varies between individuals and is affected by age, sex, circadian rhythms, hormonal status, and psychological factors and is also influenced by several agents, both endogenous and pharmacological (Teppema & Dahan, 2010). However, the molecular mechanisms involved in this response, as reflected by oxygen sensing and signalling in the CB, are poorly studied in humans. Therefore, the analysis of the human CB transcriptome presented here, and in a recent publication (Fagerlund et al. 2010), serves as a basis for further functional studies on oxygen sensing and signalling in the CB.
In conclusion, we have characterized the human CB transcriptome in detail and demonstrated expression of key genes proposed to be involved in oxygen sensing and the inflammatory response. The human CB transcriptome shares important features with the mouse CB, but also differs significantly in the expression of a number of CB chemosensory genes, such as CSE, NOX2, TASK-3, Maxi-K and TREK-1. This study provides key information for future functional investigations on the human carotid body.
Acknowledgments
This work was supported by grants from the Swedish Research Council (No. 521-2011-152 (L.I.E.)), the Stockholm County Council (ALF project 20090321 (L.I.E.)), Post-Doc project 108042 (M.J.F.), Karolinska Foundations (M.J.F., L.I.E.), The Swedish Society of Medicine (L.I.E.), LPS Medical Foundation (M.J.F.), and Fraenkel Foundation (M.J.F., L.I.E.). C.G. is supported by the Ministerio de Ciencia e Innovación of Spain, grant no. BFU2007-61848, and by the Instituto Carlos III, grant no. CIBER CB06/06/0050. D.S. is supported by the MICINN grant BFU2008-01170. E.W.K. and M.S. are supported by NHLBI HL81345 of the USA.
Glossary
- AMPK
AMP activated protein kinase
- CB
carotid body
- CBS
cystathione-β-synthase
- CO
carbon monoxide
- CTH/CSE
cystathionine γ-lyase
- GO
Gene Ontology
- HO-2
haem oxygenase-2
- IL
interleukin
- HMGB-1
high mobility group protein B-1
- H2S
hydrogen disulfide
- HVR
hypoxic ventilatory response
- ILR
interleukin receptor
- LPS
lipopolysaccharide
- NO
nitric oxide
- NOX
NADPH oxidase
- NOS
NO synthase
- NF-κB
nuclear factor κB
- ROS
reactive oxygen species
- SOD-2
superoxide dismutase 2
- TASK
two pore weak inwardly rectifying (TWIK)-related acid sensitive K+ channel
- TBP
TATA box binding protein
- TLR
toll like receptor
- TNFα
tumour necrosis factor α
- TREK-1
two pore weak inwardly rectifying (TWIK)-related K+ channel 1
Author contributions
S.M. and J.K. are first authors and contributed equally to the manuscript. M.J.F. and L.I.E. are last authors and contributed equally to the manuscript. S.M., J.K., A.E., M.J.F. and L.I.E. contributed to conception and design of the experiments, performance of the experiments on human tissue, collection, analysis and interpretation of data and writing of manuscript. D.S., C.G., A.B., E.W.K. and M.S. performed the mice experiments in the two studies referred to and contributed to the writing of the manuscript. All authors contributed to critically revising the article for important intellectual content, and all authors approved of the final version.
Supplementary material
Figure S1
Figure S2
Figure S3
Figure S4
Figure S5
Figure S6
Figure S7
Figure S8
Figure S9
Figure S10
Figure S11
Figure S12
Figure S13
References
- Balbir A, Lee H, Okumura M, Biswal S, Fitzgerald RS, Shirahata M. A search for genes that may confer divergent morphology and function in the carotid body between two strains of mice. Am J Physiol Lung Cell Mol Physiol. 2007;292:L704–715. doi: 10.1152/ajplung.00383.2006. [DOI] [PubMed] [Google Scholar]
- Brown DI, Griendling KK. Nox proteins in signal transduction. Free Radic Biol Med. 2009;47:1239–1253. doi: 10.1016/j.freeradbiomed.2009.07.023. [DOI] [PMC free article] [PubMed] [Google Scholar]
- Buckler KJ, Honore E. The lipid-activated two-pore domain K+ channel TREK-1 is resistant to hypoxia: implication for ischaemic neuroprotection. J Physiol. 2005;562:213–222. doi: 10.1113/jphysiol.2004.077503. [DOI] [PMC free article] [PubMed] [Google Scholar]
- Buckler KJ, Vaughan-Jones RD. Effects of hypercapnia on membrane potential and intracellular calcium in rat carotid body type I cells. J Physiol. 1994;478:157–171. doi: 10.1113/jphysiol.1994.sp020239. [DOI] [PMC free article] [PubMed] [Google Scholar]
- Chen G, Gharib TG, Huang CC, Taylor JM, Misek DE, Kardia SL, Giordano TJ, Iannettoni MD, Orringer MB, Hanash SM, Beer DG. Discordant protein and mRNA expression in lung adenocarcinomas. Mol Cell Proteomics. 2002;1:304–313. doi: 10.1074/mcp.m200008-mcp200. [DOI] [PubMed] [Google Scholar]
- Del Rio R, Moya EA, Iturriaga R. Differential expression of pro-inflammatory cytokines, endothelin-1 and nitric oxide synthases in the rat carotid body exposed to intermittent hypoxia. Brain Res. 2011;1395:74–85. doi: 10.1016/j.brainres.2011.04.028. [DOI] [PubMed] [Google Scholar]
- Duprat F, Lauritzen I, Patel A, Honore E. The TASK background K2P channels: chemo- and nutrient sensors. Trends Neurosci. 2007;30:573–580. doi: 10.1016/j.tins.2007.08.003. [DOI] [PubMed] [Google Scholar]
- Dvorakova M, Hohler B, Vollerthun R, Fischbach T, Kummer W. Macrophages: a major source of cytochrome b558 in the rat carotid body. Brain Res. 2000;852:349–354. doi: 10.1016/s0006-8993(99)02156-3. [DOI] [PubMed] [Google Scholar]
- Fagerlund MJ, Kahlin J, Ebberyd A, Schulte G, Mkrtchian S, Eriksson LI. The human carotid body: expression of oxygen sensing and signalling genes of relevance for anaesthesia. Anesthesiology. 2010;113:1270–1279. doi: 10.1097/ALN.0b013e3181fac061. [DOI] [PubMed] [Google Scholar]
- Fernandez R, Gonzalez S, Rey S, Cortes PP, Maisey KR, Reyes EP, Larrain C, Zapata P. Lipopolysaccharide-induced carotid body inflammation in cats: functional manifestations, histopathology and involvement of tumour necrosis factor-alpha. Exp Physiol. 2008;93:892–907. doi: 10.1113/expphysiol.2008.041152. [DOI] [PubMed] [Google Scholar]
- Fitzgerald RS, Lahiri S. Reflex responses to chemoreceptor stimulation. In: Fishman AP, Cherniak NS, Widdicombe JS, Geiger SR, editors. Handbook of Physiology, section 3, The Respiratory System, vol II, Control of Breathing. Bethesda: American Physiological Society; 1986. [Google Scholar]
- Gadalla MM, Snyder SH. Hydrogen sulfide as a gasotransmitter. J Neurochem. 2010;113:14–26. doi: 10.1111/j.1471-4159.2010.06580.x. [DOI] [PMC free article] [PubMed] [Google Scholar]
- Ganfornina MD, Perez-Garcia MT, Gutierrez G, Miguel-Velado E, Lopez-Lopez JR, Marin A, Sanchez D, Gonzalez C. Comparative gene expression profile of mouse carotid body and adrenal medulla under physiological hypoxia. J Physiol. 2005;566:491–503. doi: 10.1113/jphysiol.2005.088815. [DOI] [PMC free article] [PubMed] [Google Scholar]
- Gonzalez C, Almaraz L, Obeso A, Rigual R. Carotid body chemoreceptors: from natural stimuli to sensory discharges. Physiol Rev. 1994;74:829–898. doi: 10.1152/physrev.1994.74.4.829. [DOI] [PubMed] [Google Scholar]
- He L, Chen J, Dinger B, Sanders K, Sundar K, Hoidal J, Fidone S. Characteristics of carotid body chemosensitivity in NADPH oxidase-deficient mice. Am J Physiol Cell Physiol. 2002;282:C27–33. doi: 10.1152/ajpcell.2002.282.1.C27. [DOI] [PubMed] [Google Scholar]
- Hou S, Heinemann SH, Hoshi T. Modulation of BKCa channel gating by endogenous signalling molecules. Physiology (Bethesda) 2009;24:26–35. doi: 10.1152/physiol.00032.2008. [DOI] [PMC free article] [PubMed] [Google Scholar]
- Huang da W, Sherman BT, Lempicki RA. Systematic and integrative analysis of large gene lists using DAVID bioinformatics resources. Nat Protoc. 2009;4:44–57. doi: 10.1038/nprot.2008.211. [DOI] [PubMed] [Google Scholar]
- Kahlin J, Eriksson LI, Ebberyd A, Fagerlund MJ. Presence of nicotinic, purinergic and dopaminergic receptors and the TASK-1 K+-channel in the mouse carotid body. Respir Physiol Neurobiol. 2010;172:122–128. doi: 10.1016/j.resp.2010.05.001. [DOI] [PubMed] [Google Scholar]
- Kim D, Cavanaugh EJ, Kim I, Carroll JL. Heteromeric TASK-1/TASK-3 is the major oxygen-sensitive background K+ channel in rat carotid body glomus cells. J Physiol. 2009;587:2963–2975. doi: 10.1113/jphysiol.2009.171181. [DOI] [PMC free article] [PubMed] [Google Scholar]
- Kline DD, Peng YJ, Manalo DJ, Semenza GL, Prabhakar NR. Defective carotid body function and impaired ventilatory responses to chronic hypoxia in mice partially deficient for hypoxia-inducible factor 1α. Proc Natl Acad Sci U S A. 2002;99:821–826. doi: 10.1073/pnas.022634199. [DOI] [PMC free article] [PubMed] [Google Scholar]
- Kreneisz O, Benoit JP, Bayliss DA, Mulkey DK. AMP-activated protein kinase inhibits TREK channels. J Physiol. 2009;587:5819–5830. doi: 10.1113/jphysiol.2009.180372. [DOI] [PMC free article] [PubMed] [Google Scholar]
- Lassegue B, Griendling KK. NADPH oxidases: functions and pathologies in the vasculature. Arterioscler Thromb Vasc Biol. 2010;30:653–661. doi: 10.1161/ATVBAHA.108.181610. [DOI] [PMC free article] [PubMed] [Google Scholar]
- Liu X, He L, Dinger B, Gonzalez C, Stensaas L, Fidone S. A chronic pain: inflammation-dependent chemoreceptor adaptation in rat carotid body. Respir Physiol Neurobiol. 2011;178:362–369. doi: 10.1016/j.resp.2011.03.006. [DOI] [PMC free article] [PubMed] [Google Scholar]
- Lopez-Barneo J, Ortega-Saenz P, Pardal R, Pascual A, Piruat JI. Carotid body oxygen sensing. Eur Respir J. 2008;32:1386–1398. doi: 10.1183/09031936.00056408. [DOI] [PubMed] [Google Scholar]
- McCall MN, Uppal K, Jaffee HA, Zilliox MJ, Irizarry RA. The Gene Expression Barcode: leveraging public data repositories to begin cataloging the human and murine transcriptomes. Nucleic Acids Res. 2011;39:D1011–1015. doi: 10.1093/nar/gkq1259. [DOI] [PMC free article] [PubMed] [Google Scholar]
- McCartney CE, McClafferty H, Huibant JM, Rowan EG, Shipston MJ, Rowe IC. A cysteine-rich motif confers hypoxia sensitivity to mammalian large conductance voltage- and Ca-activated K (BK) channel α-subunits. Proc Natl Acad Sci U S A. 2005;102:17870–17876. doi: 10.1073/pnas.0505270102. [DOI] [PMC free article] [PubMed] [Google Scholar]
- Mills SE. Histology for Pathologists. Philadelphia: Lippincott William & Wilkins; 2007. [Google Scholar]
- Milsom WK, Burleson ML. Peripheral arterial chemoreceptors and the evolution of the carotid body. Respir Physiol Neurobiol. 2007;157:4–11. doi: 10.1016/j.resp.2007.02.007. [DOI] [PubMed] [Google Scholar]
- Mustafa AK, Gadalla MM, Snyder SH. Signaling by gasotransmitters. Sci Signal. 2009;2:re2. doi: 10.1126/scisignal.268re2. [DOI] [PMC free article] [PubMed] [Google Scholar]
- Nurse CA. Neurotransmitter and neuromodulatory mechanisms at peripheral arterial chemoreceptors. Exp Physiol. 2005;95:657–667. doi: 10.1113/expphysiol.2009.049312. [DOI] [PubMed] [Google Scholar]
- Nurse CA, Fearon IM. Carotid body chemoreceptors in dissociated cell culture. Microsc Res Tech. 2002;59:249–255. doi: 10.1002/jemt.10199. [DOI] [PubMed] [Google Scholar]
- Ortega-Saenz P, Levitsky KL, Marcos-Almaraz MT, Bonilla-Henao V, Pascual A, Lopez-Barneo J. Carotid body chemosensory responses in mice deficient of TASK channels. J Gen Physiol. 2010;135:379–392. doi: 10.1085/jgp.200910302. [DOI] [PMC free article] [PubMed] [Google Scholar]
- Park SJ, Chun YS, Park KS, Kim SJ, Choi SO, Kim HL, Park JW. Identification of subdomains in NADPH oxidase-4 critical for the oxygen-dependent regulation of TASK-1 K+ channels. Am J Physiol Cell Physiol. 2009;297:C855–864. doi: 10.1152/ajpcell.00463.2008. [DOI] [PubMed] [Google Scholar]
- Peers C, Wyatt CN, Evans AM. Mechanisms for acute oxygen sensing in the carotid body. Respir Physiol Neurobiol. 2010;174:292–298. doi: 10.1016/j.resp.2010.08.010. [DOI] [PubMed] [Google Scholar]
- Peng YJ, Nanduri J, Raghuraman G, Souvannakitti D, Gadalla MM, Kumar GK, Snyder SH, Prabhakar NR. H2S mediates O2 sensing in the carotid body. Proc Natl Acad Sci U S A. 2010;107:10719–10724. doi: 10.1073/pnas.1005866107. [DOI] [PMC free article] [PubMed] [Google Scholar]
- Peng YJ, Nanduri J, Yuan G, Wang N, Deneris E, Pendyala S, Natarajan V, Kumar GK, Prabhakar NR. NADPH oxidase is required for the sensory plasticity of the carotid body by chronic intermittent hypoxia. J Neurosci. 2009;29:4903–4910. doi: 10.1523/JNEUROSCI.4768-08.2009. [DOI] [PMC free article] [PubMed] [Google Scholar]
- Prabhakar NR. NO and CO as second messengers in oxygen sensing in the carotid body. Respir Physiol. 1999;115:161–168. doi: 10.1016/s0034-5687(99)00019-5. [DOI] [PubMed] [Google Scholar]
- Ramskold D, Wang ET, Burge CB, Sandberg R. An abundance of ubiquitously expressed genes revealed by tissue transcriptome sequence data. PLoS Comput Biol. 2009;5:e1000598. doi: 10.1371/journal.pcbi.1000598. [DOI] [PMC free article] [PubMed] [Google Scholar]
- Ross FA, Rafferty JN, Dallas ML, Ogunbayo O, Ikematsu N, McClafferty H, Tian L, Widmer H, Rowe IC, Wyatt CN, Shipston MJ, Peers C, Hardie DG, Evans AM. Selective expression in carotid body type I cells of a single splice variant of the large conductance calcium- and voltage-activated potassium channel confers regulation by AMP-activated protein kinase. J Biol Chem. 2011;286:11929–11936. doi: 10.1074/jbc.M110.189779. [DOI] [PMC free article] [PubMed] [Google Scholar]
- Roy A, Rozanov C, Mokashi A, Daudu P, Al-mehdi AB, Shams H, Lahiri S. Mice lacking in gp91 phox subunit of NAD(P)H oxidase showed glomus cell [Ca2+]i and respiratory responses to hypoxia. Brain Res. 2000;872:188–193. doi: 10.1016/s0006-8993(00)02458-6. [DOI] [PubMed] [Google Scholar]
- Tarca AL, Romero R, Draghici S. Analysis of microarray experiments of gene expression profiling. Am J Obstet Gynecol. 2006;195:373–388. doi: 10.1016/j.ajog.2006.07.001. [DOI] [PMC free article] [PubMed] [Google Scholar]
- Telezhkin V, Brazier SP, Cayzac SH, Wilkinson WJ, Riccardi D, Kemp PJ. Mechanism of inhibition by hydrogen sulfide of native and recombinant BKCa channels. Respir Physiol Neurobiol. 2010;172:169–178. doi: 10.1016/j.resp.2010.05.016. [DOI] [PubMed] [Google Scholar]
- Teppema LJ, Dahan A. The ventilatory response to hypoxia in mammals: mechanisms, measurement, and analysis. Physiol Rev. 2010;90:675–754. doi: 10.1152/physrev.00012.2009. [DOI] [PubMed] [Google Scholar]
- Tracey KJ. The inflammatory reflex. Nature. 2002;420:853–859. doi: 10.1038/nature01321. [DOI] [PubMed] [Google Scholar]
- Tracey KJ. Reflex control of immunity. Nat Rev Immunol. 2009;9:418–428. doi: 10.1038/nri2566. [DOI] [PMC free article] [PubMed] [Google Scholar]
- Trapp S, Aller MI, Wisden W, Gourine AV. A role for TASK-1 (KCNK3) channels in the chemosensory control of breathing. J Neurosci. 2008;28:8844–8850. doi: 10.1523/JNEUROSCI.1810-08.2008. [DOI] [PMC free article] [PubMed] [Google Scholar]
- Wang Y, McClelland M, Xia XQ. Analyzing microarray data using WebArray. Cold Spring Harb Protoc. 2009;2009:pdb prot5260. doi: 10.1101/pdb.prot5260. [DOI] [PubMed] [Google Scholar]
- Williams SE, Wootton P, Mason HS, Bould J, Iles DE, Riccardi D, Peers C, Kemp PJ. Hemoxygenase-2 is an oxygen sensor for a calcium-sensitive potassium channel. Science. 2004;306:2093–2097. doi: 10.1126/science.1105010. [DOI] [PubMed] [Google Scholar]
- Wyatt CN, Mustard KJ, Pearson SA, Dallas ML, Atkinson L, Kumar P, Peers C, Hardie DG, Evans AM. AMP-activated protein kinase mediates carotid body excitation by hypoxia. J Biol Chem. 2007;282:8092–8098. doi: 10.1074/jbc.M608742200. [DOI] [PMC free article] [PubMed] [Google Scholar]
- Yamamoto Y, Taniguchi K. Expression of tandem P domain K+ channel, TREK-1, in the rat carotid body. J Histochem Cytochem. 2006;54:467–472. doi: 10.1369/jhc.5A6755.2005. [DOI] [PubMed] [Google Scholar]
- Yang G, Wu L, Jiang B, Yang W, Qi J, Cao K, Meng Q, Mustafa AK, Mu W, Zhang S, Snyder SH, Wang R. H2S as a physiologic vasorelaxant: hypertension in mice with deletion of cystathionine gamma-lyase. Science. 2008;322:587–590. doi: 10.1126/science.1162667. [DOI] [PMC free article] [PubMed] [Google Scholar]
- Zapata P, Larrain C, Reyes P, Fernandez R. Immunosensory signalling by carotid body chemoreceptors. Respir Physiol Neurobiol. 2011;178:370–374. doi: 10.1016/j.resp.2011.03.025. [DOI] [PubMed] [Google Scholar]
Associated Data
This section collects any data citations, data availability statements, or supplementary materials included in this article.