

Abstract
The physiological responses of dendrites to dopaminergic inputs are poorly understood and controversial. We applied dopamine on one dendritic branch while simultaneously monitoring action potentials (APs) from multiple dendrites using either calcium-sensitive dye, voltage-sensitive dye or both. Dopaminergic suppression of dendritic calcium transients was rapid (<0.5 s) and restricted to the site of dopamine application. Voltage waveforms of backpropagating APs were minimally altered in the same dendrites where dopamine was confirmed to cause large suppression of calcium signals, as determined by dual voltage and calcium imaging. The dopamine effects on dendritic calcium transients were fully mimicked by D1 agonists, partially reduced by D1 antagonist and completely insensitive to protein kinase blockade; consistent with a membrane delimited mechanism. This dopamine effect was unaltered in the presence of L-, R- and T-type calcium channel blockers. The somatic excitability (i.e. AP firing) was not affected by strong dopaminergic stimulation of dendrites. Dopamine and GABA were then sequentially applied on the same dendrite. In contrast to dopamine, the pulses of GABA prohibited AP backpropagation distally from the application site, even in neurons with natural Cl− concentration (patch pipette removed). Thus, the neocortex employs at least two distinct mechanisms (dopamine and GABA) for rapid modulation of dendritic calcium influx. The spatio-temporal pattern of dendritic calcium suppression described in this paper is expected to occur during phasic dopaminergic signalling, when midbrain dopaminergic neurons generate a transient (0.5 s) burst of APs in response to a salient event.
Key points
Dopamine-releasing axons make direct synaptic contacts with the dendrites of cortical pyramidal neurons. It is not known if and how dendritic physiology changes upon dopamine release at these synapses.
We attempted to mimic synaptically released dopamine by ejecting dopamine from a micropipette. Action potential-induced voltage transients and corresponding calcium influx were both measured in thin dendritic branches using voltage-sensitive and calcium-sensitive dyes, before and after local application of dopamine or GABA.
GABA blocked calcium influx in dendrites by blocking AP backpropagation. Dopamine, on the other hand, reduced dendritic calcium influx only at the site of dopamine release. APs successfully propagated through the dopamine application site.
Dopamine blocked dendritic voltage-gated calcium channels in the presence of protein kinase blockers, suggesting a membrane delimited mechanism.
Spatially restricted dopamine-mediated suppression of dendritic calcium is expected to occur during phasic dopaminergic signalling, when midbrain dopaminergic neurons respond to a salient event.
Introduction
More than 20 years after the discovery that dopaminergic synapses populate the dendrites of pyramidal neurons in the prefrontal cortex (PFC) (Goldman-Rakic et al. 1989), it is still unclear what physiological changes occur in dendrites upon a transient (synaptic-like) dopaminergic stimulus (Schultz, 2002; Seamans & Yang, 2004). In vitro experiments investigating changes in dendritic AP signals in the PFC relied on bath applications of dopamine (DA) and DAergic drugs (Gulledge & Stuart, 2003; Kisilevsky et al. 2008). There is an obvious temporal inconsistency between naturally occurring phasic DAergic transients (Ljungberg et al. 1992) and bath application of DA. In a typical bath application experiment, the change (increase or decrease) in DA concentration is very slow, persists for many minutes, and non-selectively activates all DA-sensitive elements in the brain tissue, including dendrites, axons, somata of various neuron types, and even non-neuronal elements such as glia and blood vessels. In summary, with bath application of DA, two critical features of natural DAergic neurotransmission are lost: (a) rapid and transient character (Ljungberg et al. 1992; Schultz, 2002) and (b) the spatial selectivity (Goldman-Rakic et al. 1989).
Using a bath-application approach, Gulledge and Stuart (2003) reported that DA did not modulate backpropagating APs nor AP-induced Ca2+ transients. This was a surprising result as DA modulates both voltage-gated sodium channels (Maurice et al. 2001; Peterson et al. 2006; Few et al. 2007) and voltage-gated calcium channels (Malgaroli et al. 1987; Lledo et al. 1990; Surmeier et al. 1995; Young & Yang, 2004; Bender et al. 2010). In a counterpart study, also conducted in rat PFC, a global and prolonged application of DA (5 min) significantly reduced AP-induced calcium transients in the apical trunk (Kisilevsky et al. 2008). However, several important questions remain unanswered. (1) What is the spatial profile of the DA effect? (2) What time interval passes between DA release and the actual change in dendritic Ca2+? (3) Are DA-induced changes in AP-associated dendritic Ca2+ transients caused by alterations in the dendritic AP voltage waveform? (4) How does DAergic inhibition compare to GABAergic inhibition on the same cell? (5) Which subclass of pyramidal dendrites (apical or basal) is more sensitive to DAergic modulation? Previous research on DAergic modulation of dendritic function has focused exclusively on the apical dendrite (Yang & Seamans, 1996; Hoffman & Johnston, 1999; Gulledge & Stuart, 2003; Kisilevsky et al. 2008). Since, in the rat PFC, the densities of DAergic fibres and DA receptors are greatest in deep layers V and VI (Sesack et al. 1989), where basal dendrites reside, it is possible that basal dendrites may be more susceptible to DA modulation than apical dendrites.
Rapid and transient increases in DA concentration are expected to occur during phasic DAergic signalling, when midbrain DAergic neurons generate a transient (0.5 s) burst of action potentials in response to a salient event in the animal's environment (Ljungberg et al. 1992; Schultz, 2002). Here we used fast multi-site calcium and voltage imaging to evaluate how a brief increase in DA concentration, presented locally within one spatially restricted segment of a dendritic branch, affects both calcium and voltage dynamics in apical and basilar dendrites of the rat PFC pyramidal neurons. Dendritic calcium and voltage signals were recorded optically using intracellularly applied calcium-sensitive or voltage-sensitive dyes, either individually or concurrently. By monitoring dendritic function simultaneously from many dendritic segments, our experiments addressed the spatial extent of DAergic inhibition of dendritic Ca2+ influx along the target branch, as well as in neighbouring dendritic branches. Transient pressure applications of DA were used to determine the latency between the DA stimulus onset and the ensuing change in dendritic calcium amplitude. DAergic modulations of calcium or voltage signals were directly compared to GABAergic modulations by sequentially applying DA and then GABA (or vice versa) on the same dendrite of the same pyramidal neuron. To preserve the natural concentration of chloride ions, patch electrodes were removed before GABA applications. The results of these experiments suggested that the mammalian PFC employs at least two distinct forms of fast modulation of dendritic Ca2+, based on two distinct neurotransmitter systems, DA and GABA.
Methods
Brain slice and electrophysiology
Sprague–Dawley rats (P21–42) were anaesthetized with isoflurane inhalation, decapitated and the brains extracted with the head immersed in ice-cold, artificial cerebrospinal fluid (ACSF), according to an animal protocol approved by the Center for Laboratory Animal Care, University of Connecticut. ACSF contained (in mm): 125 NaCl, 26 NaHCO3, 10 glucose, 2.3 KCl, 1.26 KH2PO4, 2 CaCl2 and 1 MgSO4, pH 7.4. Coronal slices (300 μm) were cut from frontal lobes. All experimental measurements were performed at 32–34°C. Whole-cell recordings were made from visually identified layer V pyramidal neurons within the ventral medial PFC, including prelimbic and infralimbic cortex. Intracellular solution contained (in mm): 135 potassium gluconate, 2 MgCl2, 3 Na2-ATP, 10 Na2-phosphocreatine, 0.3 Na2-GTP and 10 Hepes (pH 7.3). Electrical signals were amplified with a Multiclamp 700B and digitised with two input boards: (1) Digidata Series 1322A (Molecular Devices, Union City, CA, USA) and (2) Neuroplex (RedShirtImaging, Decatur, GA, USA). Only cells with a membrane potential more negative than −50 mV (not corrected for junction potential) and action potential amplitudes exceeding 80 mV (measured from the baseline) were included in this study. Action potentials were evoked with depolarizing current steps injected into the cell body (intensity 1.0–1.5 nA; duration, 1.5–2.0 ms). To generate trains of somatic APs at ∼20 Hz, a depolarizing current pulse (intensity, 100–200 pA; duration, 800 ms) was injected into the soma. Dendritic recordings were performed using high-resistance patch electrodes (∼15 MΩ). To generate APs in unpatched neurons stimulating electrodes were placed close to the axon.
Dye injection
Voltage-sensitive dye (JPW-3028) and calcium-sensitive dyes (Ca-Green-1, Oregon Green BAPTA-1 and bis-fura-2; Invitrogen, Carlsbad, CA, USA) were dissolved in intracellular solution. The protocol for voltage-sensitive dye injection has been previously described (Antic, 2003). Briefly, neurons were filled through whole-cell patching pipettes with JPW-3028 for 45 min. Dye-free solution was at the tip of the pipette, while the back of the pipette lumen was loaded with dye-rich solution (400–800 μm). The filling pipette was carefully pulled out (outside-out patch) and brain slices were left to incubate for 1–3 h at room temperature. Immediately before optical recordings the cells were re-patched with a dye-free pipette. In calcium imaging experiments, Alexa Fluor 594 (50 μm) was included in the intracellular solution to aid the visually guided focal application of drugs onto dendrites. The calcium-sensitive dyes (100–150 μm) were injected for 30–45 min before optical recordings.
Dendritic voltage and calcium imaging
Multi-site dendritic imaging was performed on either an Olympus BX51WI or Zeiss, Axioskop FS microscope, equipped with UV-compatible 40× objective, two camera ports and a low-ripple xenon arc lamp (OptiQuip, Highland Mills, NY, USA) for epi-illumination. Functional dendritic imaging was performed with a NeuroCCD camera (80 × 80 pixels, RedShirtImaging). Voltage-sensitive dye signals were sampled at a 2000 or 2700 Hz frame rate, and calcium-dye signals at 500 Hz. In voltage–calcium dual-imaging experiments, the signals were first recorded (control, drug, washout) with one filter set (cube), and then experimenters would change the filter cube and repeat the entire protocol (control, drug, washout). Between recordings, all stimulus parameters (location, intensity and duration) were kept the same. A spike-triggered averaging routine available in Neuroplex (RedShirtImaging) was used to improve the signal-to-noise ratio of voltage-sensitive dye measurements. The same number of sweeps was used in control, drug and wash. The number of individual sweeps used for averaging did not exceed four. One DA puff was applied prior to each individual sweep included in the averaging procedure.
Drug application
Dopaminergic drugs were dissolved in ACSF and loaded into glass micropipettes (6–8 MΩ). Tips of the drug application pipettes were positioned ∼20 μm from the dendritic shaft. Drugs were pressure-ejected via a computer-driven picospritzer (puff duration, 3 s) prior to a calcium imaging measurement, or for 20–500 ms (duration) during the optical measurement. For iontophoretic application, dopamine (20–100 mm, pH 4.0) was loaded into a sharp micropipette (∼40 MΩ) and driven out by positive current (nominal intensity, 1.0–1.8 μA; duration, 20–300 ms). All drugs (SKF-38393 (SKF), A-68930 (A6), SCH23390 (SCH), quinpirole (QP), GABA) were purchased from Sigma (St Louis, MO, USA). The intrapipette concentration (IPC) refers to the concentration of drug inside a glass micropipette.
Data analysis
Analysis of optical data, including spatial averaging, high-pass and low-pass filtering, was conducted with Neuroplex 8.0.0 (RedShirtImaging). To process off-line calcium imaging data, we applied a Butterworth high-pass filter at 0.1 Hz cut-off and a Gaussian low-pass filter at 90 Hz cut-off; for voltage imaging data, the high- and low-pass filters were set at Butterworth 0.1 Hz and Gaussian 900 Hz, unless otherwise specified. Pressure ejection of drugs during optical imaging causes a transient reduction in resting light intensity (RLI), which we attribute to a recording artifact. The artifact subtraction procedure is described in Supplemental Fig. S3. In experiments where DA was applied prior to the opening of the shutter, raw traces (no subtraction) were used in the analysis. Electrical recordings were analysed in Clampfit 9 (Molecular Devices, Sunnyvale, CA, USA). For optical recordings, a custom-made MATLAB routine was used to automatically calculate AP half-widths and AP integral (area under the curve). This algorithm included: spatial averaging of pixel outputs in a pre-selected ROI, low-pass filtering of the optical signal (980 Hz), interpolation of the optical signal (Fig. 3G in Antic, 2003), finding of the AP peak, and calculation of the baseline level by averaging data points prior to the AP onset. Statistical tests were performed using SigmaPlot 8.02 (Systat Software, San Jose, CA, USA). All statistics were done on raw data points before normalization unless otherwise specified. Paired Student's t tests were used for comparing data obtained from the same neuron (in two different conditions). Unpaired Student's t tests were used for data obtained from different neurons. Significance was set as *P < 0.05, and high significance as **P < 0.01. Values are presented as mean ± SEM. The exclusion of non-responding cells from the data set did not affect our conclusions because non-responders comprised a relatively small fraction of the total (9 out of 64 pyramidal neurons). For example, 3 out of 16 cells were resistant to 10 mm DA pulse (signal reduction <10%). In both data group versions n = 16 (with non-responders) and n = 13 (without non-responders) the difference between DA and Control was statistically significant (P < 0.01). Fitting of the dopamine dose–response curve (Supplemental Fig. S1) was done in SigmaPlot using the equation: f = min + (max − min)/(1 + (x/ EC50)Hillslope), where x is intrapipette concentration of DA, min is the reduction in the calcium signal at 1 μm, and max is the reduction in the calcium signal at 20,000 μm. To calculate the ‘space constant’ for decay of DA effect along dendrite, the DA/Control ratios were (1) normalized in respect to the values obtained at the DA application sites, (2) inverted, and then (3) fitted in SigmaPlot using the following equation: ,
,
Figure 3. Selective DA receptor stimulation.
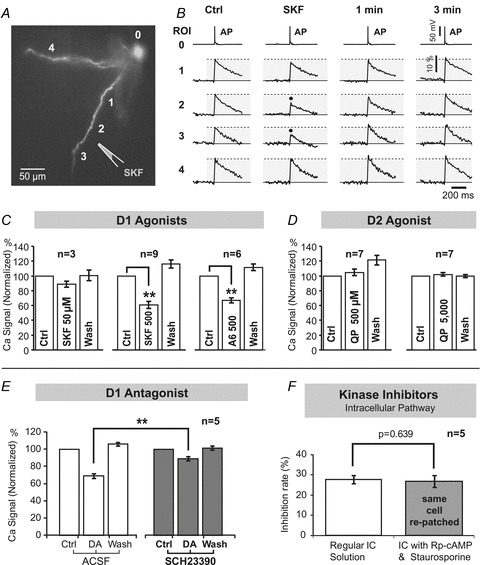
A, pyramidal neuron filled with CG-1. The drawing marks position of a glass pipette filled with D1 receptor agonist, SKF38393 (500 μm). B, in the control sweep (Ctrl) an AP signal from the soma (ROI 0) is aligned with dendritic recordings from 4 ROIs (1–4) shown in A. Black dots mark AP-mediated Ca2+ transients that were reduced in response to SKF. The effect of SKF was not detected 1 min or 3 min, after the cessation of the SKF pulse (washout). C, changes in Ca2+ signal amplitude in response to D1 receptor agonists SKF (50 μm), SKF (500 μm) or A-68930 (A6) (500 μm). n indicates number of cells in data group. D, same as in C, except application pipette was filled with D2 receptor agonist quinpirole (QP) at 500 μm and 5000 μm concentrations. E, the ability of DA to reduce the dendritic Ca2+ transient was established (3 open columns) before SCH was introduced in the bath and DA puffs (IPC, 10 mm) were repeated in the presence of SCH (3 grey columns). F, first, the DA effect on dendritic calcium was established as explained in Fig. 1. Then, the patch pipette was removed and replaced with the one filled with inhibitors of protein kinases (Rp-cAMP, 500 μm; staurosporine, 0.4 μm). DA stimulus was repeated 30 min after re-patching.
where E0 is the amplitude of DA effect at the DA application site; Ex is amplitude of DA effect at distance ‘x’; λ is ‘length or space constant’ defined as a distance from the DA application site at which DA effect falls down to 37% of its initial value at x = 0.
Results
Local and brief dopamine application
Brief puffs of DA (duration, 3 s) were applied locally to basal dendrites. DA puffs were aimed at the middle segments of basal dendrites (Fig. 1AB, ROI 2), at an average distance of 156 ± 40 μm from the soma (N = 65 basal dendrites; n = 35 neurons). Optical recordings of AP-induced dendritic Ca2+ transients were first acquired just before drug application (Fig. 1C, Control), and then 2 s after closing of the pressure valve (Fig. 1C, Dopamine), using the same pattern of somatic APs (ROI 0). In response to DA (1 mm inside micropipette), the amplitude of the first AP-induced dendritic signal in the train (Fig. 1C, Dopamine, arrow) was on average 67.9 ± 7.1% (n = 7 neurons, N = 16 dendrites; P < 0.01, paired t test) of its original size obtained prior to the DA puff (Control). The DA effect was short lived, taking less than 90 s for complete recovery of the DA effect in all dendritic loci (Fig. 1C, Washout).
Figure 1. Local DA application suppresses AP-mediated Ca2+ transients.
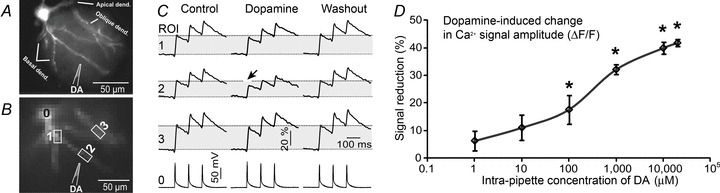
A, microphotograph of a pyramidal neuron filled with OGB-1. B, one movie frame captured by fast CCD camera (500 Hz, 80 × 80 pixel). Drawing marks the position of DA-filled pipette (1 mm) inserted into the brain slice. C, somatic current injections were used to produce 3 action potentials. Electrical signal from the soma (region of interest, ROI, 0) is aligned with dendritic recordings from three ROIs (1–3) shown in B. Upon application of dopamine (DA puff) the amplitude of the first AP-mediated Ca2+ transient at ROI 2 (Dopamine) is less than that in the measurement obtained just before DA puff (Control) or 90 s after DA puff (Washout). Arrow marks the optical trace showing notable reduction in Ca2+ signal compared with Control. D, Ca2+ signal decreases with an increase in the concentration of DA inside the application pipette, shown on a logarithmic scale.
We systematically varied the concentration of dopamine inside the application pipette from 1 μm to 20,000 μm: 1 μm (n = 3 cells, N = 5 dendrites), 10 μm (n = 3, N = 4), 100 μm (n = 4, N = 11), 1000 μm (n = 7, N = 16), 10 000 μm (n = 13, N = 17) and 20,000 μm (n = 5, N = 8). The effect of DA increased with an increase in the intrapipette concentration (IPC) of DA (Fig. 1D). The DA dose–response curve (Fig. 1D) was fitted as described in the Methods, and the EC50 value (325.7 ± 98 μm) was determined from the best-fit curve (Supplemental Fig. S1D3).
Local DA applications caused changes in fluorescence intensity before the arrival of an AP (resting light level, F), suggesting that DA affects Ca2+ under basal conditions (Malgaroli et al. 1987; Akerman et al. 1991). However, neither the direction of change (decrease or increase in F), nor the amplitude of change in F (Supplemental Fig. 1D2) could account for the DA-induced changes in Ca2+ signal amplitude, expressed as ΔF/F (Supplemental Fig. 1D1). Also, optical measurements performed in three pyramidal cells (6 dendritic branches) treated with a puff of ACSF (duration 3 s) failed to affect the amplitudes of AP-induced optical signals (103 ± 6%, P > 0.05, paired t test). These data indicate that local and transient (3 s) surges in DA concentration reduce AP-evoked dendritic Ca2+ influx.
Non-responders
In 9 out of 64 pyramidal neurons tested, the applications of relatively high concentrations of DA (e.g. 1–20 mm IPC) did not induce any significant changes on AP-induced dendritic Ca2+ signals. The occurrence of dopamine-insensitive neurons in the mammalian neocortex and neostriatum is common, but is still an unexplained phenomenon (Sesack & Bunney, 1989; Surmeier et al. 1995; Day et al. 2008; Kisilevsky et al. 2008; Moore et al. 2011). In the present study DA-insensitive neurons (n = 9) were excluded from quantifications.
Spatial aspect of dopaminergic modulation of dendritic Ca2+
In four neurons, the geometry of the target basal dendrite allowed us to simultaneously monitor ∼80 μm of dendritic length on both sides of the DA application site (Fig. 2A, drawing; Supplemental Fig. S2). When DA pulses were applied to the mid-dendrite region (Fig. 2A, 0 μm), the dendritic segments located proximally, as well as distally to the DA application site, experienced little or no change in Ca2+ signal amplitude (Fig. 2A, DA/Ctrl). The DA effect was maximal at the DA application site (Fig. 2A, 0 μm). At a distance of 31.8 ± 2.9 μm away from the DA application site, the amplitude of the DA effect decayed to 37% of its value at the DA application site (n = 4). The effects of DA outside of DA application site were instantaneous and thus unlikely to represent diffusion of an intracellular messenger along the dendritic axis. In 35 neurons, the DA effect was not observed in the neighbouring dendritic branches (Fig. 1C, ROI 3), not even after the washout period (∼90 s), suggesting that local DA stimulation does not generate a diffusible intracellular messenger that can travel between two neighbouring branches (Supplemental Fig. S1, ROIs 5 and 6), or two remote segments of the same dendritic branch (Fig. 2A).
Figure 2. Spatial and temporal dynamics of the dopamine effect.
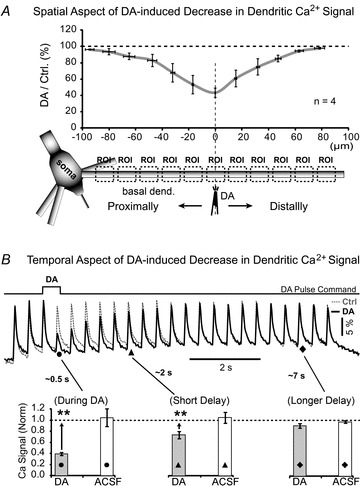
A, drawing depicts a DA-filled pipette near one basal branch. Dashed boxes indicate regions of interest along the dendrite. AP-induced Ca2+ transients were recorded simultaneously at multiple ROIs before (Control) and 500 ms after a brief (100 ms duration) iontophoretic ejection of DA (IPC, 20 mm). Quantification of data was performed by calculating the amplitude ratio between DA and Control for each region of interest (ROI) and averaged across 4 neurons. X-axis indicates distance between ROI and DA application site. Horizontal error bars describe variation in ROI location between 4 neurons. Vertical error bars describe variation in DA/Ctrl ratio between 4 neurons at corresponding ROIs. B, same experimental outline as in A, except DA IPC was 10 mm, and optical recordings are from ROI at the DA application site. In the control sweep (Ctrl, dashed grey line) the cell body was injected with short current pulses to produce a train of 23 somatic APs (2.5 Hz). In the next recording APs were paired with dopamine pressure pulse (DA, thick black line). The command signal for driving the picospritzer valve shows the exact timing of the DA pulse. Dendritic Ca2+ transients are superimposed to show the difference between control (grey) and DA sweep (black). Grey columns: Ca2+ signal amplitudes were quantified at three characteristic time points marked on optical traces by •, ▴ and ♦. The signal amplitude upon DA treatment was normalized to the control measurement (before DA treatment) and averaged (n = 10 neurons). Asterisks compare DA-effects against the matching controls (dashed line 100%) using a paired t test on raw data (before normalization). Open columns: the same as in grey columns except experiments were repeated by omitting DA from the application pipette (ACSF, n = 3).
Temporal aspect of dopaminergic modulation of dendritic Ca2+
In order to detect the earliest DA-induced change in AP signal, in the next series of experiments we applied DA during a train of APs (Fig. 2B, Supplemental Fig. S3). Within the first 500 ms after the onset of a DA puff (DA command pulse), the AP-associated dendritic Ca2+ transients were notably suppressed (Fig. 2B, time point marked by a filled circle, ∼0.5 s). The quantification of data was performed on three time points (three APs) marked by filled circles, triangles and diamonds in Fig. 2B (During DA, Short Delay and Longer Delay, respectively). During active ejection of DA (During DA), the AP-associated Ca2+ signals were significantly smaller than control values in the same cell (Fig. 2B, During DA, grey column), as determined by the paired t test on raw data points (ΔF/F), before normalization (P < 0.01, n = 10). Calcium signals were also significantly smaller than control signals shortly after the cessation of the DA pulse, filled triangle, Short Delay, ∼2 s (P < 0.01), but were not different from control values (dotted line 100%) at a longer time delay (∼7 s) following DA application (filled diamond, Longer Delay, P > 0.05, n = 10). These data showed that the onset of the DA effect on the dendritic Ca2+ transient was rapid (<500 ms) and short-lived. The DA effect was not detectable 7 s after the cessation of the DA pulse (Longer Delay). In other words, the effect of DA on dendritic Ca2+ transients was manifested only during the time period when DA molecules were available in the vicinity of the dendrite (during DA pulse and immediately after the cessation of DA pulse). This result also suggests that the observed spatial profile of the DA effect (Fig. 2A, graph) represents a concentration gradient of DA ejected from the DA application pipette.
When drug-free ACSF was ejected onto the basal dendrite, the amplitudes of AP-mediated Ca2+ transients were not significantly different from control measurements at any of the three chosen time points (filled circles, triangles and diamonds; Fig. 2B, white columns), thus indicating that mechanical artifacts alone could not account for the observed changes in signal size.
Dopamine receptor agonists
When applied locally for 3 s (Fig. 3A), the D1 receptor agonist SKF-38393, at lower concentrations (IPC, 50 μm), did not have an effect on Ca2+ transients (88.7 ± 7.4%, n = 3; N = 3; P > 0.05, paired t test). However, at an IPC of 500 μm, SKF markedly reduced AP-dependent Ca2+ influx in the target segments of basal branches to 60.8 ± 5.2% of its original size (n = 5, N = 9, P < 0.01, paired t test; Fig. 3B and C). Similar results were obtained with another D1 receptor agonist, A-68930 (IPC, 500 μm; 66.7 ± 3.5%; n = 3; N = 6, P < 0.01, paired t test; Fig. 3C). While both D1 agonists SKF-38393 and A-68930 (IPC, 500 μm) robustly and reliably suppressed dendritic Ca2+ transients, the D2 receptor agonist quinpirole (IPC, 500 μm) failed to induce any changes (104.7 ± 11.9%, n = 4; N = 7; P > 0.05, paired t test). Quinpirole had no effect on dendritic Ca2+ transients even at an IPC of 5000 μm (102.0 ± 6.1%, n = 3; N = 7; P > 0.05, paired t test; Fig. 3D). These data indicate that stimulation of D1-like, but not D2-like family receptors, leads to the suppression of AP-evoked dendritic Ca2+ influx in basilar dendrites of PFC pyramidal neurons. An alternative interpretation of these data is that drugs with an affinity for D1-like receptors (dopamine, SKF-38393 and A-68930) directly impede the function of dendritic voltage-gated calcium channels, when applied at high concentration (e.g. >325 μm, based on DA EC50).
D1 dopamine receptor antagonist
In the next series of experiments we tested whether the D1 receptor antagonist SCH23390 (SCH) can block the effect of DA. To avoid a possible contamination of data by non-responder cells, we first verified cells were responsive to DA in regular ACSF (Fig. 3E, DA in ACSF; Supplemental Fig. S4B1). Only if the cell responded to DA, SCH (150 μm) was introduced in the bath and experimental measurements were repeated on the same cell (Fig. 3E, DA in SCH). The amplitudes of dendritic AP-associated Ca2+ transients were significantly reduced by DA, both in the absence (P < 0.01) and in the presence of the D1 antagonist (P < 0.01, n = 5), when compared with their corresponding controls taken just prior to DA application (Supplemental Fig. S4B1). However, the D1 antagonist SCH significantly reduced the effect of DA, as indicated by the comparison of the normalized data groups (Fig. 3E, compare the grey DA bar against the open DA bar, P < 0.01, n = 5). These results suggest the involvement of D1-like receptors in the rapid DAergic modulation of dendritic Ca2+ (Figs 1 and 2).
Intracellular pathway – protein kinases
Dopamine is thought to exert its cellular effects via the activation of protein kinases (Neve et al. 2004). In the next series of experiments we patched five neurons with normal intracellular solution (Regular IC) and established a potent DA effect on dendritic Ca2+ transients (Fig. 3F, open column). Next, the original patch pipette was removed and replaced by a second patch pipette, which was filled with a cocktail of protein kinase blockers (Rp-cAMP (500 μm) and staurosporine (0.4 μm)). After re-patching, the kinase blockers were allowed to diffuse into the cytoplasm for at least 30 min before repeating the DA stimulation on the same dendrite. Re-patching of the neurons allowed us to perform a direct comparison of the DA effects on the same cell, in the absence and in the presence of intracellularly applied drugs (Fig. 3F). A paired t test failed to detect statistical difference between the two conditions (P > 0.05, n = 5). These data suggest that the observed DA effects (Figs 1 and 2) were not mediated through the activation or inactivation of intracellular protein kinases.
Dendritic AP waveforms
Two groups recently reported that DA suppresses dendritic Ca2+, but they did not investigate if this result was due to a DA-induced perturbation of the AP amplitude (Day et al. 2008; Kisilevsky et al. 2008). In order to analyse AP voltage waveforms in thin dendritic branches we employed a voltage-sensitive dye-imaging technique using whole-field illumination (Acker & Antic, 2009) or laser-spot illumination (Zhou et al. 2007). DA was pressure applied from a glass micropipette positioned near the dendritic shaft (Fig. 4A). AP-associated dendritic voltage signals were recorded before dopamine application (Fig. 4B, Ctrl), 2 s post-dopamine puff (DA), and again after a 90 s washout period (Wash). In 7 out of 14 neurons, local DA applications caused a small decrease in AP amplitude and a small increase in AP half-width (Fig. 4C). Group data showed that in apical dendrites (199 ± 67 μm from the soma) the average amplitude of the dendritic AP upon dopamine application compared with the control values was 84.5 ± 3.7% (paired t test, P < 0.01, n = 14, N = 21; Fig. 4D). The AP half-width increased to 106.1 ± 2.1% (P < 0.05; Fig. 4E), while the area under the AP did not change significantly (93.2 ± 4.7%, P > 0.05, Fig. 4F), compared with controls obtained before DA application.
Figure 4. Dendritic AP waveform upon DA stimulus – apical dendrites.
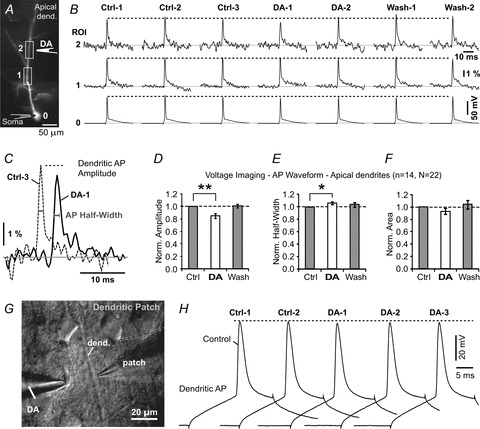
A, pyramidal neuron filled with voltage-sensitive dye JPW-3028. The drawing marks position of DA-filled pipette. B, dendritic AP waveforms before (Control), upon (DA) and 2 min after the DA application (Wash). Control measurements were performed 3 times (Ctrl 1–3), while DA and Wash recordings were performed two times each. Each signal is temporal average of 3 sweeps. C, AP waveform Ctrl-3 is superimposed on AP waveform DA-1 to show DA-induced changes in AP amplitude and half-width. D, AP amplitudes during treatment with DA were normalized against the control measurements made before DA puff, and averaged across 14 apical dendrites (N = 22 DA applications). E and F, same as D except AP half-width and AP area under the curve were quantified. Paired t tests were performed on raw data before normalization. G, IR DIC photograph of a patched apical dendrite. H, dendritic action potentials before (Control) and during DA pressure ejections (DA-1 to DA-3).
We patched three apical dendrites (130–150 μm from the soma) and locally applied DA to the dendritic segment where whole-cell patching was performed (Fig. 4G). Under infrared video-microscopy, we visually monitored the jet of ejected dopamine (IPC, 10 mm), while simultaneously recording dendritic AP voltage waveforms (Fig. 4H). DA puffs (duration, 2 s) caused a small decrease in dendritic AP amplitude (98.0 ± 0.5%), an increase in AP half-width (100.9 ± 1.1%), and a decrease in area under the AP (98.3 ± 1.1%) (13 DA applications in 3 neurons), compared with the control measurements performed just prior to DA application. A paired t test performed on the data points before normalization revealed a statistically significant change in AP amplitude (P < 0.05), but not in AP half-width or area.
The next series of experiments addressed DAergic modulation of AP waveform in the basal dendrites of PFC layer V pyramidal neurons (Fig. 5A) using voltage-sensitive dye imaging (Fig. 5B). DA applications caused small (∼5%), albeit statistically significant, changes in AP amplitude. The group data showed that in basal dendrites (165 ± 50.9 μm from the soma) the average amplitude of dendritic APs upon dopamine application (IPC, 10 mm) was 94.8 ± 1.6% of the control values (paired t test, P < 0.01, n = 6; N = 19; Fig. 5C). The AP half-width did not change (97.4 ± 4.2%, P > 0.05; Fig. 4D), while the area under AP decreased to 92.1 ± 2.1% (P < 0.01; Fig. 4E) compared with controls obtained before DA application.
Figure 5. Dendritic AP waveform upon DA stimulus – basal dendrites.
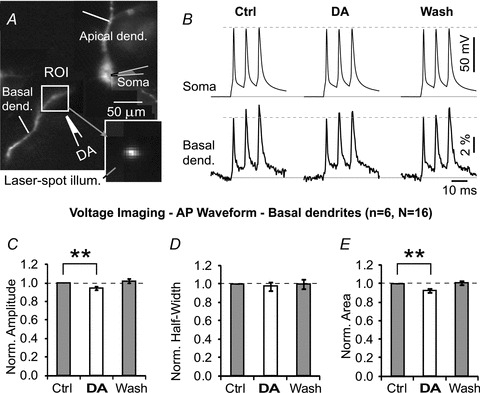
A, pyramidal neuron filled with JPW-3028. Box marks the region targeted by a stationary laser beam. Inset, an actual image of this dendrite during ‘laser-spot’ illumination. B, voltage waveforms of dendritic action potentials before (Control), upon DA pressure ejection (DA puff), and 90 s after DA application (Wash), recorded inside the ROI. C–E, quantification of AP amplitude, AP half-width and AP area under the curve in 6 neurons (16 DA applications on basal dendrites). Paired t tests were performed on raw data before normalization.
In summary, local DA stimuli (IPC, 10 mm) induced small changes in the amplitudes of backpropagating APs in both apical and basal dendrites: ∼15% and ∼5%, respectively. These data do not fit well with DA-induced changes in dendritic Ca2+ influx, which were approximately 40% (Fig. 1D, at IPC of 10 mm). Calcium channels are predominantly activated during the repolarization of the AP and therefore AP amplitude has little impact on Ca2+ influx. However, the shape of the AP in our experiments was minimally affected by the DA pulse, according to the small changes in AP half-width and AP area under the curve from both apical (Fig. 4E and F) and basal dendrites (Fig. 5D and E). A substantial fraction of cortical pyramidal neurons do not respond to dopaminergic stimulation (Sesack & Bunney, 1989; Kisilevsky et al. 2008; Moore et al. 2011; present study). Even a small number of DA-insensitive neurons in the group data (Fig. 4E and F or Fig. 5D and E) would explain the absence of a significant change in AP voltage waveform. To improve the robustness and reliability of our study we examined dendritic AP waveforms in cells that were positively responsive to DA stimulus. Towards this goal we employed dual-mode dendritic imaging (Fig. 6A and B), where both Ca2+ and voltage transients were recorded from the same region of interest (Canepari et al. 2007; Milojkovic et al. 2007). Calcium–voltage imaging experiments performed in nine DA-responsive layer V pyramidal cells showed a statistically significant reduction in AP-induced Ca2+ signal (55.9 ± 7.2% of control; P < 0.01, paired t test on raw data; Fig. 6E), which was not accompanied by a comparable change in AP amplitude (voltage-sensitive dye signal) in the same dendritic segment (92.0 ± 4.1% of control; P < 0.05, paired t test on raw data; Fig. 6E). Next, we compared normalized calcium signals against normalized voltage signals obtained in the same ROI. Both calcium and voltage signals were divided by their corresponding controls obtained prior to DA application (Fig. 6C and D, Ctrl). A DA-induced decrease in the Ca2+ signal was significantly stronger than the DA-induced decrease in the voltage signal in the same dendritic segment, as determined by a paired t test on normalized data (P < 0.01, n = 9, Fig. 6F). Together, dendritic voltage imaging (Figs 4 and 5), dendritic whole-cell recording (Fig. 4G and H) and dendritic voltage–calcium imaging (Fig. 6) suggest that DA-induced suppression of AP-mediated dendritic Ca2+ influx is not due to reduction in dendritic AP amplitude.
Figure 6. Calcium imaging and voltage imaging in the same dendrite.
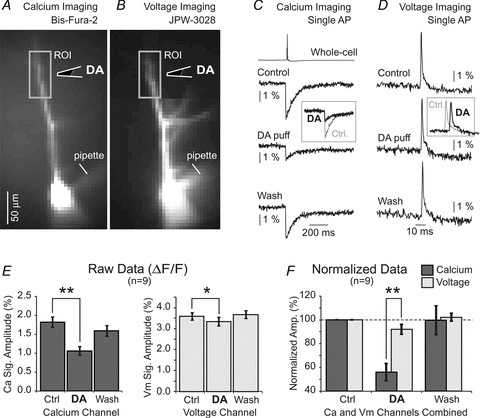
One pyramidal neuron filled with two fluorescent dyes. A, image captured using optical filters for bis-fura-2. B, image captured using filters for JPW-3028. Drawing marks position of the DA-filled pipette (IPC, 10 mm). C, somatic action potential (whole-cell) is aligned with dendritic Ca2+ transients measured inside the box shown in A, before (Control), 4 s after DA puff and 2 min after the DA puff (Wash). D, dendritic action potential voltage waveforms measured inside the box shown in B, before (Control), upon DA puff, and 2 min after the DA puff (Wash). E, left, averaged Ca2+ signal amplitude (ΔF/F) in three conditions. Right, changes in voltage signal amplitude in the same ROI where Ca2+ signal was measured (n = 9). Paired t tests performed on raw data, before normalization. F, same data as in E, except signal amplitudes were normalized in respect to corresponding control measurements. Paired t test performed on the normalized data.
Apical vs. basal dendrites
In four pyramidal neurons we were able to move the DA application pipette from a basal dendrite to the apical dendrite (Fig. 7A) and vice versa, without disrupting the patch. An identical experimental protocol involving dendritic Ca2+ imaging and local DA application was carried out in both locations (Fig. 7B). On average, the DA-induced signal reduction (relative change in signal amplitude compared with control measurements) was stronger in basal branches than that in the apical trunk of the same cell. A paired t test showed a statistically significant difference in response between basal and apical dendrites belonging to the same neuron (P < 0.05, n = 4, Fig. 7C, grey columns).
Figure 7. Apical vs. basal dendrites.
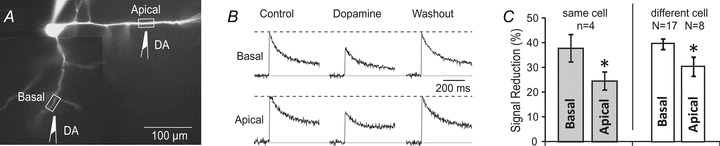
A, pyramidal neuron filled with OGB-1. Drawings mark two positions of the same DA-filled pipette. B, AP-associated Ca2+ transients were recorded in basal dendrite before (Control), upon DA pressure application (Dopamine) and 1–2 min after DA treatment (Washout). The same DA pipette was then moved from basal dendrite onto the apical trunk and the same experimental protocol was repeated in the apical location (Apical row). C, relative reduction in dendritic Ca2+ signal was averaged and plotted for two locations on the same neuron (n = 4 cells, grey columns, paired t test) and for a set of basal (N = 17) and set of apical dendrites (N = 8) belonging to different neurons (open columns, unpaired t test). All dendrites in this figure were treated with the same IPC of DA (10 mm).
Next, we pooled the data from neurons treated with local application of DA (IPC, 10 mm) on either basal (N = 17) or apical (N = 8) dendrites. DA treatments caused 39.9 ± 2.1% reduction of Ca2+ signal in basal dendrites and 30.8 ± 3.9% reduction in apical dendrites (Fig. 7C, open columns). An unpaired t test indicated that in basal dendrites DA exerts slightly stronger, albeit statistically significant (P < 0.05), inhibitory effects than in the apical dendrites of the same neuron type.
Voltage-gated calcium channels
Availability and robustness of drugs that block L-, R-and T-type voltage-gated calcium channels (VGCC) allowed us to ask if the DA effects on AP-induced Ca2+ transients were still present after the L-, R- and T-type channels were pharmacologically blocked. In this experimental design the inhibitory effect of DA puff was first established in regular saline solution, by performing control, DA1 and wash measurements (Fig. 8B, Normal ACSF). Next, a cocktail of L-type calcium channel antagonists (verapamil (10 μm) and diltiazem (10 μm)) were introduced in the bath. Addition of the cocktail (V+D) reduced the AP-associated dendritic Ca2+ transients significantly (P < 0.01, n = 4, N = 7, Fig. 8C, left). Despite this drug-induced reduction in Ca2+ signal, a transient puff of DA was able to further reduce the amplitude of the dendritic signal (Fig. 8B, DA2). The relative magnitude of the DA effect was still around 35%, regardless of blocking the L-type channel with V+D. The DA2/Ctrl2 ratio obtained in drugs was not statistically different to the DA1/Ctrl1ratio obtained in normal ACSF (P > 0.05, n = 4, N = 7, Fig. 8C, right). Nearly identical data were obtained when nickel (100–200 μm) was used to block R- and T-type VGCCs. Just as V+D, nickel also significantly reduced dendritic Ca2+ transients (P < 0.01, n = 5, N = 11, Fig. 8D, left). Despite blocking nickel-sensitive calcium conductances, a transient puff of DA was still able to further reduce the amplitude of the dendritic calcium signal. The DA2/Ctrl2 ratio obtained in nickel was not statistically different than the DA1/Ctrl1 ratio obtained in regular ACSF (P > 0.05, n = 5, N = 11, Fig. 8D, right). These data suggest that the observed DA effect on AP-associated dendritic Ca2+ transients (Figs 1–7) was not primarily based on inhibition of L-, R-or T-type VGCCs.
Figure 8. DA effect in the absence of L-type and R/T-type calcium channels.
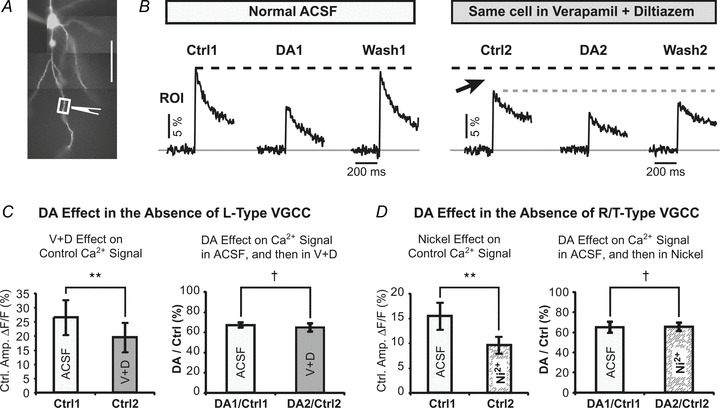
A, pyramidal neuron filled with OGB-1. Drawing marks the position of the DA-filled pipette (IPC, 10 mm). B, AP-associated Ca2+ transients were recorded in basal dendrite before (Ctrl1), upon DA pressure application (DA1), and 1–2 min after DA treatment (Wash1). Next, a cocktail of L-type calcium channel antagonists (verapamil, 10 μm) and diltiazem (10 μm), ‘V+D’) were added to the perfusate, and the same experimental protocol was repeated. C, left, average amplitudes of control Ca2+ transients before (ACSF) and after addition of V+D, expressed as ΔF/F. The cocktail ‘V+D’ potently reduced dendritic AP-Ca2+ transients. Paired t test on raw data, **P < 0.01, n = 4, N = 7. Right, the DA effect, expressed as a relative reduction in dendritic Ca2+ signal, is shown before (ACSF) and after introduction of V+D in the same cell. Paired t test, †P > 0.05, n = 4, N = 7. D, same as in C except brain slices were perfused with R/T-type channel antagonist nickel (100–200 μm). **P < 0.01; †P > 0.05, n = 5, N = 11.
GABA vs. dopamine
So far, our experimental data suggest that DAergic modulation interferes with some, but not all, aspects of dendritic AP backpropagation. For example, dendritic Ca2+ influx was markedly reduced (Fig. 1) but the dendritic AP voltage waveform was not strongly altered by DA (Fig. 6). GABA has been shown to inhibit dendritic electrical and calcium transients (Tsubokawa & Ross, 1996; Larkum et al. 1999; Couey et al. 2007; Vogt et al. 2011); thus, we wished to compare GABAergic and DAergic modulation of AP backpropagation in the PFC cortical pyramidal neurons. To provide the most direct comparison between these two neurotransmitters, in the next series of experiments we applied sequential puffs of GABA and DA onto the same dendritic segment, while measuring dendritic AP-associated Ca2+ transients along the entire branch. In this experimental protocol two glass pipettes (one filled with GABA (1 mm) and the other filled with DA (10 mm)) were both positioned in the mid-dendritic segment, as shown in the schematic drawing in Fig. 9A. Local puffs of GABA (duration, 20–200 ms) caused elimination of AP-mediated Ca2+ influx distally from the drug application site (Fig. 9B, arrow). Local puffs of DA (duration, 500 ms), on the other hand, caused only local reductions in Ca2+ signal at the sites of DA application (Fig. 9C ROI 2), while Ca2+ transients in dendritic segments distal to the DA application site were unaffected (Fig. 9C, arrow). This suggests a successful AP backpropagation through the site of DA application. The actual image of a neuron and additional recording sites during sequential GABA and DA applications are displayed in Supplemental Fig. S5. The group data obtained in five neurons showed that application of GABA caused the elimination of AP-associated Ca2+ transient distal to the application site (Fig. 9D, +80 μm), while DA-induced changes (n = 7) were restricted to the DA application site (Fig. 9E, DA, 0 μm).
Figure 9. DA vs. GABA on the same dendrite.
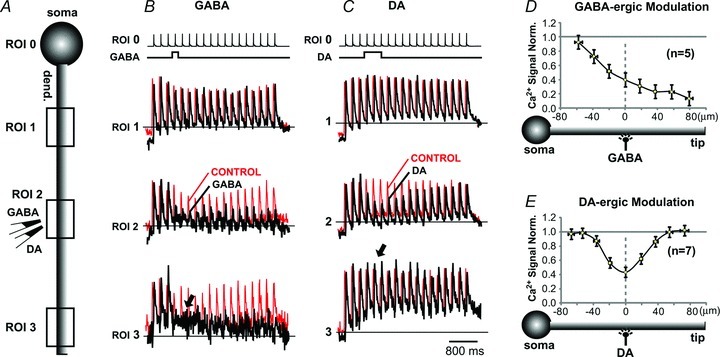
A, experimental outline showing DA-filled and GABA-filled pipette converging on a middle segment of one basal dendrite. B, in the first sweep (Control) the cell body was injected with short current pulses to produce a train of somatic APs (ROI 0). The corresponding dendritic Ca2+ transients were recorded simultaneously from 3 ROIs (1–3) and arbitrarily scaled for display. In the next sweep (GABA) APs were paired with GABA puff. Control and GABA sweeps are superimposed for comparison. C, same cell, same detectors, same scaling as in B except recordings were made before (Control) and after local application of dopamine (DA). D and E, drug-induced changes in signal amplitude along a dendritic branch normalized against control measurements in neurons treated either with GABA (n = 5) or DA (n = 7) on the mid-segment of a basal branch, as depicted schematically below each graph. Fifth AP in the train was used for quantification of these data. Control measurements were obtained just prior to each drug application. GABA: IPC, 1 mm; duration, 20–200 ms. DA: IPC, 10 mm; duration, 500 ms. Local application of DA causes a spatially restricted reduction in dendritic AP-mediated Ca2+ influx. DA application at mid-dendritic segment did not affect AP signals in distal dendritic tip (arrow in C). GABA puff eliminated AP-Ca2+ signals from dendritic segments distally from the GABA application site (arrow in B).
Dendritic voltage waveforms upon GABA stimulation
Elimination of AP-mediated Ca2+ influx distal to the GABA application site (Fig. 9B, ROI 3) could have been due to a complete block of AP backpropagation, or due to GABA modulation of Ca2+ flux. To resolve this question we performed multisite voltage-sensitive dye recordings of backpropagating APs using whole-field illumination (Acker & Antic, 2009). Amplitudes of dendritic APs were severely attenuated at the GABA application sites (Fig. 10Ab, Sweep 2, ROI 2a), but also, and to an even greater extent, in the dendritic segments distal to the GABA application site (ROIs 2b and 2c). Identical data were obtained in three layer V pyramidal neurons.
Figure 10. Effect of GABA on dendritic AP waveforms – neurons with intact intracellular [Cl−].
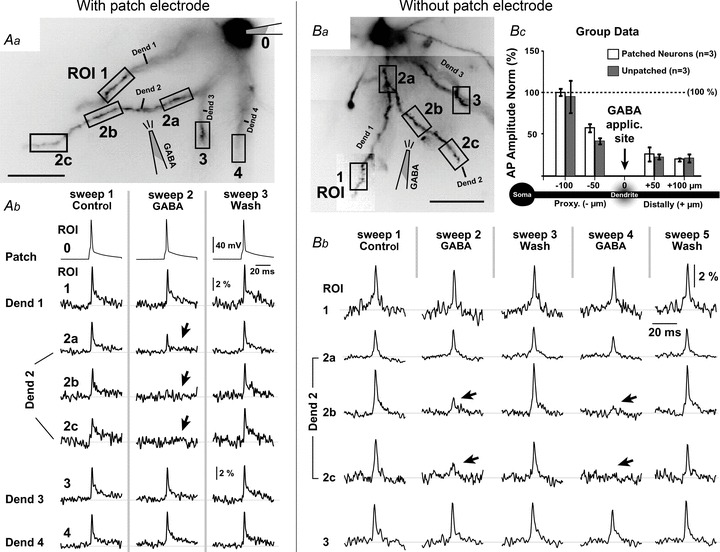
Aa, pyramidal neuron filled with JPW-3028. Fluorescent image inverted. Ab, in the control sweep (Control) a current-evoked AP is recorded simultaneously via the patch pipette (ROI 0) and optically at 6 ROIs shown in Aa. In the next sweep (GABA) a puff of GABA is delivered at the location marked by drawing in Aa. GABAergic stimulus suppresses dendritic voltage transients locally (ROI 2a), but also in distal dendritic segments (ROIs 2b and 2c). The effect of GABA was reversed 90 s later (Wash). Ba, pyramidal neuron was filled with JPW-3028 and the dye-loading patch pipette was removed. Bb, in the control sweep (Control) an AP was evoked by extracellular electric shock and recorded simultaneously at 5 ROIs shown in Ba. In the next sweep (sweep 2 GABA) a puff of GABA is delivered at the location marked by drawing in Ba. The effect of GABA is reversed 90 s later (Sweep 3 Wash). The second GABA application and its wash (sweeps 4 and 5) were similar to the first application and its wash (sweeps 2 and 3). Bc, peak amplitudes of dendritic AP voltage waveforms obtained during GABA application (sweep 2) were normalized to control measurements (sweep 1), binned across 50 μm-long dendritic segments, and plotted against the relative distance from the GABA application site. Regardless of the presence (open) or absence (grey) of the whole-cell pipette, GABA causes a complete block of AP backpropagation distally from the application site (positive micrometer values).
It is currently thought that GABA depolarizes dendritic branches of cortical pyramidal neurons (Gulledge & Stuart, 2003). The depolarizing action of GABA may amplify AP-associated voltage transients in distal dendritic branches, rather than attenuate them as observed in our experiments (Fig. 10A). Experiments described in Fig. 10A were performed with patch pipettes in whole-cell configuration. The ensuing dialysis of the neuronal intracellular space disrupts the natural concentration of chloride ions (Cl−) and the GABAA receptor reversal potential (Kaila, 1994). To address this caveat, in the next series of experiments we analysed the GABAergic effect on dendritic voltage transients without the use of patch electrodes (Canepari et al. 2010). Neurons were filled with the voltage-sensitive dye and then dye-loading pipettes were removed. Canepari et al. (2010) have shown that physiological concentrations of Cl− are established within 10–15 min of removal of the patch pipette. We allowed more than 60 min between pipette removal and the beginning of the optical recording session. With intact ionic milieu (without patch electrode, n = 3), the suppressing effect of GABA on the AP amplitude was transient, localized to the target branch (Fig. 10Ba–b dendrite 2), and removed by washing (Fig. 10Bb, sweeps 3 and 5). Quantification of group data (Fig. 10Bc) showed that local GABA puffs caused a clear block in AP backpropagation in both groups of neurons: Group 1 cells with the patch pipette attached in whole-cell configuration (open) and Group 2 cells free from the patch pipette (grey). Unlike dopamine (Fig. 9C, arrow), the local GABAergic applications obstructed propagation of electrical transients along the GABA-receiving dendritic branch (Figs 9D and 10).
Physiological changes during dopamine modulation of dendritic calcium influx
The physiological significance of dopaminergic suppression of dendritic Ca2+ (Figs 1–7) was studied next by monitoring two parameters: (a) the excitability of the neuronal cell body, and (b) the frequency-dependent AP backpropagation in basal dendrites; during the time period when DA stimulus was presented to the basal dendrite.
(a) Neuronal excitability – somatic action potential firing
Generation of a sodium AP in the axon initial segment (Palmer & Stuart, 2006; Popovic et al. 2011) is the primary goal of synaptic integration. We asked if the ability of a pyramidal cell to generate APs was changed during DAergic modulation of dendritic function (Figs 1 and 2). In this series of experiments we first used calcium imaging (Fig. 11A) to determine whether dendritic calcium transients were sensitive to DAergic modulation (Fig. 11B), and only in this case was the experiment continued. Next, we injected a depolarizing current pulse (C.I., duration, 800 ms) into the cell body to generate a train of APs (Fig. 11C, Ctrl). The same DAergic stimulus, previously shown to suppress dendritic Ca2+ influx (Fig. 11B, DA), was then re-applied in the middle of the AP train in an attempt to alter the rate of neuronal AP firing (Fig. 11C, DA). APs were counted in the time window marked by the rectangle (Fig. 11C). A paired t test failed to detect any significant differences between sweeps acquired before DA application (Fig. 11D, Ctrl) and those acquired during DA application (DA, paired t test, P > 0.05, n = 7). These data indicate that dopaminergic stimuli received in distal dendritic segments do not affect current-evoked APs in the soma.
Figure 11. Dendritic stimulation with DA does not affect somatic excitability.
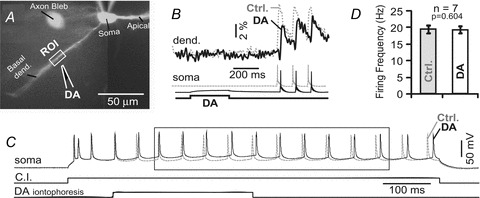
A, pyramidal neuron filled with OGB-1. The drawings mark the positions of sharp (40 MΩ) DA-filled pipette (IPC, 100 mm). B, AP-associated dendritic Ca2+ transients (dend.) were recorded before (dashed grey line) and after DA treatment (black line) and superimposed for comparison. Exact timing of DA iontophoretic pulse (duration, 300 ms) is marked by the bottom trace. C, same DA puff was applied while the neuron was driven by current injection (C.I.; duration, 800 ms) to fire APs. Rectangle indicates time window used to quantify AP frequency. D, average AP firing frequency before (Ctrl) and during DA application on basal dendrite (DA).
(b) Frequency-dependent AP backpropagation
It was previously shown that Ca2+ influx in basal dendrites of neocortical pyramidal neurons is frequency dependent. Robust Ca2+ signals were detected only at high firing rates (Kampa et al. 2006). In light of the importance of high-frequency AP bursts for synaptic plasticity in basal dendrites (Kampa et al. 2006) we designed experiments to test if DAergic regulation of AP-associated Ca2+ signals in basal dendrites was frequency dependent (Fig. 12A). In control measurements, pyramidal neurons were driven by brief current pulses to fire three APs, while dendritic Ca2+ signals were measured along the basal dendrite (Fig. 12B, Control). In the following trials, iontophoretic DA pulses (duration, 300 ms; intensity, 1.2 μA) were applied 400 ms before AP triplets (command pulses shown in Fig. 12A, top). Dopaminergic stimulation of the basal dendrite (160.4 ± 12.2 μm to the soma, n = 7) did not cause any obvious changes in AP backpropagation at various frequencies, apart from a simple scaling-down of the calcium signal amplitude (Fig. 12C). This could be due to one of two reasons. First, non-linear phenomena such as AP-induced dendritic Ca2+ electrogenesis are usually found in dendrites at large distances from the cell body (Larkum et al. 1999; Kampa & Stuart, 2006). Second, the intensity of the DA stimulus was perhaps too weak to reach a critical DA concentration required to alter frequency-dependent AP backpropagation. To address these two issues we tested more distal segments of basal dendrites (179.8 ± 13.6 μm, n = 4) using a 50% stronger DA stimulus (1.8 μA). The stronger DA stimulus caused stronger reductions in the Ca2+ signal amplitude (Fig. 12D). The DA effect again was uniform across all frequencies within the tested range, as normalized responses revealed identical curves in Control and DA conditions (Fig. 12C and D, ratio 3 AP/1 AP). In summary, although the amplitude of the Ca2+ signal was strongly reduced by DA (Fig. 12CD, upper graphs), the relative increase in dendritic Ca2+ signal in response to growing AP frequency was not affected by DA (Fig. 12C and D, lower graphs). This shows that the effect of DA was uniform across different AP firing frequencies.
Figure 12. DA effect on dendritic calcium during high-frequency AP firing.
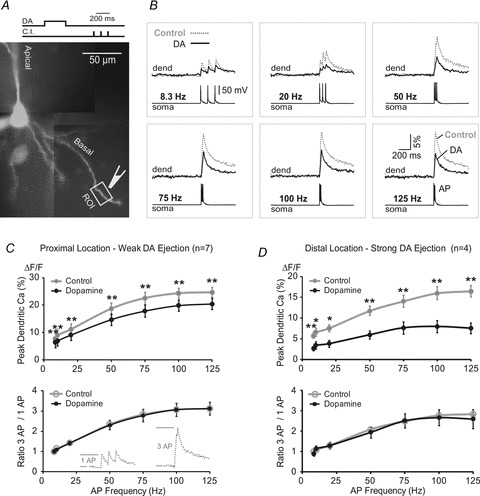
A, pyramidal neuron filled with OGB-1. Drawings marks the position of DA-filled pipette (IPC, 10 mm) at 145 μm path distance from the centre of the soma. B, current-injection evoked AP triplets were recorded electrically from the cell body (soma) and optically from ROI shown in A (dend). Current injection and DA iontophoresis commands are also shown in A. Recordings made before DA application (Control, dashed grey line) and upon DA iontophoresis (DA, black line) are superimposed for comparison. In the same neuron, the Control and DA recordings were made across a range of AP firing rates (8.3–125 Hz), as indicated. C, upper graph, for a given AP firing rate the peak amplitude of dendritic Ca2+ signals (expressed as ΔF/F) was averaged across 7 neurons before (Control) and after treatment with iontophoretic current intensity of 1.2 μA (Dopamine). An average distance from the soma for ROIs was 160.4 ± 12.2 μm (n = 7). Lower graph, relative increase in Ca2+ signal amplitude with increasing AP firing frequency. Inset, first AP at 8.3 Hz was used for calculating ratio 3AP /1AP. An example of 3 AP (50 Hz) is shown on the right. D, same as in C, except DA iontophoretic current was set to 1.8 μA and ROI was more distal (179.8 ± 13.6 μm, n = 4).
Discussion
Our current experiments attempted to mimic the spatial and temporal attributes of synaptic DAergic stimuli that impinge on dendrites of cortical pyramidal neurons (Goldman-Rakic et al. 1989) during phasic DA signalling (Ljungberg et al. 1992) by application of exogenous DA directly onto a dendritic branch (Day et al. 2008). We found that brief puffs of DA, delivered either by pressure (Figs 1, 6 and 7), or iontophoretic current (Figs 2, 11 and 12), transiently suppressed AP-mediated dendritic Ca2+ influx. The DA effect was rapid, as changes in the amplitude of Ca2+ influx were regularly detected less than 500 ms from the onset of DA pulse (Fig. 2B), consistent with the time scale of a 500 ms (phasic) burst of midbrain dopaminergic neurons that project into the prefrontal cortex (Ljungberg et al. 1992; Schultz, 2002). The DA effect was mimicked by D1-like receptor agonists, independent from the activation of intracellular protein kinases, and was exclusively restricted to the dendritic membrane in direct contact with a high concentration of DA molecules. These results suggest that DA molecules interfere with calcium influx via a direct protein/G-protein link between the D1 receptor and voltage-gated Ca2+ channel (Dolphin, 2003; Kisilevsky et al. 2008), or by clogging the pore of the calcium channel, or both. AP voltage waveforms in the basal dendrites of PFC neurons are very sensitive to perturbations in voltage-gated Na+ and A-type K+ current (Acker & Antic, 2009). DA molecules specifically affected VGCCs, but to a far lesser degree the dendritic Na+ channels or K+ channels, as relatively strong DAergic stimuli had a small effect on the dendritic AP waveform (Figs 4 and 5). Dual voltage–calcium imaging data (Fig. 6) eliminated a possibility that DA-resistant neurons, ‘non-responders’ (Sesack & Bunney, 1989; Surmeier et al. 1995; Day et al. 2008; Kisilevsky et al. 2008; Moore et al. 2011), contaminated our experimental groups and biased our data interpretation toward the conclusion that DA stimulation minimally affects dendritic AP waveform. That the DA effect on the AP voltage waveform was negligible was also supported by a large number of measurements that documented successful propagation of AP through the DA application site. That is, AP-associated Ca2+ transients were regularly found distally from the DA application site (Figs 2A and 9E).
Voltage-gated calcium channels
Taken together, our data indicate that the primary effect of a brief dopaminergic stimulus is a temporary inhibition of dendritic VGCCs. The precise identity (subtype) of the dendritic Ca2+ channel involved is unclear. In cortical layer V pyramidal neurons, an AP propagating from the soma into the apical dendrite evokes a rapid Ca2+ transient via activation of four VGCC subtypes: L-, N-, P- and R-type, each contributing to the calcium influx 25%, 28%, 10% and 37%, respectively (Markram et al. 1995). The detection of these four VGCC subtypes is consistent with the findings from other groups (Westenbroek et al. 1992; Lorenzon & Foehring, 1995; Castelli & Magistretti, 2006). T-type VGCCs were detected in dendrites by histochemistry (Craig et al. 1999; McKay et al. 2006) but not confirmed by electrophysiology (Almog & Korngreen, 2009). Therefore, there are at least six potential VGCC subtypes populating cortical pyramidal neurons: L-, N-, P-, Q-, R- and T-type. It is experimentally challenging to determine if only one, or two or more VGCC subtypes are suppressed by DA. Some experimental data are already available to help resolve this issue. First, our experiments with VGCC blockers (Fig. 8) rejected the possibility that L-, R- and T-type channels are primary substrates of the observed DA effect. Second, N-type channels in dendrites of rat PFC neurons are strongly inhibited by DA through a D1 receptor–N-type channel signalling complex (Kisilevsky et al. 2008). In medium spiny neurons, the presence of the D2 receptor agonist, quinpirole, reduces AP-evoked Ca2+ influx through R-type voltage-gated Ca2+ channels (Higley & Sabatini, 2010). However, another group have shown that applications of D1 agonists transiently reduced N- and P-type Ca2+ currents in medium spiny neurons (Surmeier et al. 1995). Therefore, several lines of arguments support the idea that N-, P- and Q-type channels are likely to be the targets of DAergic synaptic inputs on PFC pyramidal neurons (Goldman-Rakic et al. 1989).
Dopamine concentration
Ejection of drugs from micropipettes (∼7 MΩ) typically results in extracellular drug concentrations that are one or two orders of magnitude lower than that inside the pipette. Still, one may argue that the extracellular DA concentrations achieved in the present study were unphysiological. The exact physiological range of DA concentrations generated inside the synaptic cleft upon a phasic discharge of an assembly of midbrain neurons (Grace & Bunney, 1984; Ljungberg et al. 1992) is currently unknown. The concentration of extrasynaptic DA, measured by a large carbon fibre (or microdialysis), is a severe underestimate of actual DA concentration peaks in the extracellular space due to a large surface area of the active electrode and the scarcity of DA-releasing boutons. Furthermore, the reported micromolar concentrations of DA in the PFC extracellular space (Garris & Wightman, 1994) are very different from the actual peak DA concentration inside the DA synaptic cleft sealed by glial processes. Some researchers postulate that peaks of DA concentration inside synaptic clefts of DA synapses may reach millimolar values during an outburst of midbrain DA neuron firing (Garris et al. 1994; Grace et al. 2007). The present results and conclusions (Figs 1–8) pertain to dendritic plasmalemma directly opposed to DA synapses.
GABA vs. dopamine
GABAergic and DAergic axons make direct synaptic contacts on dendritic branches of cortical pyramidal neurons (Goldman-Rakic et al. 1989; Somogyi et al. 1998). In our experimental protocol (local puff in vitro) both neurotransmitters suppress AP-associated dendritic Ca2+ influx. Simultaneous multisite measurements revealed an interesting spatio-temporal distinction between these two forms of inhibition. GABAergic stimuli unselectively blocked both dendritic Ca2+ and dendritic electrical signals distally from the GABA application sites (Figs 9D and Fig. 10). Local applications of DA, on the other hand, suppressed dendritic Ca2+ transients only locally, but they did not block sodium APs that pass through the site of DA input on the way to distal dendritic segments (Fig. 9E). Our summary figure (Supplemental Fig. S6) is consistent with anatomical organizations of the cortical GABAergic and DAergic systems. GABA-releasing fibres impinge on dendritic shafts (Beaulieu & Colonnier, 1985), while DA fibres mostly target individual dendritic spines (Goldman-Rakic et al. 1989). A transient release of GABA provides robust and reliable inhibition of an entire segment of the dendritic tree distally from the GABA input (Supplemental Fig. S6A), while DAergic inhibition is more selective, probably confined to a few dendritic spines (Hoogland & Saggau, 2004), less potent than the GABAergic inhibition (Gulledge & Stuart, 2003; Kisilevsky et al. 2008; Higley & Sabatini, 2010), and does not represent an obstacle for propagation of information encoded by electrical transients – APs (Supplementaly Fig. S6B).
Our data suggest that the role of the synaptic dopamine release is to reduce calcium influx in the postsynaptic compartment, without interfering with the propagation of electrical signals. Two major cortical neurotransmitters (glutamate and GABA) concurrently change both electrical and calcium signals. Dopamine is unique because it can modulate the calcium flux without affecting electrical coupling between two compartments. An electrical signal of sufficient amplitude (e.g. AP) can pass the dopamine input site and continue its propagation along the dendrite, with no apparent loss of information.
Other functional implications
Our data (Fig. 11) indicate that local dopaminergic modulation of Ca2+ influx in distal dendrites does not interfere with the AP initiation, which takes place in the axon initial segment (Kole et al. 2008; Popovic et al. 2011). Rather, the effect of a brief and local (synaptic-like) DA input is exclusively restricted to one dendritic segment engulfed in DA. This is consistent with the anatomical distribution of DA synapses in distal dendrites (Goldman-Rakic et al. 1989). It is also consistent with the spatially restricted effect on AP-associated Ca2+ influx (Fig. 2A), and with the finding that cytosolic protein kinases are not involved (Fig. 3F). In other words, brief DA stimuli received on one dendritic segment do not produce diffusible intracellular signals capable of changing the physiology of adjacent neuronal compartments (Figs 2A and 11). However, this is not to say that dopaminergic afferents in the PFC are completely uncoupled from the AP initiation process. Given the recent evidence of the selective inhibition of T-type calcium channels in the axon initial segment by dopamine, leading to marked AP firing pattern changes (Bender et al. 2012), as well as the documented high density of dopaminergic fibres in deep cortical lamina, where axon initial segments of layer V pyramidal neurons reside (Sesack et al. 1989), we cannot entirely exclude that DA release from midbrain fibres in the deep lamina of the PFC will also impact on the AP initiation process. In fact, in PFC layer V pyramidal neurons a brief DA application delivered approximately 30 μm from the axon initial segment (at the neuronal cell body), causes a severe interruption in AP firing (Moore et al. 2011, their Fig. 4).
Suppression of synaptic plasticity may be one functional role of synaptic dopamine. Based on the importance of intracellular Ca2+ (Sabatini et al. 2001) and a robust DA-mediated suppression of dendritic Ca2+ (Figs 1–8), it is possible that phasic dopamine activity affects the plasticity of pyramidal neurons in the prefrontal cortex. For example, during phasic AP firing in midbrain dopaminergic neurons, the dendritic spines and short segments of dendritic shafts near DA contacts (Supplemental Fig. S6B, red sphere) receive less Ca2+ and therefore would be excluded from Ca2+-mediated processes, such as synaptic plasticity. In this scenario, a phasic DAergic signal (Grace & Bunney, 1984; Ljungberg et al. 1992) would serve to protect a subset of synaptic inputs from undergoing modulations in efficacy. On any given pyramidal cell, only a fraction of dendritic spines receives direct synaptic inputs from DAergic fibres (Bergson et al. 1995). One is tempted to postulate that dendritic spines that do receive direct synaptic DA contacts are ‘strategically important’. By being essential for the nature of the neuron's computational task, these strategically important synapses are targeted by dopaminergic axon terminals. The synaptic efficacy of such synapses is preserved in the long run, as they resist Ca2+-mediated functional changes by receiving DA during salient events, such as pleasure, stress, punishment and sexual arousal (Abercrombie et al. 1989; Schultz, 2002). The proposed scenario does not exclude the role of DA in promoting synaptic plasticity. At the sites of direct DAergic contact the synaptic plasticity is opposed by high concentration of DA, but DA spill-over from DAergic synapses, as well as dopamine released from non-synaptic DAergic boutons, operate in low concentration regimen and as such may promote synaptic plasticity (Jay, 2003; Seamans & Yang, 2004; Matsuda et al. 2006).
Protection from excitotoxicity may be one of the functional roles attributable to synaptic dopamine. This hypothesis is derived from the harmful effect of Ca2+ accumulation in the intracellular cytosol (Dirnagl et al. 1999). Each layer V pyramidal cell in the mammalian PFC receives ∼15,000 anatomically distinct glutamatergic contacts (Elston, 2003), whose activation brings massive loads of Ca2+ into the cell (Milojkovic et al. 2007). Although the exact number of simultaneously active release sites is difficult to determine, a large number of excitatory glutamatergic vesicles impinge on the dendritic membrane every second of an intense cortical process. Given the hourly duration of some cortical tasks, one must respect the normal physiological mechanisms employed to protect dendrites from Ca2+ overload (Sapolsky, 2001). We hypothesize that synaptic dopamine release on distal dendritic segments may play a role in this process. During intense cortical activity dopaminergic inputs to PFC may serve to prevent local Ca2+ overload and avert injury (Arundine & Tymianski, 2003). Interestingly, in people suffering from schizophrenia there is reduced amount of dopamine (Abi-Dargham & Moore, 2003) and less brain activity in the PFC (Meyer-Lindenberg et al. 2002) – hypodopaminergia and hypofrontality. We speculate that glutamate excitotoxicity, which has been implicated in the schizophrenic hypofrontality (Stone et al. 2007), may have been the consequence of chronic prefrontal hypodopaminergia.
Acknowledgments
This work was supported by National Institutes of Health grant (MH063503), and a NARSAD Young Investigator Award 2009. We are grateful to Corey D. Acker for Matlab programming, and Glenn Belinsky, Anna R. Moore and Matthew T. Rich for comments.
Glossary
- ACSF
artificial cerebrospinal fluid
- AP
action potential
- DA
dopamine
- IPC
intrapipette concentration, as defined in the text
- PFC
prefrontal cortex
- ROI
region of interest, as defined in the text
- VGCC
voltage-gated calcium channel
Author contributions
Design and execution of the experiments, analysis of the data, drafting the manuscript, comments on drafts and approval of the final manuscript: both authors. The experiments were conducted in S.D.A.'s laboratory at University of Connecticut Health Center, Farmington, CT, USA.
Supplementary material
Supplemental Figure S1
Supplemental Figure S2
Supplemental Figure S3
Supplemental Figure S4
Supplemental Figure S5
Supplemental Figure S6
References
- Abercrombie ED, Keefe KA, DiFrischia DS, Zigmond MJ. Differential effect of stress on in vivo dopamine release in striatum, nucleus accumbens, and medial frontal cortex. J Neurochem. 1989;52:1655–1658. doi: 10.1111/j.1471-4159.1989.tb09224.x. [DOI] [PubMed] [Google Scholar]
- Abi-Dargham A, Moore H. Prefrontal DA transmission at D1 receptors and the pathology of schizophrenia. Neuroscientist. 2003;9:404–416. doi: 10.1177/1073858403252674. [DOI] [PubMed] [Google Scholar]
- Acker CD, Antic SD. Quantitative assessment of the distributions of membrane conductances involved in action potential backpropagation along basal dendrites. J Neurophysiol. 2009;101:1524–1541. doi: 10.1152/jn.00651.2007. [DOI] [PMC free article] [PubMed] [Google Scholar]
- Akerman SN, Zorec R, Cheek TR, Moreton RB, Berridge MJ, Mason WT. Fura-2 imaging of thyrotropin-releasing hormone and dopamine effects on calcium homeostasis of bovine lactotrophs. Endocrinology. 1991;129:475–488. doi: 10.1210/endo-129-1-475. [DOI] [PubMed] [Google Scholar]
- Almog M, Korngreen A. Characterization of voltage-gated Ca2+ conductances in layer 5 neocortical pyramidal neurons from rats. PLoS One. 2009;4:e4841. doi: 10.1371/journal.pone.0004841. [DOI] [PMC free article] [PubMed] [Google Scholar]
- Antic SD. Action potentials in basal and oblique dendrites of rat neocortical pyramidal neurons. J Physiol. 2003;550:35–50. doi: 10.1113/jphysiol.2002.033746. [DOI] [PMC free article] [PubMed] [Google Scholar]
- Arundine M, Tymianski M. Molecular mechanisms of calcium-dependent neurodegeneration in excitotoxicity. Cell Calcium. 2003;34:325–337. doi: 10.1016/s0143-4160(03)00141-6. [DOI] [PubMed] [Google Scholar]
- Beaulieu C, Colonnier M. A laminar analysis of the number of round-asymmetrical and flat-symmetrical synapses on spines, dendritic trunks, and cell bodies in area 17 of the cat. J Comp Neurol. 1985;231:180–189. doi: 10.1002/cne.902310206. [DOI] [PubMed] [Google Scholar]
- Bender KJ, Ford CP, Trussell LO. Dopaminergic modulation of axon initial segment calcium channels regulates action potential initiation. Neuron. 2010;68:500–511. doi: 10.1016/j.neuron.2010.09.026. [DOI] [PMC free article] [PubMed] [Google Scholar]
- Bender KJ, Uebele VN, Renger JJ, Trussell LO. Control of firing patterns through modulation of axon initial segment T-type calcium channels. J Physiol. 2012;590:109–118. doi: 10.1113/jphysiol.2011.218768. [DOI] [PMC free article] [PubMed] [Google Scholar]
- Bergson C, Mrzljak L, Smiley JF, Pappy M, Levenson R, Goldman-Rakic PS. Regional, cellular, and subcellular variations in the distribution of D1 and D5 dopamine receptors in primate brain. J Neurosci. 1995;15:7821–7836. doi: 10.1523/JNEUROSCI.15-12-07821.1995. [DOI] [PMC free article] [PubMed] [Google Scholar]
- Canepari M, Djurisic M, Zecevic D. Dendritic signals from the rat hippocampal CA1 pyramidal neurons during coincident pre- and post-synaptic activity: a combined voltage- and calcium-imaging study. J Physiol. 2007;580:463–484. doi: 10.1113/jphysiol.2006.125005. [DOI] [PMC free article] [PubMed] [Google Scholar]
- Canepari M, Willadt S, Zecevic D, Vogt KE. Imaging inhibitory synaptic potentials using voltage sensitive dyes. Biophys J. 2010;98:2032–2040. doi: 10.1016/j.bpj.2010.01.024. [DOI] [PMC free article] [PubMed] [Google Scholar]
- Castelli L, Magistretti J. High-voltage-activated Ca2+ currents show similar patterns of expression in stellate and pyramidal cells from rat entorhinal cortex layer II. Brain Res. 2006;1090:76–88. doi: 10.1016/j.brainres.2006.03.037. [DOI] [PubMed] [Google Scholar]
- Couey JJ, Meredith RM, Spijker S, Poorthuis RB, Smit AB, Brussaard AB, Mansvelder HD. Distributed network actions by nicotine increase the threshold for spike-timing-dependent plasticity in prefrontal cortex. Neuron. 2007;54:73–87. doi: 10.1016/j.neuron.2007.03.006. [DOI] [PubMed] [Google Scholar]
- Craig PJ, Beattie RE, Folly EA, Banerjee MD, Reeves MB, Priestley JV, Carney SL, Sher E, Perez-Reyes E, Volsen SG. Distribution of the voltage-dependent calcium channel α1G subunit mRNA and protein throughout the mature rat brain. Eur J Neurosci. 1999;11:2949–2964. doi: 10.1046/j.1460-9568.1999.00711.x. [DOI] [PubMed] [Google Scholar]
- Day M, Wokosin D, Plotkin JL, Tian X, Surmeier DJ. Differential excitability and modulation of striatal medium spiny neuron dendrites. J Neurosci. 2008;28:11603–11614. doi: 10.1523/JNEUROSCI.1840-08.2008. [DOI] [PMC free article] [PubMed] [Google Scholar]
- Dirnagl U, Iadecola C, Moskowitz MA. Pathobiology of ischaemic stroke: an integrated view. Trends Neurosci. 1999;22:391–397. doi: 10.1016/s0166-2236(99)01401-0. [DOI] [PubMed] [Google Scholar]
- Dolphin AC. G protein modulation of voltage-gated calcium channels. Pharmacol Rev. 2003;55:607–627. doi: 10.1124/pr.55.4.3. [DOI] [PubMed] [Google Scholar]
- Elston GN. Cortex, cognition and the cell: New insights into the pyramidal neuron and prefrontal function. Cereb Cortex. 2003;13:1124–1138. doi: 10.1093/cercor/bhg093. [DOI] [PubMed] [Google Scholar]
- Few WP, Scheuer T, Catterall WA. Dopamine modulation of neuronal Na+ channels requires binding of A kinase-anchoring protein 15 and PKA by a modified leucine zipper motif. Proc Natl Acad Sci U S A. 2007;104:5187–5192. doi: 10.1073/pnas.0611619104. [DOI] [PMC free article] [PubMed] [Google Scholar]
- Garris PA, Ciolkowski EL, Pastore P, Wightman RM. Efflux of dopamine from the synaptic cleft in the nucleus accumbens of the rat brain. J Neurosci. 1994;14:6084–6093. doi: 10.1523/JNEUROSCI.14-10-06084.1994. [DOI] [PMC free article] [PubMed] [Google Scholar]
- Garris PA, Wightman RM. Different kinetics govern dopaminergic transmission in the amygdala, prefrontal cortex, and striatum: an in vivo voltammetric study. J Neurosci. 1994;14:442–450. doi: 10.1523/JNEUROSCI.14-01-00442.1994. [DOI] [PMC free article] [PubMed] [Google Scholar]
- Goldman-Rakic PS, Leranth C, Williams SM, Mons N, Geffard M. Dopamine synaptic complex with pyramidal neurons in primate cerebral cortex. Proc Natl Acad Sci U S A. 1989;86:9015–9019. doi: 10.1073/pnas.86.22.9015. [DOI] [PMC free article] [PubMed] [Google Scholar]
- Grace AA, Bunney BS. The control of firing pattern in nigral dopamine neurons: burst firing. J Neurosci. 1984;4:2877–2890. doi: 10.1523/JNEUROSCI.04-11-02877.1984. [DOI] [PMC free article] [PubMed] [Google Scholar]
- Grace AA, Floresco SB, Goto Y, Lodge DJ. Regulation of firing of dopaminergic neurons and control of goal-directed behaviors. Trends Neurosci. 2007;30:220–227. doi: 10.1016/j.tins.2007.03.003. [DOI] [PubMed] [Google Scholar]
- Gulledge AT, Stuart GJ. Action potential initiation and propagation in layer 5 pyramidal neurons of the rat prefrontal cortex: absence of dopamine modulation. J Neurosci. 2003;23:11363–11372. doi: 10.1523/JNEUROSCI.23-36-11363.2003. [DOI] [PMC free article] [PubMed] [Google Scholar]
- Higley MJ, Sabatini BL. Competitive regulation of synaptic Ca2+ influx by D2 dopamine and A2A adenosine receptors. Nat Neurosci. 2010;13:958–966. doi: 10.1038/nn.2592. [DOI] [PMC free article] [PubMed] [Google Scholar]
- Hoffman DA, Johnston D. Neuromodulation of dendritic action potentials. J Neurophysiol. 1999;81:408–411. doi: 10.1152/jn.1999.81.1.408. [DOI] [PubMed] [Google Scholar]
- Hoogland TM, Saggau P. Facilitation of L-type Ca2+ channels in dendritic spines by activation of β2 adrenergic receptors. J Neurosci. 2004;24:8416–8427. doi: 10.1523/JNEUROSCI.1677-04.2004. [DOI] [PMC free article] [PubMed] [Google Scholar]
- Jay TM. Dopamine: a potential substrate for synaptic plasticity and memory mechanisms. Prog Neurobiol. 2003;69:375–390. doi: 10.1016/s0301-0082(03)00085-6. [DOI] [PubMed] [Google Scholar]
- Kaila K. Ionic basis of GABAA receptor channel function in the nervous system. Prog Neurobiol. 1994;42:489–537. doi: 10.1016/0301-0082(94)90049-3. [DOI] [PubMed] [Google Scholar]
- Kampa BM, Letzkus JJ, Stuart GJ. Requirement of dendritic calcium spikes for induction of spike-timing-dependent synaptic plasticity. J Physiol. 2006;574:283–290. doi: 10.1113/jphysiol.2006.111062. [DOI] [PMC free article] [PubMed] [Google Scholar]
- Kampa BM, Stuart GJ. Calcium spikes in basal dendrites of layer 5 pyramidal neurons during action potential bursts. J Neurosci. 2006;26:7424–7432. doi: 10.1523/JNEUROSCI.3062-05.2006. [DOI] [PMC free article] [PubMed] [Google Scholar]
- Kisilevsky AE, Mulligan SJ, Altier C, Iftinca MC, Varela D, Tai C, Chen L, Hameed S, Hamid J, Macvicar BA, Zamponi GW. D1 receptors physically interact with N-type calcium channels to regulate channel distribution and dendritic calcium entry. Neuron. 2008;58:557–570. doi: 10.1016/j.neuron.2008.03.002. [DOI] [PubMed] [Google Scholar]
- Kole MH, Ilschner SU, Kampa BM, Williams SR, Ruben PC, Stuart GJ. Action potential generation requires a high sodium channel density in the axon initial segment. Nat Neurosci. 2008;11:178–186. doi: 10.1038/nn2040. [DOI] [PubMed] [Google Scholar]
- Larkum ME, Kaiser KM, Sakmann B. Calcium electrogenesis in distal apical dendrites of layer 5 pyramidal cells at a critical frequency of back-propagating action potentials. Proc Natl Acad Sci U S A. 1999;96:14600–14604. doi: 10.1073/pnas.96.25.14600. [DOI] [PMC free article] [PubMed] [Google Scholar]
- Ljungberg T, Apicella P, Schultz W. Responses of monkey dopamine neurons during learning of behavioral reactions. J Neurophysiol. 1992;67:145–163. doi: 10.1152/jn.1992.67.1.145. [DOI] [PubMed] [Google Scholar]
- Lledo PM, Legendre P, Israel JM, Vincent JD. Dopamine inhibits two characterized voltage-dependent calcium currents in identified rat lactotroph cells. Endocrinology. 1990;127:990–1001. doi: 10.1210/endo-127-3-990. [DOI] [PubMed] [Google Scholar]
- Lorenzon NM, Foehring RC. Characterization of pharmacologically identified voltage-gated calcium channel currents in acutely isolated rat neocortical neurons. I. Adult neurons. J Neurophysiol. 1995;73:1430–1442. doi: 10.1152/jn.1995.73.4.1430. [DOI] [PubMed] [Google Scholar]
- McKay BE, McRory JE, Molineux ML, Hamid J, Snutch TP, Zamponi GW, Turner RW. CaV3 T-type calcium channel isoforms differentially distribute to somatic and dendritic compartments in rat central neurons. Eur J Neurosci. 2006;24:2581–2594. doi: 10.1111/j.1460-9568.2006.05136.x. [DOI] [PubMed] [Google Scholar]
- Malgaroli A, Vallar L, Elahi FR, Pozzan T, Spada A, Meldolesi J. Dopamine inhibits cytosolic Ca2+ increases in rat lactotroph cells. Evidence of a dual mechanism of action. J Biol Chem. 1987;262:13920–13927. [PubMed] [Google Scholar]
- Markram H, Helm PJ, Sakmann B. Dendritic calcium transients evoked by single back-propagating action potentials in rat neocortical pyramidal neurons. J Physiol. 1995;485:1–20. doi: 10.1113/jphysiol.1995.sp020708. [DOI] [PMC free article] [PubMed] [Google Scholar]
- Matsuda Y, Marzo A, Otani S. The presence of background dopamine signal converts long-term synaptic depression to potentiation in rat prefrontal cortex. J Neurosci. 2006;26:4803–4810. doi: 10.1523/JNEUROSCI.5312-05.2006. [DOI] [PMC free article] [PubMed] [Google Scholar]
- Maurice N, Tkatch T, Meisler M, Sprunger LK, Surmeier DJ. D1/D5 dopamine receptor activation differentially modulates rapidly inactivating and persistent sodium currents in prefrontal cortex pyramidal neurons. J Neurosci. 2001;21:2268–2277. doi: 10.1523/JNEUROSCI.21-07-02268.2001. [DOI] [PMC free article] [PubMed] [Google Scholar]
- Meyer-Lindenberg A, Miletich RS, Kohn PD, Esposito G, Carson RE, Quarantelli M, Weinberger DR, Berman KF. Reduced prefrontal activity predicts exaggerated striatal dopaminergic function in schizophrenia. Nat Neurosci. 2002;5:267–271. doi: 10.1038/nn804. [DOI] [PubMed] [Google Scholar]
- Milojkovic BA, Zhou WL, Antic SD. Voltage and calcium transients in basal dendrites of the rat prefrontal cortex. J Physiol. 2007;585:447–468. doi: 10.1113/jphysiol.2007.142315. [DOI] [PMC free article] [PubMed] [Google Scholar]
- Moore AR, Zhou WL, Potapenko ES, Kim EJ, Antic SD. Brief dopaminergic stimulations produce transient physiological changes in prefrontal pyramidal neurons. Brain Res. 2011;1370:1–15. doi: 10.1016/j.brainres.2010.10.111. [DOI] [PMC free article] [PubMed] [Google Scholar]
- Neve KA, Seamans JK, Trantham-Davidson H. Dopamine receptor signalling. J Recept Signal Transduct Res. 2004;24:165–205. doi: 10.1081/rrs-200029981. [DOI] [PubMed] [Google Scholar]
- Palmer LM, Stuart GJ. Site of action potential initiation in layer 5 pyramidal neurons. J Neurosci. 2006;26:1854–1863. doi: 10.1523/JNEUROSCI.4812-05.2006. [DOI] [PMC free article] [PubMed] [Google Scholar]
- Peterson JD, Wolf ME, White FJ. Repeated amphetamine administration decreases D1 dopamine receptor-mediated inhibition of voltage-gated sodium currents in the prefrontal cortex. J Neurosci. 2006;26:3164–3168. doi: 10.1523/JNEUROSCI.2375-05.2006. [DOI] [PMC free article] [PubMed] [Google Scholar]
- Popovic MA, Foust AJ, McCormick DA, Zecevic D. The spatio-temporal characteristics of action potential initiation in layer 5 pyramidal neurons: a voltage imaging study. J Physiol. 2011;589:4167–4187. doi: 10.1113/jphysiol.2011.209015. [DOI] [PMC free article] [PubMed] [Google Scholar]
- Sabatini BL, Maravall M, Svoboda K. Ca2+ signalling in dendritic spines. Curr Opin Neurobiol. 2001;11:349–356. doi: 10.1016/s0959-4388(00)00218-x. [DOI] [PubMed] [Google Scholar]
- Sapolsky RM. Cellular defenses against excitotoxic insults. J Neurochem. 2001;76:1601–1611. doi: 10.1046/j.1471-4159.2001.00203.x. [DOI] [PubMed] [Google Scholar]
- Schultz W. Getting formal with dopamine and reward. Neuron. 2002;36:241–263. doi: 10.1016/s0896-6273(02)00967-4. [DOI] [PubMed] [Google Scholar]
- Seamans JK, Yang CR. The principal features and mechanisms of dopamine modulation in the prefrontal cortex. Prog Neurobiol. 2004;74:1–58. doi: 10.1016/j.pneurobio.2004.05.006. [DOI] [PubMed] [Google Scholar]
- Sesack SR, Bunney BS. Pharmacological characterization of the receptor mediating electrophysiological responses to dopamine in the rat medial prefrontal cortex: a microiontophoretic study. J Pharmacol Exp Ther. 1989;248:1323–1333. [PubMed] [Google Scholar]
- Sesack SR, Deutch AY, Roth RH, Bunney BS. Topographical organization of the efferent projections of the medial prefrontal cortex in the rat: an anterograde tract-tracing study with Phaseolus vulgaris leucoagglutinin. J Comp Neurol. 1989;290:213–242. doi: 10.1002/cne.902900205. [DOI] [PubMed] [Google Scholar]
- Somogyi P, Tamas G, Lujan R, Buhl EH. Salient features of synaptic organisation in the cerebral cortex. Brain Res Brain Res Rev. 1998;26:113–135. doi: 10.1016/s0165-0173(97)00061-1. [DOI] [PubMed] [Google Scholar]
- Stone JM, Morrison PD, Pilowsky LS. Glutamate and dopamine dysregulation in schizophrenia – a synthesis and selective review. J Psychopharmacol. 2007;21:440–452. doi: 10.1177/0269881106073126. [DOI] [PubMed] [Google Scholar]
- Surmeier DJ, Bargas J, Hemmings HC, Jr, Nairn AC, Greengard P. Modulation of calcium currents by a D1 dopaminergic protein kinase/phosphatase cascade in rat neostriatal neurons. Neuron. 1995;14:385–397. doi: 10.1016/0896-6273(95)90294-5. [DOI] [PubMed] [Google Scholar]
- Tsubokawa H, Ross WN. IPSPs modulate spike backpropagation and associated [Ca2+]i changes in the dendrites of hippocampal CA1 pyramidal neurons. J Neurophysiol. 1996;76:2896–2906. doi: 10.1152/jn.1996.76.5.2896. [DOI] [PubMed] [Google Scholar]
- Vogt KE, Gerharz S, Graham J, Canepari M. Combining membrane potential imaging with L-glutamate or GABA photorelease. PLoS One. 2011;6:e24911. doi: 10.1371/journal.pone.0024911. [DOI] [PMC free article] [PubMed] [Google Scholar]
- Westenbroek RE, Hell JW, Warner C, Dubel SJ, Snutch TP, Catterall WA. Biochemical properties and subcellular distribution of an N-type calcium channel α1 subunit. Neuron. 1992;9:1099–1115. doi: 10.1016/0896-6273(92)90069-p. [DOI] [PubMed] [Google Scholar]
- Yang CR, Seamans JK. Dopamine D1 receptor actions in layers V-VI rat prefrontal cortex neurons in vitro: modulation of dendritic-somatic signal integration. J Neurosci. 1996;16:1922–1935. doi: 10.1523/JNEUROSCI.16-05-01922.1996. [DOI] [PMC free article] [PubMed] [Google Scholar]
- Young CE, Yang CR. Dopamine D1/D5 receptor modulates state-dependent switching of soma-dendritic Ca2+ potentials via differential protein kinase A and C activation in rat prefrontal cortical neurons. J Neurosci. 2004;24:8–23. doi: 10.1523/JNEUROSCI.1650-03.2004. [DOI] [PMC free article] [PubMed] [Google Scholar]
- Zhou WL, Yan P, Wuskell JP, Loew LM, Antic SD. Intracellular long wavelength voltage-sensitive dyes for studying the dynamics of action potentials in axons and thin dendrites. J Neurosci Methods. 2007;164:225–239. doi: 10.1016/j.jneumeth.2007.05.002. [DOI] [PMC free article] [PubMed] [Google Scholar]
Associated Data
This section collects any data citations, data availability statements, or supplementary materials included in this article.