

Abstract
Axo-axonic synapses on the central terminals of primary afferent fibres modulate sensory input and are the anatomical correlate of presynaptic inhibition. Although several classes of primary afferents are under such inhibitory control, the origin of these presynaptic inputs in the dorsal horn is unknown. Here, we characterize the neurochemical, anatomical and electrophysiological properties of parvalbumin (PV)-expressing cells in wild-type and transgenic mice where enhanced green fluorescent protein (eGFP) is expressed under the PV promoter. We show that most PV cells have either islet or central cell-like morphology, receive inputs from myelinated primary afferent fibres and are concentrated in laminae II inner and III. We also show that inhibitory PV terminals in lamina II inner selectively target the central terminals of myelinated afferents (∼80% of 935 PVeGFP boutons) and form axo-axonic synapses (∼75% of 71 synapses from PV boutons). Targeted whole-cell patch-clamp recordings from PVeGFP positive cells in laminae II and III showed action potential discharge was restricted to the tonic firing and initial bursting patterns (67% and 33% respectively; n = 18), and virtually all express Ih subthreshold voltage-gated currents (94%; n = 18). These neurons show higher rheobase current than non-eGFP cells but respond with high frequency action potential discharge upon activation. Together, our findings show that PV neurons in laminae II and III are a likely source of inhibitory presynaptic input on to myelinated primary afferents. Consequently PV cells are ideally placed to play an important role in the development of central sensitization and tactile allodynia.
Key points
Perception of normal bodily sensations relies on the precise regulation of sensory information entering the dorsal horn of the spinal cord.
Inhibitory, axoaxonic, synapses provide a mechanism for this regulation, but the source of these important inhibitory connections remains to be elucidated.
This study shows that a subpopulation of spinal interneurons that expresses parvalbumin and have specific morphological, connectivity and functional characteristics are a likely source of the inhibitory inputs that selectivity regulate non-noxious tactile input in the spinal cord.
Our findings suggest that a loss of normal function in parvalbumin positive dorsal horn neurons may result in the development of tactile allodynia, where non-painful stimuli gain the capacity to evoke the sensation of pain.
Introduction
The spinal cord receives sensory information from cutaneous, muscle, joint and visceral afferents, which must be prioritized to generate contextually relevant responses (Watson, 1992). Presynaptic inhibition, first proposed by Frank and Fuortes (Frank & Fuortes, 1957), provides a mechanism for this prioritization, whereby transmission of sensory information from primary afferents is modulated at their central terminals in the spinal cord (Eccles et al. 1961). Axo-axonic synapses form the anatomical basis for presynaptic inhibition and such synapses were first described on the central terminals of muscle afferents in the ventral horn (Conradi, 1969a,b). We have previously shown that these presynaptic or ‘P-boutons’ are derived exclusively from a discrete population of deep dorsal horn neurons with a characteristic neurochemical profile (Hughes et al. 2005). Similarly, axoaxonic synapses have also been described in the dorsal horn (Knyihar-Csillik et al. 1982; Ribeiro-da-Silva & Coimbra, 1982) where they form inhibitory inputs on the central terminals of identified cutaneous afferent fibres (Maxwell & Noble, 1987; Todd et al. 1991; Watson & Bazzaz, 2001; Watson et al. 2002); however the identity of the neurons that provide these presynaptic inputs is not known.
Although most presynaptic terminals at these axo-axonic synapses in the dorsal horn contain both GABA and glycine (Todd, 1996; Watson et al. 2002; Watson 2004), presynaptic inhibition of primary afferents is thought to be mediated principally through the release of GABA (Eccles et al. 1963; Davidoff, 1972; Jimenez et al. 1987). Approximately 30% of the neurons in laminae I–III are thought to contain GABA (Todd & Spike, 1993), and these can be subdivided further into discrete subpopulations based on a number of characteristics (Todd, 2010). For example, neurochemical studies have shown that GABAergic neurons can co-express glycine (Todd & Sullivan, 1990; Polgar et al. 2003), nitric oxide synthase, choline acetyltransferase or parvalbumin (PV) (Todd & Spike, 1993; Laing et al. 1994; Saywell et al. 2011). Previous studies have proposed that inhibitory interneurons in the dorsal horn are highly selective in the synaptic interactions they form and suggest that discrete populations of interneurons are likely to be fundamental components of circuits underlying particular sensory modalities (Todd, 1996; Watson et al. 2002; Todd, 2010).
Until recently, a more detailed investigation of the functional role of discrete subsets of interneurons within a heterogeneous population such as dorsal horn neurons has relied on studies where recordings are made from a large number of neurons, which are then subsequently identified by neurochemistry. This post hoc approach is labour intensive and has so far had limited success in correlating neurochemical, morphological and physiological properties of dorsal horn neuron populations. In order to better understand the functional role of GABAergic interneurons in the dorsal horn, recent studies have employed transgenic mice to label discrete interneuron populations for targeted patch clamp recordings in spinal cord slices. This approach permits parallel study of the neurochemical, morphological and physiological properties of GABAergic interneuron populations in the dorsal horn (Lu & Perl, 2003; Hantman et al. 2004; Heinke et al. 2004; Maxwell et al. 2007; Yasaka et al. 2010; Mesnage et al. 2011). For example, targeted recordings from enhanced green fluorescent protein (eGFP)-labelled neurons in the dorsal horn of GAD67 eGFP mice has shown this subpopulation of GABAergic neurons exhibit a variety of action potential discharge patterns and receive diverse combinations of primary afferent input (Heinke et al. 2004).
The ultimate aim of the above approach is to improve our understanding of the function of various neuron types within dorsal horn circuits and their role in sensory processing (Graham et al. 2007a). Here we use targeted whole-cell recording from neurons in a transgenic mouse line that expresses eGFP under the control of the parvalbumin promoter (Meyer et al. 2002) to characterize their neurochemical, morphological and functional properties and ask whether PV-IR cells selectively target discrete populations of dorsal horn neurons or peripheral inputs.
Methods
Experiments conducted at the University of Glasgow were approved by the University's Ethical Review Process Applications Panel and were performed in accordance with the European Community directive 86/609/EC and the United Kingdom Animals (Scientific Procedures) Act 1986. Likewise, experiments undertaken at the University of Newcastle (UoN) were approved by the local Animal Care and Ethics Committee. Four mouse strains (both sexes; aged 5–6 weeks; body weight 17–27 g) were used for experiments: electrophysiological studies used a transgenic line that expressed eGFP under the control of the parvalbumin promoter (PVeGFP: Meyer et al. 2002) and BALB/c mice; anatomical studies used C57Bl/6J, ICR and PVeGFP mice. The PVeGFP line was generated by Prof. Hannah Monyer and bred with permission at the UoN on the BALB/c background. Shining a UV lamp on the ears of PVeGFP mice was used to identify eGFP-positive animals: fast twitch muscle fibres express parvalbumin (and by association eGFP).
Tissue preparation for immunofluorescence
Six adult C57Bl/6J, three ICR and five PVeGFP-expressing transgenic mice were perfused transcaridally with 4% depolymerized formaldehyde. The spinal cord was removed and post-fixed in the same solution for a further 2 h. Transverse and sagittal sections (60 μm thick) from the lumbosacral enlargement (L2–L5) were cut on a vibrating blade microtome then incubated in 50% ethanol for 30 min prior to incubation in a cocktail of primary antibodies for 72 h (see Table 1 for details). Primary antibody labelling was detected using species-specific secondary antibodies conjugated to Alexa 488, Rhodamine Red or Cy5 (see Table 2 for details). Sections were mounted on glass slides in Vectashield antifade mounting medium (Vector Laboratories, Peterborough, UK). All antibodies used in immunofluorescence protocols were diluted in phosphate buffered saline (PBS) containing 0.3% Triton X-100. All incubations were carried out at 4°C. Sections were subsequently scanned with a Bio-Rad Radiance 2100 confocal microscope (Hemel Hempstead, UK) equipped with a krypton–argon laser. Confocal image stacks were analysed off-line using Neurolucida for Confocal software (MicroBrightField, Colchester, VT, USA).
Table 1.
Primary antibodies
| Antigen | Host | Dilution | Antigen | Cat. No. | Source/Reference |
|---|---|---|---|---|---|
| CGRP | Sheep polyclonal | 1:5000 | Synthetic rat α-calcitonin gene-related peptide | BML-CA 1137 | Enzo Life Sciences (UK) Ltd (Amara et al. 1985) |
| CGRP | Guinea pig polyclonal | 1:10 000 | Synthetic peptide | T-5027 | Peninsula, San Carlos, USA |
| GFP | Rabbit polyclonal | 1:500 | Highly purified recombinant GFP made in Escherichia coli | Ab6556–25 | AbCam plc, Cambridge, UK (Russo et al. 2009). |
| GFP | Guinea pig polyclonal | 1:750 | Synthetic peptides (NC 011521) | GFP-GP-Af1180–1 | Frontier Institute Co. Ltd, Hokkaido, Japan |
| HCN1 | Rabbit polyclonal | 1:250 | Peptide corresponding to amino acid residues 6–24 of HCN1 | No. APC-056 | Alomone Laboratories, Jerusalem, Israel (Milligan et al. 2006) |
| HCN2 | Rabbit polyclonal | 1:500 | Peptide corresponding to amino acid residues 147–161 of human HCN2 | No. APC-030 | Alomone Laboratories, Jerusalem, Israel (Antal et al. 2004) |
| HCN4 | Mouse monoclonal | 1:500 | Fusion protein amino acids 1019–1108 (cytoplasmic C-terminus) of rat HCN4 | No. 75-150 Clone N114/10 | UC Davis/NIH NeuroMab Facility, Davis CA 95616-8519 (Giesbrecht et al. 2010; Khurana et al. 2012) |
| Parvalbumin | Goat polyclonal | 1:500 | Rat muscle parvalbumin | PVG-214 | SWANT, Bellinzona, Switzerland. (Celio, 1991). |
| Parvalbumin | Guinea pig polyclonal | 1:500 | Mouse PV (whole sequence, NM013645) | PV-GP-Af1000–1 | Frontier Institute Co. Ltd, Hokkaido, Japan Nakamura et al. 2004. |
| Parvalbumin | Mouse monoclonal | 1:1000 | Frog muscle parvalbumin | P3088 Clone PARV-19 | Sigma-Aldrich, Gillingham, UK. (Contini & Raviola, 2003) |
| PKCγ | Rabbit polyclonal | 1:1000 | Peptide mapping the C-terminus of mouse PKCγ | C-19 | Santa Cruz Biotechnology Inc., USA. |
| Substance P | Rat monoclonal | 1:200 | Substance P-bovine sera albumin conjugate | OBT0643S Clone NCI/34 HL | Oxford Biotechnology Ltd, UK (Cuello et al. 1980) |
| VGLUT1 | Guinea pig polyclonal | 1:5000 | Synthetic peptide from rat VGLUT1 protein | AB5905 | Millipore, Chemicon International, Harrow, UK |
| VGAT | Mouse monoclonal | 1:1000 | Amino acids 75-87 of rat VGAT coupled to KLH | 131 002 | SynapticSystems, Göttingen, Germany (Chaudry et al. 1998). |
Table 2.
Secondary antibodies
| Antigen | Species | Dilution | Flurophore/conjugate | Source | Cat. no. |
|---|---|---|---|---|---|
| Rabbit | Donkey | 1:500 | Alexa 488 | Molecular Probes | A-21206 |
| Goat | Donkey | 1:500 | Alexa 488 | Molecular Probes | A-11055 |
| Guinea pig | Goat | 1:500 | Alexa 488 | Molecular Probes | A-11073 |
| Mouse | Donkey | 1:100 | Rhodamine | Jackson Immunoresearch | 715-295-151 |
| Goat | Donkey | 1:100 | Rhodamine | Jackson Immunoresearch | 705-295-147 |
| Guinea pig | Donkey | 1:100 | Rhodamine | Jackson Immunoresearch | 706-295-148 |
| Rabbit | Donkey | 1:100 | Cy5 | Jackson Immunoresearch | 711-175-152 |
| Mouse | Donkey | 1:100 | Cy5 | Jackson Immunoresearch | 715-175-151 |
| Guinea pig | Donkey | 1:100 | Cy5 | Jackson Immunoresearch | 706-175-148 |
| Mouse | Donkey | 1:200 | Biotin | Jackson Immunoresearch | 715-065-151 |
| Rabbit | Donkey | 1:200 | Biotin | Jackson Immunoresearch | 711-065-152 |
Molecular Probes Inc.: Eugene, OR, USA. Jackson Immunoresearch Laboratories: West Grove, PA, USA
Neuroanatomical features of PV cells
To map the distribution and determine the morphological features of parvalbumin-expressing cells in laminae I–III, transverse and sagittal sections from three C57Bl/6J and two PVeGFP mice were incubated in cocktails of primary antibodies containing rabbit anti-protein kinase Cγ (PKCγ) with either guinea pig anti-parvalbumin or guinea pig anti-GFP. These sections were scanned on a confocal microscope with a 20x lens and a scan field of 602 × 602 μm. This field size covered the entire dorsal horn in transverse section. Non-overlapping fields were scanned from the sagittal sections to ensure neuron profiles were not counted twice. Image stacks were analysed using Neurolucida by first drawing an outline of the grey matter (the entire dorsal horn in transverse section, or the border between the grey matter and lamina I in sagittal sections) for each section. The boundaries of laminae I–III were plotted, using images from the Allen mouse spinal cord atlas (Allen Institute for Brain Science web site) as a reference. Lamina IIi was defined by the plexus of PKCγ-immunoreactive (-IR) cells (Neumann et al. 2008). The position of all PV-IR cells was then marked on these plots. Higher power scans (60× lens, field size 201 × 201 μm, 1 μm z-separation) were also made of PV- and PVeGFP-expressing cells in dorsal horn laminae IIi and III of C57Bl6J and transgenic mice, respectively. The somato-dendritic arbours of cells in overlapping fields were traced using Neurolucida and images of individual neurons were generated in Photoshop CS4 (Adobe Systems, San Jose, CA, USA) from projected images (Yasaka et al. 2010). For each neuron, the Neurolucida traces were first superimposed over montages of projected image stacks covering the entire cell. All profiles that did not originate from the cell were then erased, ensuring that only dendrites from the reconstructed neuron were included.
To determine the relationships of parvalbumin positive axon terminals in lamina II with neurochemically defined primary afferent terminals, sections from three ICR mice were incubated in cocktails of goat anti-parvalbumin and mouse anti-vesicular GABA transporter (VGAT) with either guinea pig anti-vesicular glutamate transporter type I (VGLUT1), guinea pig anti-calcitonin gene-related peptide (CGRP) or the biotinylated form of isolectin B4 (IB4; 1 μg ml−1. Sigma-Aldrich, Gillingham, UK). VGAT, also known as vesicular inhibitory amino acid transporter, is responsible for transporting both GABA and glycine into synaptic vesicles and is a reliable marker for terminals containing inhibitory neurotransmitters (Chaudhry et al. 1998), whereas VGLUT1, CGRP and IB4 are reliable markers for the central terminals of myelinated afferent fibres, peptidergic C-fibres and non-peptidergic C-fibres respectively (Fabri and Conti, 1990; Wang et al. 1994; Todd et al. 2003). Representative image stacks of lamina II, consisting of 90 optical sections separated by 0.3 μm steps, were scanned with a 60× oil-immersion lens using a scan field of 100 × 100 μm. These image stacks were then analysed off-line using Neurolucida for Confocal software. For each combination, individual afferent terminals were selected randomly from the image stacks and labelled. For each neurochemically defined afferent population, we determined (i) the average number of VGAT positive contacts per central terminal; (ii) the proportion of afferent terminals that received contacts from terminals co-expressing both VGAT and PV; and (iii) the average number of PV-expressing VGAT-IR terminals in contact with the afferent terminals.
To establish the validity of PVeGFP expression as a marker of PV expression in laminae I–III of the transgenic mouse strain, sections from the lumbar spinal cord of four PVeGFP mice were incubated in a cocktail of goat anti-parvalbumin and rabbit anti-GFP. Confocal image stacks were scanned using a 40× lens with a scan field of 301 × 301 μm, with optical sections separated by 1 μm. These were then analysed using Neurolucida to determine (i) the proportions of PVeGFP-expressing cells that were PV-IR positive and (ii) the proportion of PV-IR cells that expressed PVeGFP.
In the transgenic mouse tissue, eGFP was expressed in both the intervaricose portions of axons as well as in the terminals, therefore making it possible to distinguish interconnected strings of en passant and terminal boutons on a single axon. To determine the proportion of inhibitory PVeGFP terminals that contacted the central terminals of myelinated afferents, we cut 60 μm thick sagittal sections from the lumbar spinal cord of two PVeGFP mice and incubated these in rabbit anti-GFP, mouse anti-VGAT and guinea pig anti-VGLUT1. Confocal stacks of interconnected PVeGFP-expressing terminals in lamina IIi were scanned with a 60× oil-immersion lens and a scan field of 100 × 100 μm with 0.3 μm z-separation. The proportion of VGAT-expressing PVeGFP terminals in contact with VGLUT1 terminals was then determined using Neurolucida for confocal software.
HCN expression in PV cells
We used an immunocytochemical approach to map the distribution of the hyperpolarization-activated cyclic nucleotide gated channel subunits HCN1, 2 and 4 in the spinal dorsal horn and determine the proportion of PV-expressing cells that expressed each subunit. These voltage-gated cation channels produce hyperpolarization-activated membrane currents and have been implicated in ‘fast-spiking’ action potential firing patterns (Aponte et al. 2006; Wahl-Schott & Biel, 2009). Previous studies using in situ hybridization techniques have reported the expression of these subunits in the cord, although HCN3 is thought to be either very weak or absent (Santoro et al. 2000). To map the overall expression of these HCN subunits, sections from three C57Bl6J mice were incubated in a cocktail of antibodies as follows: (i) rabbit anti-HCN1, rat anti-substance P and goat anti-CGRP; (ii) rabbit anti-HCN2, rat anti-substance P and goat anti-CGRP; (iii) rabbit anti-HCN1, goat anti-parvalbumin and guinea pig anti-PKCγ; (iv) rabbit anti-HCN2, goat anti-parvalbumin and guinea pig anti-PKCγ; (v) mouse anti-HCN4, goat anti-parvalbumin and rabbit anti-PKCγ. HCN channel labelling was visualized using a tyramide signal amplification (TSA) step (Nagy et al. 2004). Briefly, following incubation in the primary antibody cocktail for 72 h, sections were incubated overnight in species-specific fluorescently labelled secondary antibodies and biotinylated donkey anti-mouse or anti-rabbit IgG. Sections were then incubated for 3 h in avidin conjugated to horseradish peroxidase, prior to carrying out a TSA reaction using a tetramethylrhodamine kit (PerkinElmer Life Sciences, Boston, MA, USA) in accordance with the manufacturer's instructions. Confocal microscopy was then used to confirm patterns of immunolabelling for each combination of antibodies.
Based on the immunolabelling patterns observed above, sections from three ICR mice and three PVeGFP mice were then incubated in a cocktail of goat anti-parvalbumin and mouse anti-HCN4 or rabbit anti-GFP, goat anti-parvalbumin and mouse anti-HCN4, respectively. Confocal image stacks of laminae I–III, scanned with a 40× oil-immersion lens and a scan field of 301 × 301 μm with 1 μm z-separation, were then analysed using Neurolucida. PV-IR cells from the ICR mice and PVeGFP cells that also expressed PV-IR in the transgenic mice were identified in the image stacks before establishing whether they expressed immunolabelling for HCN4.
Tissue preparation for electron microscopy
Three adult C57Bl/6J mice were perfused transcaridally with 2.5% glutaraldehyde and 1% depolymerized formaldehyde. The lumbar spinal cord was removed and post-fixed overnight in the same solution. Transverse sections (60 μm thick) from the L2 and L3 spinal segments were cut on a vibrating blade microtome, treated in 50% ethanol to enhance antibody penetration and then rinsed in 1% sodium borohydride to reduce free aldehyde groups. Sections were incubated in 0.3% hydrogen peroxide solution to block endogenous peroxidase activity prior to incubation in mouse anti-parvalbumin for 72 h, followed by 24 h each in biotinylated donkey anti-mouse IgG and extravidin-peroxidase (diluted 1:1,000. Sigma-Aldrich; cat. no. E2886). Peroxidase activity was revealed with 3,3′,5,5′-diaminobenzidine (DAB) in the presence of H2O2. Sections were then osmicated (1% OsO4 for 20 min), dehydrated in acetone, block-stained with uranyl acetate and flat-embedded in Durcupan resin (Epoxy resin kit; Sigma-Aldrich; cat. no. D0166). For each animal, serial ultrathin sections were cut from tissue blocks containing laminae I–IV and mounted on to Formvar-coated single slot grids. All grids were viewed with a Philips CM100 transmission electron microscope. The nature of profiles that were postsynaptic to parvalbumin-immunoreactive boutons in lamina IIi was determined to identify and quantify the relative frequency of the different postsynaptic targets of PV-expressing axons. Synaptic contacts were identified by the presence of clusters of synaptic vesicles at presynaptic active zones, a synaptic cleft and a postsynaptic density. Occasionally, the intensity of DAB reaction product in the presynaptic terminal obscured these features, making it difficult to clearly resolve synaptic specializations. To confirm the presence of synaptic contacts in such instances, these boutons were relocated on adjacent serial sections and the synaptic appositions verified. All antibodies used in protocols for pre-embedding immunocytochemistry for electron microscopy were diluted in phosphate buffered saline (PBS) that contained no detergent. All incubations were carried out at 4°C, whereas the peroxidase reaction with DAB was carried out at room temperature (21°C).
Slice preparation for electrophysiology experiments
Spinal cord slices were prepared using previously described techniques (Graham et al. 2003). Briefly, animals (PVeGFP and BALB/C mice) were anaesthetized with ketamine (100 mg kg−1 i.p.) and decapitated. Using a ventral approach, the lumbosacral enlargement of the spinal cord was rapidly removed and placed in ice-cold sucrose substituted artificial cerebrospinal fluid (s-ACSF) containing (in mm): 250 sucrose, 25 NaHCO2, 10 glucose, 2.5 KCl, 1 NaH2PO4, 1 MgCl2 and 2.5 CaCl2. Transverse slices (from L3–L5 segments; 300 μm thick) were cut using a vibrating blade microtome (Leica VT-1000S, Heidelberg, Germany) and then transferred to an interface incubation chamber containing oxygenated artificial cerebrospinal fluid (ACSF) (118 mm NaCl substituted for sucrose). Slices were allowed to equilibrate for 1 h at room temperature (22–24°C) prior to recording.
Electrophysiology
Slices were transferred to a recording chamber and continually superfused (bath volume 0.4 ml; exchange rate 4–6 bath volumes min−1) with ACSF bubbled with Carbonox (95% O2 and 5% CO2) to achieve a final pH of 7.3–7.4. All recordings were made at elevated bath temperature (32–34°C) from visualized neurons, using near-infrared differential interference contrast optics (Graham et al. 2008). In recordings from PVeGFP transgenic slices cells were easily identified under fluorescence using a FITC filter set (488 nm excitation, 508 nm emission filters). Recordings were limited to neurons located within or closely apposing the substantia gelatinosa. This area is easily identified by its translucent appearance in transverse spinal cord slices. Patch pipettes (2–4 MΩ) were filled with a potassium methyl sulphate-based internal solution containing (in mm): 135 KCH3SO4, 6 NaCl, 2 MgCl2, 10 Hepes, 0.1 EGTA, 2 MgATP, 0.3 NaGTP, pH 7.3 (with KOH). The whole-cell recording configuration was established in voltage-clamp (holding potential −70 mV).
Action potential (AP) discharge was studied in current-clamp recording mode. The membrane potential recorded ∼15 s after switching from voltage to current clamp was designated as resting membrane potential (RMP) and subsequent recordings were made from this potential. All reported membrane potential values have been corrected for a 10 mV junction potential (Barry & Lynch, 1991). The excitability and AP discharge was studied by injecting a series of depolarizing step-currents (800 ms duration, 20 pA increments, delivered every 8 s) into the recorded neuron. During this protocol voltage deflections were limited to avoid cell damage. This was achieved by terminating the protocol if sustained depolarizations exceeded –20 mV (i.e. in parts of the voltage trace not containing APs). AP discharge was classified according to previously published criteria (Graham et al. 2004, 2007b). Tonic firing was characterized by persistent AP discharge throughout the depolarizing step; initial bursting was characterized by AP discharge limited to the beginning of the depolarizing step; delayed firing featured a prominent delay between the onset of the depolarizing step and AP discharge; single spiking was characterized by the discharge of one or two APs at depolarizing step onset; and reluctant firing neurons did not discharge APs.
Excitatory postsynaptic currents and subthreshold voltage-activated currents were studied in voltage-clamp. Spontaneous excitatory postsynaptic currents were recorded at a holding potential of −70 mV. The identity of the receptors underlying these currents was confirmed by their sensitivity to bath-applied 6-cyano-7-nitroquinoxaline-2,3-dione (CNQX, 10 μm). Subthreshold voltage-activated currents were studied using a voltage-clamp protocol applied from a holding potential of −60 mV. This protocol delivered a hyperpolarizing step to −90 mV (1 s duration) followed by a depolarizing step to −40 mV (200 ms duration). Automated P/N leak subtraction (within the Axograph software) was used to remove both capacitive and leakage currents. In the P/N subtraction procedure a scaled down version of the full amplitude voltage clamp protocol (1/10) was applied four times and recorded responses were averaged, rescaled to full size and subtracted from responses to the original protocol. This protocol was also designed to maintain membrane potential below the activation threshold of tetrodotoxin (TTX)-sensitive sodium channels. We have previously shown that this approach can effectively identify the presence (or absence) of four major voltage-activated currents found in dorsal horn neurons (Graham et al. 2007c). Two types of transient outward current are activated by the depolarization (i.e. stepping from −90 mV to −40 mV) with properties consistent with A-type potassium currents (IA) (Yoshimura & Jessell, 1989; Ruscheweyh et al. 2004). A-currents can be readily differentiated by their kinetics and activation and inactivation and are termed rapid (IAr) and slow A-current (IAs), respectively. Two types of inward current can also be identified, a depolarization activated (i.e. stepping from −90 mV to −40 mV) transient inward current consistent with the low threshold ‘T-type’ calcium current (ICa), and a slow-hyperpolarization activated current (i.e. stepping from −60 mV to −90 mV) with features of the non-selective cation current (Ih) (Yoshimura & Jessell, 1989; Grudt & Perl, 2002; Ruscheweyh & Sandkuhler, 2002). TTX was not used in these experiments because it precludes study of AP discharge properties in the same neuron or the sampling of large numbers of neurons from one animal.
Because of the very high incidence of Ih in PVeGFP cells, additional voltage clamp protocols were utilized to further characterize this current in a subset of experiments. These voltage-clamp protocols were applied from a holding potential −50 mV. The kinetic properties of Ih activation were studied by delivering a hyperpolarizing step to −110 mV (2 s duration) and then returning to the holding potential. The voltage sensitivity of Ih activation was studied by delivering a series of 2 s pre-steps (−110 to −50 mV, 10 mV increments) followed by a test step to −110 mV (500 ms duration). Both inactivation and activation protocols underwent P/N subtraction as described above. Importantly, scaled P/N waveforms remained outside Ih activation, avoiding inadvertent reduction of the apparent Ih current responses. This was further confirmed by checking the linearity of all scaled responses, which never contained evidence of active conductances. Bath application of caesium (5 mm) was used to confirm that Ih was the current activated by these protocols.
All data were acquired using an Axopatch 200B amplifier (Molecular Devices, Sunnyvale, CA, USA) and digitized online (sampled at 10–20 kHz, filtered at 5–10 kHz, respectively) via an ITC-16 computer interface (Instrutech, Long Island, NY, USA) and stored on a Macintosh G4 computer using Axograph v4.6 software (Molecular Devices).
Data analysis
Criteria for inclusion of a neuron for analysis was an RMP more negative than −50 mV and a series resistance <20 MΩ (filtered at 5 kHz). All data were analysed offline using Axograph software. In the analysis of AP discharge, individual APs elicited by step-current injection were captured using a derivative threshold method (dV/dt > 15 V s−1) with the inflection point during spike initiation being defined as AP threshold. The difference between AP threshold and its maximum positive peak was defined as AP amplitude. AP base-width was measured at AP threshold. AP after hyperpolarization (AHP) amplitude was taken as the difference between AP threshold and the maximum negative peak following the AP. Rheobase current was defined as the smallest step-current that would elicit at least one AP. Two parameters were used to further classify each neuron's AP discharge pattern during step-currents: discharge latency was taken as the time from the onset of step-current injection to the first evoked AP; and discharge duration was defined as the time between the onset of the first and last AP during step-current injection.
Analysis of spontaneous excitatory postsynaptic currents (sEPSCs) was completed using a sliding template method (semi-automated procedure within Axograph software package) to detect and capture sEPSCs (Clements & Bekkers, 1997). All captured sEPSCs were inspected individually and excluded from further analysis if they contained overlapping sEPSCs or had an unstable baseline before the rise or during the decay phase of the sEPSCs. Data were also rejected if a significant trend in either sEPSC amplitude or inter-event interval was observed during the analysis period. The peak amplitude and rise time of sEPSCs were measured for all accepted events (via semi-automated procedures in Axograph) and instantaneous frequency was calculated as the reciprocal of inter-event interval. Analysis of sEPSC decay time constant (calculated over 20–80% of the decay phase) was performed on averaged sEPSCs, generated by aligning the rising phase of all accepted events in a recording.
The analysis of Ih currents included measurement of peak amplitude, defined as the maximum negative current during the hyperpolarizing step (i.e. over the last 50 ms of the step to −110 mV). The activation phase of the Ih response was fitted with a double exponential (over 20–80% of the rising phase). Activation curves describing Ih voltage dependence were constructed from tail currents, calculated by subtracting the pre-step holding current from the peak of the tail current (I/Imax). The activation curves were fitted by the Boltzmann function to estimate peak current (Imax), half-activation voltage (V1/2), and the slope factor (k) using the following equation:
All drugs were obtained from Sigma-Aldrich (Sydney, Australia).
Statistics
Statistical analysis was carried out using SPSS v10 (SPSS Inc., Chicago, IL, USA). Student's t test was used to compare variables between genotypes. Data that failed Levene's test for homogeneity of variance were compared using the non-parametric Kruskal–Wallace test. G tests, with Williams's correction, were used to determine if the proportions of discharge patterns, and voltage-activated currents differed between genotypes (Sokal & Rohlf, 1995). Statistical significance was set at P < 0.05. All values are presented as means ± SEM.
Results
Laminar distribution and morphology of PV-IR and PVeGFP cells
A total of 1082 PV-IR cells in laminae I–III of C57Bl/6J (n = 3) were analysed to determine the laminar distribution of immunoreactive cells in the outer laminae of the mouse spinal dorsal horn (Fig. 1A–D and E–G). The majority of PV-IR cells were found in lamina III (mean 82.9%; SD 4.91) and lamina IIi (14.3%; 3.61), with very few cells in either lamina I (0.6%; 0.8) or lamina IIo (2.2%; 1.00). A virtually identical pattern of labelling was also observed in the ICR mouse strain, although this was not systematically quantified. Similarly, PV-IR axon terminals in each strain studied formed a dense plexus in lamina IIi with virtually all boutons expressing immunolabelling for VGAT. While these inhibitory PV-IR terminals were also seen in the dorsal part of lamina III, they were sparse in both lamina IIo and lamina I.
Figure 1. Distribution of PV-IR and PVeGFP neurons in the mouse dorsal horn.
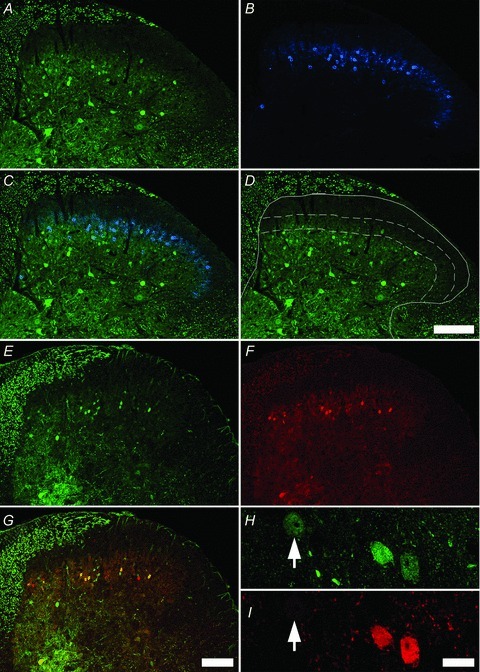
A, immunolabelling for parvalbumin (green) is found in axons of primary afferent fibres in the dorsal columns as well as cell bodies, dendrites and axons of cells in the dorsal horn. B, Immunolabelling for PKC-γ (blue) shows that immunoreactive cells are located principally in lamina IIi. The boundaries of this plexus can be used to help define lamina IIo, IIi and III (C, and D) and show that most PV-IR cells are found in lamina III (scale bar A–D = 100 μm). Dashed lines on panel D show dorsal and ventral boundaries of lamina IIi. Confirmation of PV expression in PVeGFP cells of the mouse spinal dorsal horn neurons. E, immunolabelling for PVeGFP (green) is found in axons of putative primary afferent fibres in the dorsal columns as well as cell bodies, dendrites and axons of cells in the dorsal horn and is virtually identical to the immunolabelling patterns for parvalbumin (F and G; red) with many double-labelled cells appearing yellow (G). Closer examination of immunolabelling for PVeGFP (H; green) and PV (I; red) shows differences in the relative intensities of labelling of either marker. Note, despite considerable overlap (C), not all PVeGFP positive somata were PV-IR positive (arrows). Scale bars: E–G = 100 μm; H and I = 10 μm.
The distribution of PVeGFP cells in laminae I–III of two transgenic mice was also assessed (1149 cells analysed) along with the location of the PVeGFP plexus closely matching the findings in both wild-type mouse lines. Most PVeGFP cells were found in lamina III (81.3% and 79.4% of PVeGFP cells from each animal respectively) and lamina IIi (12.7% and 12.4%), with very few cells in either lamina I (2.1% and 2.7%) or lamina IIo (3.9% and 5.5%). Although the general distribution of both PVeGFP cells and PV-IR cells in laminae I–III were very similar, we further analysed 531 PVeGFP expressing cells to determine the proportion that were immunopositive for PV and also 655 PV-IR cells to estimate the proportion that expressed PVeGFP in lumbar sections from four PVeGFP mice. The majority of PVeGFP-expressing cells were immunopositive for PV (mean 75.8%; SD 7.9), while most PV-IR cells also expressed PVeGFP (74.3%; ±2.8). While most cells showed strong immunolabelling for both markers, the intensity of labelling for either PV-IR or PVeGFP-IR differed in some cells, with one marker appearing stronger than the other (Fig. 1H and I).
Morphological analysis of PV-IR and PVeGFP expressing cells indicate this population constitutes a morphologically diverse group of neurons that consists mainly of islet- and central-like cells (Fig. 2). No attempt was made to determine the frequency of each morphologically distinct cell type as it was not possible to confidently visualize the entire dendritic arbor of immunolabelled cells in slices. In both populations, the majority of cells have dendritic arbours that are elongated in the rostro-caudal axis of the spinal cord; however, these arbors are not necessarily confined to any single lamina. Cells in lamina IIi often have dendrites that project into lamina III, while the dendrites of cells in both laminae IIo and III often enter lamina IIi. Contacts from VGLUT1-expressing terminals were observed on the somata and dendrites of PV-IR cells in lamina IIi and III (Fig. 3) suggesting PV-IR cells receive monosynaptic input from myelinated primary afferent fibres.
Figure 2. Morphology of PV-IR and PVeGFP neurons.
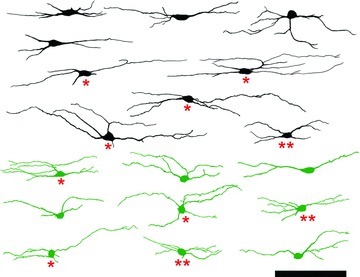
Reconstructions of the somatodendritic arbors of PV-IR cells (black) and PVeGFP-IR neurons (green) in sagittal sections of lumbar spinal cord. The dendrites of these neurons were often elongated in the rostro-caudal axis of the cord. While many neurons exhibit islet- (red asterisks) or central cell-like morphology (red double asterisks), other morphologies are also observed. Scale bar = 100 μm.
Figure 3. Central terminals of myelinated primary afferent fibres contact PV-IR cells in laminae IIi and III.
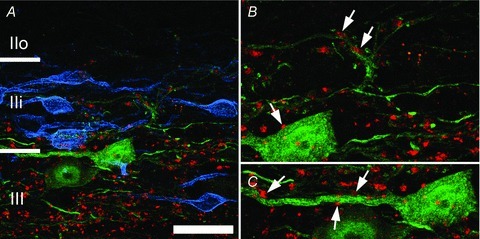
A, parvalbumin-IR cells (green) and VGLUT1-IR terminals (red) from myelinated afferent fibres are most common in lamina III but often extend into lamina IIi as defined by the plexus of PKCγ-IR cells (blue). B and C, expanded views from A showing putative axodendritic and axosomatic (arrows) inputs from VGLUT1-IR terminals on to PV-IR neurons in lamina IIi. Scale bar A = 5 μm.
Postsynaptic targets of PV-IR cells
A total of 600 VGLUT1-IR terminals, 737 CGRP-IR terminals and 635 IB4 terminals in lamina II were analysed from ICR mice to determine the relationships between inhibitory PV boutons and the central terminals of neurochemically defined primary afferent fibres. This analysis showed that the principal targets of inhibitory PV-IR terminals were VGLUT1-expressing boutons (Fig. 4A and B), as approximately half of these terminals in lamina IIi received contacts from VGAT-expressing PV-IR axon terminals (mean = 50.1%; SD 4.1). Neither CGRP- nor IB4-labelled terminals in lamina II received significant input from inhibitory PV-IR boutons, with less than 1% of the boutons from either population respectively receiving such contacts. The mean number of VGAT profiles that were directly apposed to VGLUT1 terminals was 3.6 ± 1.4; however, the mean number of PV-expressing VGAT profiles contacting VGLUT1 terminals was 0.93 ± 1.1. In the transgenic mice, PVeGFP labelling in axons often allows interconnected boutons from the same axon to be distinguished (Fig. 4C–E). A total of 935 VGAT-expressing PVeGFP boutons in lamina IIi were analysed to determine the proportion of boutons that contacted VGLUT1 terminals. The majority of these PVeGFP boutons contacted VGLUT1 terminals (381/480 and 371/455 in 2 animals); however, occasional contacts with the dendrites (4/480 and 8/455) and cell bodies of PVeGFP cells (4/480 and 6/455) were also noted.
Figure 4. Inhibitory PV-IR and PVeGFP-IR boutons make putative axo-axonic contacts on VGLUT1-IR terminals.
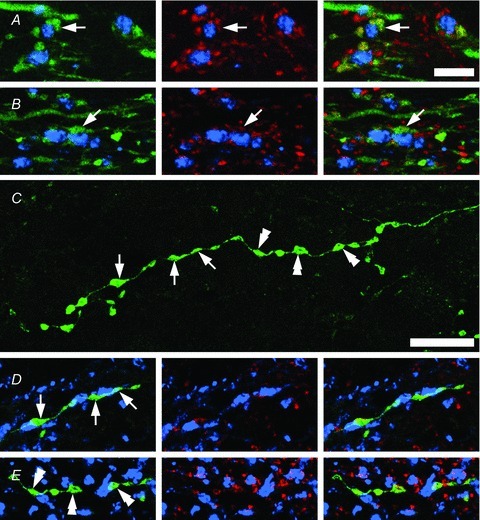
A and B, the majority of PV-IR axon terminals (green) that express the inhibitory marker VGAT (red) are found to appose VGLUT1-IR terminals (blue) in lamina IIi. Although VGLUT1 terminals are the principal target of PV-IR boutons (arrowheads), these central boutons also receive inputs from other as yet undefined populations of inhibitory interneurons (red only). C, A PVeGFP positive axon featuring en passant and terminal boutons in lamina IIi. D and E, examples of inhibitory PVeGFP boutons (green) shown in C (arrowheads and double arrowheads) in close apposition with VGLUT1-IR terminals (blue). All of the PVeGFP boutons shown in C also express VGAT (red). Scale bar C–E = 10 μm.
Finally, a total of 71 synaptic appositions from 67 PV-IR terminals in lamina IIi were identified using transmission electron microscopy to verify the synaptic targets of PV-IR axons. Only two forms of synaptic appositions were observed, with the majority of these forming axo-axonic synapses (mean percentage per animal 73.2%; SD ±8.6%) and the remainder forming axo-dendritic synapses (26.8 ± 8.6%). Most of the axo-axonic synapses formed by PV-IR terminals were onto the central elements of type II glomeruli (Fig. 5); however, synaptic triads at these glomeruli were also occasionally observed (4 of 67 boutons). Furthermore, PV-IR presynaptic inputs onto axon terminals forming simpler, non-glomerular complexes in lamina IIi were also common. The deposition of peroxidase reaction product in the cytoplasm of presynaptic terminals and the density of synaptic vesicles clustered at the presynaptic active zone can make it difficult to confidently describe synaptic appositions from PV-IR terminals as either Gray's type I or II. However, the intensity of reaction product in these tissues was generally not a problem as we took steps during tissue processing to ensure that DAB deposition was light. This ensured that the reaction product did not obscure the subcellular organelles or the fine detail of the subcellular structure. As a result, we were able to confirm that all synapses from PV-IR terminals were symmetrical (Gray's type II) and all postsynaptic axon terminals at axo-axonic synapses contained rounded synaptic vesicles and made asymmetrical synapses (Gray's type I) on to adjacent dendrites (Fig. 5A-G). Most axo-dendritic synapses from PV-IR terminals were on to unlabelled dendrites, but while synaptic inputs on to PV-IR dendrites were also observed (Fig. 5H), the frequency of such contacts was not assessed systematically. Vesicle-containing PV-IR dendrites were occasionally observed (Fig. 5A and C); however, these were always postsynaptic to the central terminals of type II glomeruli.
Figure 5. Ultrastructural confirmation of postsynaptic targets of PV-IR terminals.
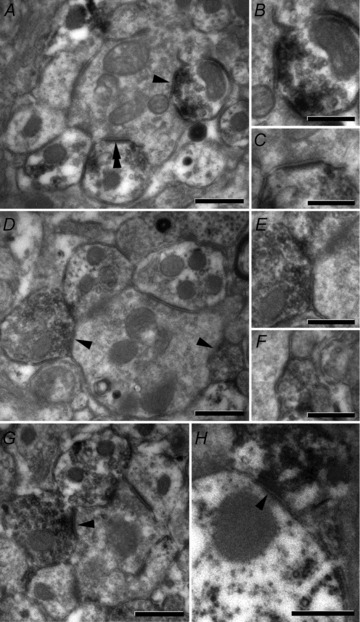
The majority of PV-IR axon terminals in lamina IIi made synaptic contact (black arrowheads) on to the central terminals of type II glomeruli (A, B and D–G), although inputs onto simpler, non-glomerular axon terminals were also observed. All synapses from these central terminals were onto dendrites, with occasional examples of inputs onto vesicle-containing PV-IR dendrites (double arrowheads A and C). PV-immunoreactive profiles were identified by the presence of DAB precipitate in the cytoplasm of immunolabelled cells. On occasion, grids were tilted to confirm the presence of synapses (E and F). We also found examples of PV-IR axon terminals synapsing onto PV-IR dendrites (H); however, no attempt was made to formally assess the frequency of such inputs. All arrowheads point to the postsynaptic densities. Scale bars: A, D, G and H = 0.5 μm; B, C, E and F = 0.25 μm.
Intrinsic excitability of PVeGFP cells
Patch-clamp recordings were obtained from approximately equal numbers of neurons in laminae II–III from BALB/c and PVeGFP mice (62 and 64 neurons, respectively). Recordings from BALB/c slices were obtained using a random sampling technique to ensure we accounted for the well-documented heterogeneity that exists in the electrophysiological properties of dorsal horn neurons (Graham et al. 2007a). This was necessary because in our previous work we have always used mice bred on the C57Bl/6J background (Graham et al. 2004, 2008). No clear differences were detected in these properties between the two strains. Recordings from slices obtained from PVeGFP mice were limited to neurons located in laminae II and III that expressed eGFP.
Comparison of the passive membrane properties of randomly sampled and PVeGFP positive neurons showed input resistance (407 ± 26 vs. 474 ± 28 MΩ) and resting membrane potential (−68.8 ± 1.5 vs.−72.2 ± 1.6 mV) were similar in the random sample and PVeGFP positive neurons. To compare the active properties of PVeGFP positive and randomly sampled neurons we next examined AP discharge evoked via somatic injection of depolarizing current steps. Comparison of the properties of individual APs recorded at rheobase indicates that AP thresholds were similar for randomly sampled and PVeGFP positive neurons (−39.00 ± 0.85 mV vs.−36.60 ± 1.00 mV, n = 40 and n = 18 respectively). In contrast, individual APs recorded from randomly sampled neurons exhibit larger peak amplitudes (44.4 ± 1.6 mV vs. 35.6 ± 1.6 mV, n = 40 and n = 18 respectively), longer base-widths (1.44 ± 0.08 ms vs. 0.90 ± 0.04 ms, n = 40 and n = 18 respectively), and smaller peak AHP amplitudes (−28.69 ± 1.91 mV vs.−38.8 ± 1.24 mV, n = 40 and n = 18 respectively) compared to PVeGFP positive neurons. Classification of AP discharge responses over multiple current injections identified five distinguishable discharge patterns in BALB/c mice (Fig. 6), consistent with our previous studies (using C57Bl/6J mice). Initial bursting neurons accounted for ∼45% of the sample, reluctant firing was observed in ∼25% of the recordings, and the remaining discharge patterns comprised 5–15% of the sample (n = 53). In contrast, only tonic firing and initial bursting AP discharge was observed in PVeGFP positive neurons (67% and 33%, respectively, n = 18). Thus, AP discharge in PVeGFP neurons was biased towards the more excitable (tonic firing and initial bursting) responses.
Figure 6. Action potential discharge in PVeGFP positive neurons is restricted to tonic firing and initial bursting.

A, AP discharge patterns (black traces) observed in randomly sampled SDH neurons from PVeGFP positive mice during somatic injection of depolarizing currents steps of increasing magnitude. Five types of AP discharge are observed: tonic firing (TF), initial bursting (IB), delayed firing (DF), single spiking (SS), and reluctant firing (RF). B, AP discharge observed in PVeGFP positive neurons during injection of depolarizing currents steps of increasing magnitude. Only the TF and IB discharge patterns are observed. C, incidence of discharge patterns in randomly sampled versus PVeGFP positive SDH neurons. All five discharge patterns, previously described in mouse SDH neurons, were observed in the random sample with IB responses predominating. In contrast, only TF and IB responses were observed in recordings from PVeGFP positive neurons.
To further examine excitability in PV-eGFP neurons, we compared the injected current/discharge frequency relationship in tonic firing and initial bursting neurons in the randomly sampled and PVeGFP positive recordings (Fig. 7). This comparison showed rheobase current was higher in both tonic firing and initial bursting PVeGFP neurons. Injected current–discharge frequency relationships were compared at the first depolarizing step current injection to elicit AP discharge (i.e. rheobase) and the next five current steps (i.e. 20, 40, 60, 80 and 100 pA above rheobase). This comparison showed that AP discharge frequency was elevated in PVeGFP cells compared to randomly sampled recordings. The increased rheobase current and AP discharge frequency observed in PVeGFP neurons suggest these cells are difficult to recruit (i.e. high rheobase), but once activated respond with high frequency AP discharge.
Figure 7. Rheobase and current–discharge frequency relationships differ in PVeGFP positive and randomly sampled neurons.

A, comparison of AP discharge in tonic firing PVeGFP positive neurons and tonic firing neurons from the random sample showed PVeGFP neurons had higher rheobase currents (left), and discharged at higher frequencies for all current steps above rheobase (right). B, similar comparisons as shown in panel A for initial bursting neurons. PVeGFP positive neurons had higher rheobase currents and AP discharge frequency, above rheobase, during current step injections.
We next examined the incidence of the major subthreshold voltage-activated currents, which shape AP discharge in dorsal horn neurons. Four subthreshold currents were identified in the random sample (Fig. 8), with most neurons (85%) expressing a single subthreshold current. Approximately 50% of the neurons expressed IAr and the remaining currents occurred at a relatively lower frequency (10–20% of the sample). In 15% of the recordings multiple currents were identified with Ih and ICa the most commonly observed combination (5/8). This prevalence of the various subthreshold currents in our random sample of BALB/c neurons is shown in (Fig. 8B) and closely matched that reported in previous studies from our group (Graham et al. 2008). The prevalence and distribution of subthreshold currents in PVeGFP neurons, however, differed markedly from the random sample. In particular, Ih currents were present in virtually all neurons sampled (94%, n = 18). Some of these Ih expressing neurons (8/18) also exhibited other subthreshold currents, in most cases ICa (7/8 neurons) or in one cell IAr.
Figure 8. Subthreshold currents in PVeGFP positive and randomly sampled neurons.
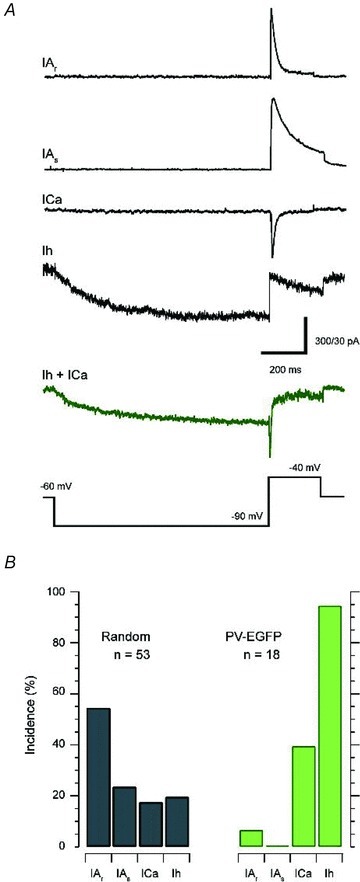
A, example traces for the four major subthreshold currents routinely observed in SDH neurons: the rapid A-current (IAr), slow A-current (IAs), T-type calcium current (ICa), and the hyperpolarization activated cation current (Ih). Voltage-clamp step protocol is shown in bottom trace. B, incidence of subthreshold currents in randomly sampled and PVeGFP positive neurons. All current species were observed in the random sample with IAr dominating (>50% of neurons sampled). In contrast, Ih dominated in PVeGFP positive neurons. The remaining neurons expressed various combinations of Ih, ICa or no current (NC).
Because of the high prevalence of Ih in PVeGFP neurons we further characterized this current in a subset of recordings (Fig. 9A and B). Bath application of CsCl (5 mm, n = 6) completely abolished the inward current activated by a voltage step from −50 mV to −110 mV and confirmed that the current was Ih. The mean amplitude of the Ih current, measured over the last 50 ms of the response, was 53.50 ± 6.14 pA. Ih activation kinetics were determined by fitting a double exponential function over 20–80% of the current onset during the voltage step. This analysis yielded fast and slow activation time constants (0.12 ± 0.01 s and 0.91 ± 0.10 s, respectively). Finally, the voltage dependence of Ih activation was determined using a two-step protocol, which included various amplitude ‘pre-steps’ ranging from −50 mV to −110 mV (for 2 s, in 10 mV increments) and a ‘test’ step to −110 mV (500 ms). The tail currents at the start of the ‘test’ step were then used to determine the magnitude of Ih at each potential. All values were then normalized to the maximum response (following the pre-step to −50 mV). Activation curves were fitted with a Boltzmann equation (see Methods) to determine the peak current (Imax) of 53.56 ± 6.04 pA, half-activation voltage (V1/2) of −84.31 ± 1.21 mV, and a slope factor (k) of −7.45 ± 0.61.
Figure 9. Properties of Ih and distribution of HCN4 in PVeGFP positive neurons.
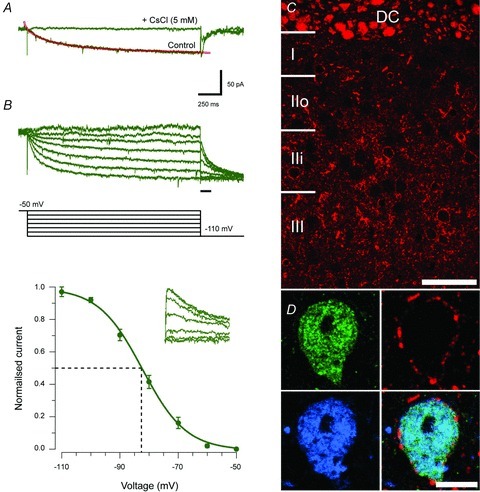
A, Ih was activated by a hyperpolarizing voltage step (−50 mV to −110 mV for 2 s). This current was completely abolished by the addition of 5 mm CsCl to the bath (n = 6). The amplitude of the steady state current during this step (i.e. over the last 50 ms) was defined as Ih amplitude and two time constants (fitted over 20–80% of current amplitude) were fitted (red line) to the current's rising phase to quantify its activation kinetics. B, family of Ih currents (green traces, top) in response to a two-step voltage protocol (black traces, middle) showing the voltage dependence of Ih activation. The protocol consisted of a series of 2 s presteps (−110 to −50 mV, in 10 mV increments) followed by a test step to −110 mV (500 ms duration). Current–voltage plot shows normalized group data for Ih activation calculated using the tail currents: shown in inset on an expanded time base (denoted by black bar in protocol above). C, distribution of immunolabelling for HCN4 in sagittal sections of the lumbar dorsal horn. Strong immunolabelling is found in presumed axons in the dorsal columns (DC) as well as the cell membranes of a subset of dorsal horn neurons. D, we found that the majority (>90%) of dorsal horn neurons showing immunoreactivity for both PVeGFP (green) and PV (blue) were also immunolabelled for HCN4 channels (red). Overlayed images (bottom right) shows merged image. Scale bars: C = 50μm; D = 10 μm.
Corresponding quantitative anatomical studies assessed the frequency of HCN4 subunit expression in PV cells in PVeGFP and ICR mice (Fig. 9C and D). Immunolabelling for HCN4 was found in the cell membranes of 52% of the PVeGFP positive neurons (range 43 to 60%, n = 186 neurons). This figure was substantially increased to 94% in cells that co-expressed both PVeGFP- and PV-IR (range 92–100%, total number of PV-IR and PVeGFP cells analysed = 91). Consistent with these findings, 78% of PV-IR cells from ICR mice showed HCN4 immunolabelling (range 75% to 81%, total number of PV-IR cells analysed = 249). The high co-expression of HCN4-immunolabelling in PV-IR cells correlates well with the high incidence of the Ih current and the tonic firing AP discharge pattern (12/18, 67%) observed in PVeGFP neurons (Fig. 6C). This is consistent with the known role of HCN channels in shaping these properties (Santoro et al. 2000) and suggests that HCN4 expression may in future serve as a useful marker for identifying dorsal horn neurons that exhibit tonic firing.
In a parallel set of anatomical studies, we looked at the general pattern of expression of HCN channel subunits in the mouse dorsal horn to determine which were likely to be expressed in PV cells (Fig. 10). We found that both HCN1 and HCN2 immunolabelling was expressed in the central terminals of peptidergic C-fibres and also in the cell membranes of discrete populations of neurons in laminae IIi to V (Fig. 10A–F, respectively). Typically, immunolabelling for all HCN channels subunits in dorsal horn neurons was principally in the cell membrane, although some cytoplasmic labelling was also apparent. HCN1 labelling was found in 64.8% of PV-expressing cells in laminae II and III (percentage of PV cells expressing HCN1 = 58.3, 63.3 and 74% per animal; total number of PV cells analysed = 236); however, the expression of HCN2 in these cells was negligible (total number of PV cells co-expressing labelling for HCN2 = 1; total number of PV cells analysed = 286). HCN4 immunolabelling was found in axons in the white matter and in the membranes of numerous cells in laminae II to IV. The majority of PV-expressing cells in laminae II and III (77.9%) also expressed HCN4 immunolabelling (mean percentage of PV cells expressing HCN1 = 74.6, 77.3 and 81.1% per animal; total number of PV cells analysed = 249).
Figure 10. HCN channel subunit expression in the mouse spinal dorsal horn.

Immunolabelling for HCN1, HCN2 and HCN4 (red; A, D and G, respectively) was largely confined to lamina I and laminae IIi–V, with HCN4 labelling also found in presumed axons in the dorsal columns. HCN1 and HCN2 immunolabelling in lamina I (B and E, respectively) was confined to the central terminals of substance P (blue) and CGRP (green) terminals. Most PV-IR cells in laminae I–III (green; C, F and H) expressed immunolabelling for HCN1 (C) and HCN4 (H) but not HCN2 (F). Scale bars: A, D and G = 100 μm; B, C, E, F and H = 5 μm.
Excitatory synaptic transmission
After establishing some important intrinsic properties of PVeGFP neurons, we next examined the properties of spontaneous excitatory postsynaptic currents (sEPSCs) to provide insight into the nature of the excitatory synaptic drive that is important for initiating and maintaining AP discharge in vivo. The properties of sEPSCs were compared in randomly sampled and PVeGFP positive neurons. sEPSCs were completely abolished by bath addition of CNQX (10 μm; n = 7 random sample, n = 5 PVeGFP) confirming that these inwards currents were mediated by AMPA/kainate glutamate receptors (Fig. 11A). The frequency of sEPSCs, which includes currents resulting from both AP-dependent and spontaneous neurotransmitter release at presynaptic terminals, varied markedly in randomly sampled neurons (Fig. 11B). Comparison of group data for randomly sampled (n = 54) and PV-eGFP positive recordings (n = 24) shows sEPSC frequency is tightly clustered in PV-eGFP neurons around a mean value that is approximately four times lower than the mean frequency of sEPSCs in randomly sampled laminae II–III neurons (3.9 ± 1.1 vs. 16.2 ± 1.4 Hz, see Fig. 11C).
Figure 11. PVeGFP positive neurons receive weak excitatory drive.

A, spontaneous excitatory postsynaptic currents (sEPSCs) recorded in a dorsal horn neuron (top trace, holding potential −70 mV). Bath application of the AMPA/kainate receptor antagonist CNQX (10 μm) completely abolished all activity (bottom trace), confirming that the recorded sEPSCs were glutamatergic. B, example recordings from randomly sampled neurons (black traces, and a PVeGFP neuron (green trace, E). Note, the considerable variability in sEPSC frequency and amplitude across the five recordings. C, comparison of mean sEPSC frequency in randomly sampled and PVeGFP positive neurons. Note, sEPSC frequency is very low in PVeGFP positive neurons. D, overlayed sEPSCs recorded from a randomly sampled (left) and a PVeGFP positive (middle) neuron. For both neurons the averaged sEPSC is indicated by the overlayed light traces. Right trace compares average sEPSCs from PVeGFP and randomly sampled neurons when scaled to the same amplitude. E and F, Overlayed histograms (left) for sEPSC amplitude (E), rise time (F), and decay time constant (G) from a representative randomly sampled (grey, n = 294 sEPSCs) and PVeGFP positive neuron (green, n = 127 sEPSCs). Plots (right) show group data for averaged sEPSC amplitude, rise time and decay time constant. sEPSCs from PVeGFP positive neurons have smaller amplitudes and slower decay times than those recorded in the random sample.
In addition to the low frequency of excitatory inputs received by PVeGFP neurons, the amplitude and time course of recorded sEPSCs also exhibited specific characteristics (Fig. 11D–G). Mean sEPSC amplitude in randomly sampled neurons was significantly greater than in PVeGFP neurons (25.7 ± 1.2 pA vs. 17.4 ± 0.8 pA; n = 54 and n = 24, respectively). sEPSC decay time constant was also faster in randomly sampled versus PVeGFP neurons (1.97 ± 0.08 ms vs. 2.48 ± 0.11 ms, n = 54 and n = 24 respectively). sEPSC rise times, however, were identical in the two samples (0.59 ± 0.02 ms vs. 0.59 ± 0.02 ms, n = 54 and n = 24, respectively). The combined effect of larger, fast decaying sEPSCs resulted in a greater charge transfer per sEPSC in the random sample compared to the smaller slower decaying sEPSCs in the PVeGFP neurons (77.1 ± 4.0 pA ms vs. 61.1 ± 2.7 pA ms, n = 54 and n = 24, respectively). Finally, the product of sEPSC frequency and charge transfer, which provides a measure of excitatory drive, indicates that on average, powerful excitatory input regulates activity in randomly sampled neurons whereas this is weak in PVeGFP neurons (1364 ± 145 pA ms Hz vs. 252 ± 81 pA ms Hz, n = 54 and n = 24, respectively).
Discussion
In this study we have used immunocytochemistry in multiple mouse strains, and electrophysiology in an eGFP-expressing transgenic mouse to examine the role of parvalbumin expressing inhibitory interneurons in spinal dorsal horn function. The somata of PV-expressing cells are concentrated in lamina IIi–III and feature elongated dentritic arbours oriented in the rostrocaudal axis. Most PV-expressing cells exhibit islet or central cell morphology. Inhibitory PV axon terminals arborize extensively in lamina IIi where they preferentially contact VGLUT1-expressing terminals. Electrophysiological analysis of PV-expressing cells in spinal cord slices suggest they have a unique electrophysiological signature. They exhibit high frequency action potential discharge in response to current injection, express the Ih current, and receive weak excitatory synaptic drive compared to other dorsal horn neurons. Below we discuss our data and the available evidence, which suggest PV-expressing cells are ideally placed to modulate processing of tactile information in the dorsal horn and to play an important role in the development of tactile allodynia.
PV cell distribution and morphology
Our experiments provide the first detailed description of the distribution of PV cells in the outer laminae (I–III) of the mouse dorsal horn. The general distribution of PV immunolabelling in both wild-type and PVeGFP transgenic mice is largely similar to that reported for rat (Yamamoto et al. 1989; Antal et al. 1990; Laing et al. 1994) and cat (Anelli & Heckman, 2005). In all three species the axons of PV positive cells are in Lissauer's tract and the dorsal columns, and their somata are found in laminae I–III. In both rat and mouse, PV-IR cells are most common in laminae II and III (Antal et al. 1990); however, their distribution in these laminae differs. In rat, 37% and 62% of PV-IR cells occur in lamina II and lamina III, respectively (Antal et al. 1990). In mouse, we found PV-IR cells are more concentrated in lamina III (83% wild-type; 80% PVeGFP vs. 62% in rat) and that PV-IR and PVeGFP positive cells are also found in lamina IIi.
PV-IR cells in rat form a relatively homogeneous population, with most expressing GABA and glycine (Antal et al. 1991; Laing et al. 1994). Morphologically they resemble islet cells (Yamamoto et al. 1989; Antal et al. 1990; Antal et al. 1991), and feature extensive dendritic arbours disposed primarily in the rostro-caudal axis of the spinal cord (Light & Perl, 1979; Bicknell & Beal, 1984; Grudt & Perl, 2002; Maxwell et al. 2007; Yasaka et al. 2007, 2010). Although three subtypes of PV-expressing cells have been reported in the rat according to subtle differences in morphology, laminar location and initial axon trajectories (Yamamoto et al. 1989), it is unclear whether they represent functionally distinct sets of PV cells. We also found that the morphology of PV-IR and PVeGFP cells in both wild-type and transgenic mice often resembled islet cells; however, other morphologies (e.g. central cells) were clearly present (Fig. 2). Cells with islet-like morphology have been reported in studies using targeted patch-clamp experiments and intracellular labelling on spinal cord slices from a transgenic mouse where eGFP expression is driven by the GAD67 promoter (Heinke et al. 2004). This work reported 62% of GAD67eGFP expressing cells in lamina II showed islet cell morphology, that the majority had initial bursting firing patterns and that 23% expressed immunolabelling for parvalbumin. It is therefore evident that neurons classified as islet cells in the mouse form a morphologically, physiologically and neurochemically diverse group, of which parvalbumin-expressing cells form only a subpopulation.
Islet cells are defined as inhibitory interneurons in lamina II with dendritic arbours in excess of 400 μm and elongated in the rostro-caudal axis and an axonal arborization that is generally limited to the volume of the cell's dendritic branches (Grudt & Perl, 2002; Maxwell et al. 2007; Yasaka et al. 2007; Yasaka et al. 2010). The morphology of central cells is very similar to islet cells, but their dendritic arbor is less extensive (less than 400 μm) and generally restricted to lamina IIi (Grudt & Perl, 2002; Yasaka et al. 2007, 2010). Immunocytochemical studies in the rat reported that a population of small islet cells were not immunoreactive for GABA (Todd & McKenzie, 1989) and these resemble the central cells of Grudt & Perl (2002). More recent studies combining morphological features of recorded cells with neurochemical expression of markers for GABAergic and glutamatergic cells support these observations and provide further evidence that central cells can be divided into inhibitory or excitatory subpopulations (Hantman et al. 2004; Maxwell et al. 2007; Yasaka et al. 2010; Zheng et al. 2010). While we also describe PV-expressing cells in the mouse with morphological properties similar to central cells, our current dataset does not allow us to definitively assign individual cells into any morphological class. Future experiments employing intracellular labelling of PVeGFP neurons will further address this issue. Given the subtle differences in proportions of PV cells in the different laminae of the mouse spinal cord, it remains to be seen whether this disparity between the species (mouse vs. rat) reflects the relative prevalence of one morphological subclass over another. Furthermore, it also remains to be seen whether PV-expressing cells in lamina III differ significantly in morphology to islet cells and central cells of lamina II.
Synaptic targets of inhibitory PV axons
Our results demonstrate that PV-IR and PVeGFP-expressing axon terminals form a dense plexus centred largely on lamina IIi in the mouse spinal cord. While these terminals also extend into lamina III, they are sparse in lamina IIo and virtually absent in lamina I. Although the majority of PV-IR axon terminals also expressed VGAT, some large PV-IR terminals that expressed VGLUT1 were occasionally observed. As the axonal arborization of both islet and central cells is generally confined to the volume of their dendritic tree (Grudt & Perl, 2002; Maxwell et al. 2007; Yasaka et al. 2007, 2010), it is highly likely that the VGAT-positive PV-IR terminals seen in lamina IIi are derived from PV-expressing cells located in laminae II and III.
A major finding of this study is that the majority of inhibitory PV-expressing terminals in lamina IIi are closely associated with VGLUT1-expressing axon terminals, but do not appose the central terminals of either peptidergic or non-peptidergic C-fibre afferents. Most VGLUT1 labelling in the rat and mouse spinal cord is derived from the central terminals of myelinated afferent fibres, but corticospinal axons are also known to express this marker (Todd et al. 2003; Brumovsky et al. 2007). Although examples of synaptic inputs from putative presynaptic dendrites onto axon terminals from the corticospinal tract in lamina IIi of the macaque spinal cord have been reported (Ralston et al. 1984), the majority of these terminals are not thought to be under direct presynaptic control or receive axo-axonic inputs (Nielsen & Petersen, 1994). It is therefore highly likely that the inhibitory PV terminals in lamina IIi described in this study target the central terminals of myelinated afferents selectively.
We have previously used transganglionic labelling of sciatic afferents with cholera toxin β subunit to show that myelinated afferent fibres terminate in lamina IIi and express VGLUT1 (Todd et al. 2003); however, VGLUT1 expression alone cannot be used to differentiate between the central terminals of Aδ and Aβ fibres. Both classes of myelinated fibres are known to terminate in lamina IIi (Light & Perl, 1979; Rethelyi et al. 1982; Hughes et al. 2003) and the central terminals of each form morphologically distinct synaptic complexes. Terminals from non-nociceptive Aδ down hairs form the central elements of type II glomeruli and are found predominantly in lamina IIi (Rethelyi et al. 1982; Ribeiro-da-Silva & Coimbra, 1982), whereas most boutons from larger myelinated afferents such as hair follicle afferents form simpler synaptic arrangements (Watson et al. 2002). Both classes of afferent fibres have been shown to receive inhibitory axo-axonic inputs (Maxwell & Noble, 1987; Todd et al. 1991; Todd, 1996; Watson et al. 2002) and our findings now suggest that PV-expressing cells are an important source of these presynaptic inputs. Although ultrastructural studies of PV-expressing cells have previously revealed the fine details of PV-immunoreactive cell bodies and dendrites, they have not described the synaptic relationships of their axon terminals (Antal et al. 1990; Yoshida et al. 1990). In this study, we show that the majority of PV-expressing axon terminals in lamina IIi form axo-axonic synapses on the central profiles in type II glomeruli and a population of axon terminals that are similar to those of hair follicle afferents (Watson et al. 2002), but do not form presynaptic inputs at type I glomeruli. Thus, these findings suggest that PV-expressing cells in laminae II and III of the mouse spinal cord play an important role in modulating sensory information from myelinated afferents specifically, but are not the exclusive source of such inputs as they account for only ∼25% of the presynaptic inputs on each terminal. These findings are in keeping with previous studies which propose that inhibitory interneurons in the dorsal horn are highly selective in the synaptic interactions they form (Todd, 1996; Watson et al. 2002) and support the idea that discrete populations of interneurons are involved in modulating activity in the spinal circuits associated with particular sensory modalities.
We also show that the somata and dendrites of PV-expressing cells in laminae IIi and III receive contacts from VGLUT1-expressing terminals. This suggests they receive direct synaptic input from the central terminals of myelinated afferent fibres. Although electrophysiological evidence shows Aβ-mediated monosynaptic responses in lamina II cells are limited (Daniele & MacDermott, 2009), we have shown previously that the central terminals of identified hair follicle afferents that conduct in the Aβ range contact PKCγ-immunoreactive cells in lamina IIi of the rat (Hughes et al. 2003). In addition, others have reported activation of these cells in response to innocuous (non-noxious) mechanical stimulation (Neumann et al. 2008). The dendrites of Golgi-stained islet cells have been shown to be postsynaptic to the central elements of type II glomeruli (Todd, 1988) and in this study we have demonstrated synaptic inputs from the central axons of type II glomeruli on PV-immunolabelled dendrites (Fig. 5A and C). Therefore, not only do the dendrites of putative PV-expressing islet cells appear to receive direct inputs from myelinated afferents, they also have the capacity to modulate the activity of these presynaptic terminals. A notable feature of islet cell dendrites is that they often contain synaptic vesicles and form synaptic contacts on to dendrites and axon terminals (Spike & Todd, 1992). We found evidence of vesicle-containing dendrites that were PV-IR and postsynaptic to the central terminals of type II glomeruli (Fig. 5A and C), and this supports our observations that PV cells receive monosynaptic inputs from myelinated afferents.
Functional properties of PVeGFP neurons
In addition to our description of neurons with the appropriate anatomical characteristics to regulate modality-specific sensory processing (above), the use of a transgenic mouse in this study has allowed us to add functional information on the activity and response properties of PV neurons. We have previously reported that using a random sampling approach for recording spinal dorsal horn neurons typically yields up to five types of AP discharge (Graham et al. 2004). In contrast, the targeted experiments in this study show that PVeGFP neurons only exhibited the tonic firing or initial bursting patterns. Furthermore, PVeGFP neurons displayed APs with a fast time course, large AHP amplitudes and extremely high discharge rates suggesting that they provide powerful inhibitory control of their postsynaptic targets: the central terminals of myelinated primary afferents. This combination of properties is strikingly similar to that of fast spiking neurons in a number of CNS regions. For example, PV-positive GABAergic interneurons in the hippocampus, neostriatum and cerebellum discharge APs at high frequency (Kawaguchi et al. 1987; Kawaguchi & Kubota, 1993; Pawelzik et al. 2002) and include populations of cells that exclusively target the axons of pyramidal cells (DeFelipe et al. 1989). Interestingly, although the role of parvalbumin is yet to be fully elucidated, one proposed function from studies in PV-knockout mice is to limit short-term facilitation of synaptic transmission (Schwaller et al. 2002). In the context of fast spiking GABAergic interneurons this ensures faithful synaptic transmission to downstream targets during high-frequency firing without inducing synaptic plasticity (Caillard et al. 2000). A similar mechanism in the dorsal horn would provide powerful and stable inhibitory control over primary afferent inputs.
An analysis of the subthreshold currents underlying AP discharge revealed that virtually all PVeGFP neurons expressed the hyperpolarization-activated cation current (Ih). This is markedly different from the relatively low (∼15%) incidence of Ih in randomly sampled recordings. An association between tonic firing (the discharge pattern we observed most often in PVeGFP neurons) and Ih currents is well established in the rodent dorsal horn (Yoshimura & Jessell, 1989; Grudt & Perl, 2002; Melnick, 2008; Yasaka et al. 2010). One of these studies also identified Ih in a population of dorsal horn neurons with initial bursting discharge (Grudt & Perl, 2002). These observations are consistent with the important role Ih plays in repetitive AP discharge, driving neurons towards AP threshold following periods of hyperpolarization (Santoro & Tibbs, 1999; Robinson & Siegelbaum, 2003). The combination of tonic firing or initial bursting AP discharge with Ih currents is also consistent with our morphological analysis of PVeGFP neurons. Specifically, previous work has shown that islet cells express substantial Ih and exhibit high frequency tonic firing discharge (Grudt & Perl, 2002; Melnick, 2008; Yasaka et al. 2010). In contrast, central cells appear to form a more diverse population, but a subpopulation termed ‘transient central non-IA’ has been described with properties comparable to our initial bursting PVeGFP neurons (Grudt & Perl, 2002). Thus, notwithstanding that these morphological categories have traditionally been applied to lamina II neurons, versus the lamina III location of many PVeGFP neurons, this combined morphological and electrophysiological characterization strongly suggests the PVeGFP mouse identifies two relatively homogeneous and functionally discrete populations of dorsal horn neurons.
The coexistence of Ih currents and HCN subunits in PV-IR and PVeGFP neurons also warrants comment. There are four known HCN subunits (HCN1–4) that potentially mediate Ih currents, but only HCN1 and HCN2 expression has been previously reported using immunohistochemistry in the spinal dorsal horn. In the rat, immunolabelling for HCN1 subunits is largely absent in laminae I and II but more prominent in deeper laminae and close to the central canal (Milligan et al. 2006), whereas HCN2 immunoreactivity is present in the somata (within dorsal root ganglia) of peptidergic C-fibres and their central terminals in lamina I and II (Antal et al. 2004). Using the same antibodies in the mouse, we find that immunolabelling for both HCN1 and HCN2 is found in the central terminals of peptide-containing C-fibres and also in discrete populations of dorsal horn neurons in laminae II–V (Fig. 10). While these patterns are slightly different from those reported in the rat (Antal et al. 2004; Milligan et al. 2006), this could be explained in part by the increased sensitivity of the tyramide signal amplification (TSA) step employed in our experiments. To further support our labelling in the mouse, the distribution of both HCN1 and HCN2 immunolabelled cells in the spinal dorsal horn is virtually identical to patterns described using in situ hybridization techniques (Santoro et al. 2000). While this study suggested that HCN2 mRNA expression is often accompanied by low levels of HCN4 mRNA, our findings suggest that PV-IR cells co-express HCN1 and HCN4, while HCN2 expression in cell bodies is at low levels. The activation properties of homomeric HCN4 channels are slow compared to those of homomeric HCN1 or HCN2; however, it is possible that many HCN channels are heteromeric assemblies of homologous subunits (Much et al. 2003; Wahl-Schott & Biel, 2009). As heteromeric HCN channels in the mouse brain have been shown to exist in vivo, our findings suggest that these channels in spinal PV-IR interneurons are likely to be heteromers containing both HCN1 and HCN4 subunits (Much et al. 2003).
Ih currents recorded in PVeGFP neurons had relatively slow kinetics and were best fitted with a double exponential time constant. These results are consistent with the presence of a mixed contribution by fast (HCN1) and slow (HCN4) subunits (Santoro et al. 2000). Together, these data support the existence of HCN1–HCN4 heteromers, or coexistence of HCN1 and HCN4 homomers, in PV expressing dorsal horn neurons. Future experiments will be required to differentiate between these possibilities. It is important, however, to note that while most PVeGFP neurons express Ih currents, only ∼50% express HCN4 and ∼65% express HCN1 and therefore some variability in HCN channel composition is likely to exist across PVeGFP neurons. Another factor that will influence the relationship between HCN channel subunit stoichiometry and Ih current kinetics is the well-described variable distribution of HCN subunits in somatodendritic and axonal membranes (Santoro & Tibbs, 1999). For example, our electrophysiological experiments may have recorded Ih currents generated from sites distal to the soma. These regions were not assessed in our colocalization study of HCN subunits and PV expression, which was limited to the cell somata. Future studies that specifically assess HCN subunit expression throughout the somata and dendrites of PV-positive neurons will be required to fully address this issue. Finally, Ih is known to be highly mutable and thus the presence of this current in PV neurons is a possible target for endogenous and exogenous modulation. For example, it is well documented that Ih properties are modulated by intracellular cyclic adenosine monophosphate (cAMP) and that this mechanism increases Ih activation following stimulation of β-adrenergic and serotonergic receptors (Pape & McCormick, 1989). In addition, it has recently been shown that Ih is modulated by anaesthetics such as isoflurane and propofol in a subunit specific manner (Chen et al. 2005; Chen et al. 2009).
In contrast to the capacity of PVeGFP neurons for high frequency discharge, our electrophysiological analysis of excitatory synaptic inputs suggests this population receives relatively weak excitatory drive (Fig. 11). Most notably, sEPSC frequency and amplitude were reduced in PVeGFP neurons. These findings are consistent with studies in rat (Yasaka et al. 2007) and hamster (Grudt & Perl, 2002) that have reported low sEPSC frequencies in lamina II Islet and central cells, compared to other cells types. Together, this combination of high AP discharge frequency and weak excitatory drive suggests PVeGFP neurons use a specific mode of signal processing. High frequency AP discharge guarantees PV neurons respond vigorously when activated. In contrast, low frequency excitatory drive provides minimal background synaptic noise and facilitates precisely timed AP discharge (Rodriguez-Molina et al. 2007). Given our postulated role for PV neurons in providing presynaptic inhibition to myelinated low threshold afferent inputs, such faithful and reliable conversion of excitation into precisely timed outputs may be critical for shaping modality specific sensory processing in the spinal cord.
Conclusions
This study has shown that inhibitory parvalbumin-expressing axon terminals in lamina IIi preferentially form axo-axonic synapses on to the central terminals of myelinated afferent fibres. It is highly likely that these inhibitory axons are derived from cells in laminae IIi and III. We provide evidence that these cells also receive direct input from myelinated afferent terminals and are therefore likely to play a critical role in modulating sensory input from Aδ down-hair afferents and low threshold mechanoreceptors. As myelinated fibres provide a major source of synaptic inputs onto parvalbumin-expressing cells and also from the main synaptic target of their axons, it is tempting to speculate that they play a crucial role in the development of tactile allodynia as any reduction in the presynaptic inhibition they mediate could contribute to the development of central sensitization.
Acknowledgments
We thank Hannah Monyer for the generous gift of the PV-EGFP transgenic mice. We also thank L. Hickey and J. F. Madden for excellent technical assistance, maintaining transgenic mouse lines and genotyping expertise. This research was supported by a National Health and Medical Research Council (NHMRC) of Australia grant 631000 (B.A.G), HMRI grant (B.A.G. and R.J.C.), and BBSRC grant BB/J000620/1 (D.I.H.).
Glossary
- CGRP
calcitonin gene related peptide
- DAB
diaminobenzidine
- eGFP
enhanced green fluorescent protein
- HCN
hyperpolarization-activated cyclic nucleotide gated
- IB4
isolectin B4
- PV
parvalbumin
- PKCγ
protein kinase Cγ
- VGAT
vesicular GABA transporter
- VGLUT1
vesicular glutamate transporter type I
Author contributions
B.A.G. and D.I.H. conceived and designed the experiments. B.A.G., D.I.H., S.S., C.M.K. and K.A.B. collected and analysed the data. D.I.H., R.J.C and B.A.G. drafted the article. Experiments were performed in the laboratories of B.A.G. and D.I.H at the University of Newcastle and University of Glasgow, respectively. M.W. produced and supplied antibodies raised in guinea pig against GFP, PKCγ and parvalbumin. All authors approved the final version of this manuscript.
References
- Amara SG, Arriza JL, Leff SE, Swanson LW, Evans RM, Rosenfeld MG. Expression in brain of a messenger RNA encoding a novel neuropeptide homologous to calcitonin gene-related peptide. Science. 1985;229:1094–1097. doi: 10.1126/science.2994212. [DOI] [PubMed] [Google Scholar]
- Anelli R, Heckman CJ. The calcium binding proteins calbindin, parvalbumin, and calretinin have specific patterns of expression in the gray matter of cat spinal cord. J Neurocytol. 2005;34:369–385. doi: 10.1007/s11068-006-8724-2. [DOI] [PubMed] [Google Scholar]
- Antal M, Freund TF, Polgár E. Calcium-binding proteins, parvalbumin- and calbindin-D 28k-immunoreactive neurons in the rat spinal cord and dorsal root ganglia: a light and electron microscopic study. J Comp Neurol. 1990;295:467–484. doi: 10.1002/cne.902950310. [DOI] [PubMed] [Google Scholar]
- Antal M, Polgár E, Chalmers J, Minson JB, Llewellyn-Smith I, Heizmann CW, Somogyi P. Different populations of parvalbumin- and calbindin-D28k-immunoreactive neurons contain GABA and accumulate 3H-D-aspartate in the dorsal horn of the rat spinal cord. J Comp Neurol. 1991;314:114–124. doi: 10.1002/cne.903140111. [DOI] [PubMed] [Google Scholar]
- Antal M, Papp I, Bahaerguli N, Veress G, Vereb G. Expression of hyperpolarization-activated and cyclic nucleotide-gated cation channel subunit 2 in axon terminals of peptidergic nociceptive primary sensory neurons in the superficial spinal dorsal horn of rats. Eur J Neurosci. 2004;19:1336–1342. doi: 10.1111/j.1460-9568.2004.03235.x. [DOI] [PubMed] [Google Scholar]
- Aponte Y, Lien CC, Reisinger E, Jonas P. Hyperpolarization-activated cation channels in fast-spiking interneurons of rat hippocampus. J Physiol. 2006;574:229–243. doi: 10.1113/jphysiol.2005.104042. [DOI] [PMC free article] [PubMed] [Google Scholar]
- Barry PH, Lynch JW. Liquid junction potentials and small cell effects in patch-clamp analysis. J Membr Biol. 1991;121:101–117. doi: 10.1007/BF01870526. [DOI] [PubMed] [Google Scholar]
- Bicknell HR, Jr, Beal JA. Axonal and dendritic development of substantia gelatinosa neurons in the lumbosacral spinal cord of the rat. J Comp Neurol. 1984;226:508–522. doi: 10.1002/cne.902260406. [DOI] [PubMed] [Google Scholar]
- Brumovsky P, Watanabe M, Hokfelt T. Expression of the vesicular glutamate transporters-1 and -2 in adult mouse dorsal root ganglia and spinal cord and their regulation by nerve injury. Neuroscience. 2007;147:469–490. doi: 10.1016/j.neuroscience.2007.02.068. [DOI] [PubMed] [Google Scholar]
- Caillard O, Moreno H, Schwaller B, Llano I, Celio MR, Marty A. Role of the calcium-binding protein parvalbumin in short-term synaptic plasticity. Proc Natl Acad Sci U S A. 2000;97:13372–13377. doi: 10.1073/pnas.230362997. [DOI] [PMC free article] [PubMed] [Google Scholar]
- Chaudhry FA, Reimer RJ, Bellochio EE, Danbolt NC, Osen KK, Edwards RH, Störm-Mathisen J. The vesicular GABA transporter, VGAT, localises to synaptic vesicles in sets of glycinergic as well as GABAergic neurons. J Neurosci. 1998;18:9733–9750. doi: 10.1523/JNEUROSCI.18-23-09733.1998. [DOI] [PMC free article] [PubMed] [Google Scholar]
- Chen X, Shu S, Bayliss DA. Suppression of Ih contributes to propofol-induced inhibition of mouse cortical pyramidal neurons. J Neurophysiol. 2005;94:3872–3883. doi: 10.1152/jn.00389.2005. [DOI] [PubMed] [Google Scholar]
- Chen X, Shu S, Kennedy DP, Willcox SC, Bayliss DA. Subunit-specific effects of isoflurane on neuronal Ih in HCN1 knockout mice. J Neurophysiol. 2009;101:129–140. doi: 10.1152/jn.01352.2007. [DOI] [PMC free article] [PubMed] [Google Scholar]
- Clements JD, Bekkers JM. Detection of spontaneous synaptic events with an optimally scaled template. Biophys J. 1997;73:220–229. doi: 10.1016/S0006-3495(97)78062-7. [DOI] [PMC free article] [PubMed] [Google Scholar]
- Conradi S. Ultrastructure and distribution of neuronal and glial elements on the motoneuron surface in the lumbosacral spinal cord of the adult cat. Acta Physiol Scand Suppl. 1969a;332:5–48. [PubMed] [Google Scholar]
- Conradi S. Ultrastructure of dorsal root boutons on lumbosacral motoneurons of the adult cat, as revealed by dorsal root section. Acta Physiol Scand Suppl. 1969b;332:85–115. [PubMed] [Google Scholar]
- Cuello AC, Milstein C, Priestly JV. Use of monoclonal antibodies in immunocytochemistry with special reference to the central nervous system. Brain Res Bull. 1980;5:575–587. doi: 10.1016/0361-9230(80)90264-6. [DOI] [PubMed] [Google Scholar]
- Daniele CA, MacDermott AB. Low-threshold primary afferent drive onto GABAergic Interneurons in the superficial dorsal horn of the mouse. J Neurosci. 2009;29:686–695. doi: 10.1523/JNEUROSCI.5120-08.2009. [DOI] [PMC free article] [PubMed] [Google Scholar]
- Davidoff RA. Gamma-aminobutyric acid antagonism and presynaptic inhibition in the frog spinal cord. Science. 1972;175:331–333. doi: 10.1126/science.175.4019.331. [DOI] [PubMed] [Google Scholar]
- DeFelipe J, Hendry SH, Jones EG. Visualization of chandelier cell axons by parvalbumin immunoreactivity in monkey cerebral cortex. Proc Natl Acad Sci U S A. 1989;86:2093–2097. doi: 10.1073/pnas.86.6.2093. [DOI] [PMC free article] [PubMed] [Google Scholar]
- Eccles JC, Eccles RM, Magni F. Central inhibitory action attributable to presynaptic depolarization produced by muscle afferent volleys. J Physiol. 1961;159:147–166. doi: 10.1113/jphysiol.1961.sp006798. [DOI] [PMC free article] [PubMed] [Google Scholar]
- Eccles JC, Schmidt R, Willis WD. Pharmacological studies on presynaptic inhibition. J Physiol. 1963;168:500–530. doi: 10.1113/jphysiol.1963.sp007205. [DOI] [PMC free article] [PubMed] [Google Scholar]
- Fabri M, Conti F. Calcitonin gene-related peptide-positive neurons and fibres in the cat dorsal column nuclei. Neuroscience. 1990;35:167–174. doi: 10.1016/0306-4522(90)90131-m. [DOI] [PubMed] [Google Scholar]
- Frank K, Fuortes M. Presynaptic and postsynaptic inhibition of monosynaptic reflexes. Fed Proc. 1957;16:39–40. [Google Scholar]
- Giesbrecht CJ, Mackay JP, Silveira HB, Urban JH, Colmers WF. Countervailing modulation if Ih by neuropeptide Y and corticotrophin-releasing factor in basolateral amygdale as a possible mechanism for their effects on stress-related behaviours. J Neurosci. 2010;30:16970–16982. doi: 10.1523/JNEUROSCI.2306-10.2010. [DOI] [PMC free article] [PubMed] [Google Scholar]
- Graham BA, Brichta AM, Callister RJ. In vivo responses of mouse superficial dorsal horn neurones to both current injection and peripheral cutaneous stimulation. J Physiol. 2004;561:749–763. doi: 10.1113/jphysiol.2004.072645. [DOI] [PMC free article] [PubMed] [Google Scholar]
- Graham BA, Brichta AM, Callister RJ. Moving from an averaged to specific view of spinal cord pain processing circuits. J Neurophysiol. 2007a;98:1057–1063. doi: 10.1152/jn.00581.2007. [DOI] [PubMed] [Google Scholar]
- Graham BA, Brichta AM, Callister RJ. Pinch-current injection defines two discharge profiles in mouse superficial dorsal horn neurones, in vitro. J Physiol. 2007b;578:787–798. doi: 10.1113/jphysiol.2006.123349. [DOI] [PMC free article] [PubMed] [Google Scholar]
- Graham BA, Brichta AM, Callister RJ. Recording temperature affects the excitability of mouse superficial dorsal horn neurons, in vitro. J Neurophysiol. 2008;99:2048–2059. doi: 10.1152/jn.01176.2007. [DOI] [PubMed] [Google Scholar]
- Graham BA, Brichta AM, Schofield PR, Callister RJ. Altered potassium channel function in the superficial dorsal horn of the spastic mouse. J Physiol. 2007c;584:121–136. doi: 10.1113/jphysiol.2007.138198. [DOI] [PMC free article] [PubMed] [Google Scholar]
- Graham BA, Schofield PR, Sah P, Callister RJ. Altered inhibitory synaptic transmission in superficial dorsal horn neurones in spastic and oscillator mice. J Physiol. 2003;551:905–916. doi: 10.1113/jphysiol.2003.049064. [DOI] [PMC free article] [PubMed] [Google Scholar]
- Grudt TJ, Perl ER. Correlations between neuronal morphology and electrophysiological features in the rodent superficial dorsal horn. J Physiol. 2002;540:189–207. doi: 10.1113/jphysiol.2001.012890. [DOI] [PMC free article] [PubMed] [Google Scholar]
- Hantman AW, van den Pol AN, Perl ER. Morphological and physiological features of a set of spinal substantia gelatinosa neurons defined by green fluorescent protein expression. J Neurosci. 2004;24:836–842. doi: 10.1523/JNEUROSCI.4221-03.2004. [DOI] [PMC free article] [PubMed] [Google Scholar]
- Heinke B, Ruscheweyh R, Forsthuber L, Wunderbaldinger G, Sandkuhler J. Physiological, neurochemical and morphological properties of a subgroup of GABAergic spinal lamina II neurones identified by expression of green fluorescent protein in mice. J Physiol. 2004;560:249–266. doi: 10.1113/jphysiol.2004.070540. [DOI] [PMC free article] [PubMed] [Google Scholar]
- Hughes DI, Scott DT, Todd AJ, Riddell JS. Lack of evidence for sprouting of Aβ afferents into the superficial laminas of the spinal cord dorsal horn after nerve section. J Neurosci. 2003;23:9491–9499. doi: 10.1523/JNEUROSCI.23-29-09491.2003. [DOI] [PMC free article] [PubMed] [Google Scholar]
- Hughes DI, Mackie M, Nagy GG, Riddell JS, Maxwell DJ, Szabó G, Erdélyi F, Veress G, Szűcs P, Antal M, Todd AJ. P boutons in lamina IX of the rodent spinal cord express high levels of GAD65 and originate from cells in the deep medial dorsal horn. Proc Natl Acad Sci U S A. 2005;102:9038–9043. doi: 10.1073/pnas.0503646102. [DOI] [PMC free article] [PubMed] [Google Scholar]
- Jimenez I, Rudomin P, Solodkin M. Mechanisms involved in the depolarization of cutaneous afferents produced by segmental and descending inputs in the cat spinal cord. Exp Brain Res. 1987;69:195–207. doi: 10.1007/BF00247042. [DOI] [PubMed] [Google Scholar]
- Kawaguchi Y, Katsumaru H, Kosaka T, Heizmann CW, Hama K. Fast spiking cells in rat hippocampus (CA1 region) contain the calcium-binding protein parvalbumin. Brain Res. 1987;416:369–374. doi: 10.1016/0006-8993(87)90921-8. [DOI] [PubMed] [Google Scholar]
- Kawaguchi Y, Kubota Y. Correlation of physiological subgroupings of nonpyramidal cells with parvalbumin- and calbindinD28k-immunoreactive neurons in layer V of rat frontal cortex. J Neurophysiol. 1993;70:387–396. doi: 10.1152/jn.1993.70.1.387. [DOI] [PubMed] [Google Scholar]
- Khurana S, Liu Z, Lewis AS, Rosa K, Chetkovich D, Golding NL. An essential role for the modulation of hyperpolarization-activated current in the development of binaural temporal precision. J. Neurosci. 2012;32:2814–2823. doi: 10.1523/JNEUROSCI.3882-11.2012. [DOI] [PMC free article] [PubMed] [Google Scholar]
- Knyihar-Csillik E, Csillik B, Rakic P. Ultrastructure of normal and degenerating glomerular terminals of dorsal root axons in the substantia gelatinosa of the rhesus monkey. J Comp Neurol. 1982;210:357–375. doi: 10.1002/cne.902100404. [DOI] [PubMed] [Google Scholar]
- Laing I, Todd AJ, Heizmann CW, Schmidt HH. Subpopulations of GABAergic neurons in laminae I-III of rat spinal dorsal horn defined by coexistence with classical transmitters, peptides, nitric oxide synthase or parvalbumin. Neuroscience. 1994;61:123–132. doi: 10.1016/0306-4522(94)90065-5. [DOI] [PubMed] [Google Scholar]
- Light AR, Perl ER. Spinal termination of functionally identified primary afferent neurons with slowly conducting myelinated fibers. J Comp Neurol. 1979;186:133–150. doi: 10.1002/cne.901860203. [DOI] [PubMed] [Google Scholar]
- Lu Y, Perl ER. A specific inhibitory pathway between substantia gelatinosa neurons receiving direct C-fiber input. J Neurosci. 2003;23:8752–8758. doi: 10.1523/JNEUROSCI.23-25-08752.2003. [DOI] [PMC free article] [PubMed] [Google Scholar]
- Maxwell DJ, Belle MD, Cheunsuang O, Stewart A, Morris R. Morphology of inhibitory and excitatory interneurons in superficial laminae of the rat dorsal horn. J Physiol. 2007;584:521–533. doi: 10.1113/jphysiol.2007.140996. [DOI] [PMC free article] [PubMed] [Google Scholar]
- Maxwell DJ, Noble R. Relationships between hair-follicle afferent terminations and glutamic acid decarboxylase-containing boutons in the cat's spinal cord. Brain Res. 1987;408:308–312. doi: 10.1016/0006-8993(87)90394-5. [DOI] [PubMed] [Google Scholar]
- Melnick I. Morphophysiologic properties of islet cells in substantia gelatinosa of the rat spinal cord. Neurosci Lett. 2008;446:65–69. doi: 10.1016/j.neulet.2008.09.027. [DOI] [PubMed] [Google Scholar]
- Mesnage B, Gaillard S, Godin AG, Rodeau JL, Hammer M, Von Engelhardt J, Wiseman PW, De Koninck Y, Schlichter R, Cordero-Erausquin M. Morphological and functional characterization of cholinergic interneurons in the dorsal horn of the mouse spinal cord. J Comp Neurol. 2011;519:3139–3158. doi: 10.1002/cne.22668. [DOI] [PubMed] [Google Scholar]
- Meyer AH, Katona I, Blatow M, Rozov A, Monyer H. In vivo labeling of parvalbumin-positive interneurons and analysis of electrical coupling in identified neurons. J Neurosci. 2002;22:7055–7064. doi: 10.1523/JNEUROSCI.22-16-07055.2002. [DOI] [PMC free article] [PubMed] [Google Scholar]
- Milligan CJ, Edwards IJ, Deuchars J. HCN1 ion channel immunoreactivity in spinal cord and medulla oblongata. Brain Res. 2006;1081:79–91. doi: 10.1016/j.brainres.2006.01.019. [DOI] [PubMed] [Google Scholar]
- Much B, Wahl-Schott C, Zong X, Schneider A, Baumann L, Moosmang S, Ludwig A, Biel M. Role of subunit heteromerization and N-linked glycosylation in the formation of functional hyperpolarization-activated cyclic nucleotide-gated channels. J Biol Chem. 2003;278:43781–43786. doi: 10.1074/jbc.M306958200. [DOI] [PubMed] [Google Scholar]
- Nagy GG, Al-Ayyan M, Andrew D, Fukaya M, Watanabe M, Todd AJ. Widespread expression of the AMPA receptor GluR2 subunit at glutamatergic synapses in the rat spinal cord and phosphorylation of GluR1 in response to noxious stimulation revealed with an antigen-unmasking method. J Neurosci. 2004;24:5766–5777. doi: 10.1523/JNEUROSCI.1237-04.2004. [DOI] [PMC free article] [PubMed] [Google Scholar]
- Nakamura M, Sato K, Fukaya M, Araishi K, Aiba A, Kano M, Watanabe M. Signaling complex formation of phospholipase Cb4 with metabotropic glutamate receptor type 1a and 1,4,5-trisphosphate receptor at the perisynapse and endoplasmic reticulum in the mouse brain. Eur J Neurosci. 2004;20:2929–2944. doi: 10.1111/j.1460-9568.2004.03768.x. [DOI] [PubMed] [Google Scholar]
- Neumann S, Braz JM, Skinner K, Llewellyn-Smith IJ, Basbaum AI. Innocuous, not noxious, input activates PKCgamma interneurons of the spinal dorsal horn via myelinated afferent fibers. J Neurosci. 2008;28:7936–7944. doi: 10.1523/JNEUROSCI.1259-08.2008. [DOI] [PMC free article] [PubMed] [Google Scholar]
- Nielsen J, Petersen N. Is presynaptic inhibition distributed to corticospinal fibres in man? J Physiol. 1994;477:47–58. doi: 10.1113/jphysiol.1994.sp020170. [DOI] [PMC free article] [PubMed] [Google Scholar]
- Pape HC, McCormick DA. Noradrenaline and serotonin selectively modulate thalamic burst firing by enhancing a hyperpolarization-activated cation current. Nature. 1989;340:715–718. doi: 10.1038/340715a0. [DOI] [PubMed] [Google Scholar]
- Pawelzik H, Hughes DI, Thomson AM. Physiological and morphological diversity of immunocytochemically defined parvalbumin- and cholecystokinin-positive interneurones in CA1 of the adult rat hippocampus. J Comp Neurol. 2002;443:346–367. doi: 10.1002/cne.10118. [DOI] [PubMed] [Google Scholar]
- Polgár E, Hughes DI, Riddell JS, Maxwell DJ, Puskar Z, Todd AJ. Selective loss of spinal GABAergic or glycinergic neurons is not necessary for development of thermal hyperalgesia in the chronic constriction injury model of neuropathic pain. Pain. 2003;104:229–239. doi: 10.1016/s0304-3959(03)00011-3. [DOI] [PubMed] [Google Scholar]
- Ralston HJ, 3rd, Light AR, Ralston DD, Perl ER. Morphology and synaptic relationships of physiologically identified low-threshold dorsal root axons stained with intra-axonal horseradish peroxidase in the cat and monkey. J Neurophysiol. 1984;51:777–792. doi: 10.1152/jn.1984.51.4.777. [DOI] [PubMed] [Google Scholar]
- Raviola E, Contini M. GABAergic synapses made by a retinal dopaminergic neuron. PNAS. 2003;100:1358–1363. doi: 10.1073/pnas.0337681100. [DOI] [PMC free article] [PubMed] [Google Scholar]
- Rethelyi M, Light AR, Perl ER. Synaptic complexes formed by functionally defined primary afferent units with fine myelinated fibers. J Comp Neurol. 1982;207:381–393. doi: 10.1002/cne.902070409. [DOI] [PubMed] [Google Scholar]
- Ribeiro-da-Silva A, Coimbra A. Two types of synaptic glomeruli and their distribution in laminae I-III of the rat spinal cord. J Comp Neurol. 1982;209:176–186. doi: 10.1002/cne.902090205. [DOI] [PubMed] [Google Scholar]
- Robinson RB, Siegelbaum SA. Hyperpolarization-activated cation currents: from molecules to physiological function. Annu Rev Physiol. 2003;65:453–480. doi: 10.1146/annurev.physiol.65.092101.142734. [DOI] [PubMed] [Google Scholar]
- Rodriguez-Molina VM, Aertsen A, Heck DH. Spike timing and reliability in cortical pyramidal neurons: effects of EPSC kinetics, input synchronization and background noise on spike timing. PLoS One. 2007;2:e319. doi: 10.1371/journal.pone.0000319. [DOI] [PMC free article] [PubMed] [Google Scholar]
- Ruscheweyh R, Ikeda H, Heinke B, Sandkuhler J. Distinctive membrane and discharge properties of rat spinal lamina I projection neurones in vitro. J Physiol. 2004;555:527–543. doi: 10.1113/jphysiol.2003.054049. [DOI] [PMC free article] [PubMed] [Google Scholar]
- Ruscheweyh R, Sandkuhler J. Lamina-specific membrane and discharge properties of rat spinal dorsal horn neurones in vitro. J Physiol. 2002;541:231–244. doi: 10.1113/jphysiol.2002.017756. [DOI] [PMC free article] [PubMed] [Google Scholar]
- Russo I, Oksman A, Vaupel B, Goldberg DE. A calpain unique to alveolates is essential in Plasmodium falciparum and its knockdown reveals an involvement in pre-S-phase development. PNAS. 2009;106:1554–1559. doi: 10.1073/pnas.0806926106. [DOI] [PMC free article] [PubMed] [Google Scholar]
- Santoro B, Chen S, Luthi A, Pavlidis P, Shumyatsky GP, Tibbs GR, Siegelbaum SA. Molecular and functional heterogeneity of hyperpolarization-activated pacemaker channels in the mouse CNS. J Neurosci. 2000;20:5264–5275. doi: 10.1523/JNEUROSCI.20-14-05264.2000. [DOI] [PMC free article] [PubMed] [Google Scholar]
- Santoro B, Tibbs GR. The HCN gene family: molecular basis of the hyperpolarization-activated pacemaker channels. Ann N Y Acad Sci. 1999;868:741–764. doi: 10.1111/j.1749-6632.1999.tb11353.x. [DOI] [PubMed] [Google Scholar]
- Saywell SA, Ford TW, Meehan CF, Todd AJ, Kirkwood PA. Electrophysiological and morphological characterization of propriospinal interneurons in the thoracic spinal cord. J Neurophysiol. 2011;105:806–826. doi: 10.1152/jn.00738.2010. [DOI] [PMC free article] [PubMed] [Google Scholar]
- Schwaller B, Dick J, Dhoot G, Carroll S, Vrbova G, Nicotera P, Pette D, Wyss A, Bluethmann H, Hunziker W, Celio MR. Am J Physiol. 1999;276:395–403. doi: 10.1152/ajpcell.1999.276.2.C395. [DOI] [PubMed] [Google Scholar]
- Schwaller B, Meyer M, Schiffmann S. ‘New’ functions for ‘old’ proteins: the role of the calcium-binding proteins calbindin D-28k, calretinin and parvalbumin, in cerebellar physiology. Studies with knockout mice. Cerebellum. 2002;1:241–258. doi: 10.1080/147342202320883551. [DOI] [PubMed] [Google Scholar]
- Sokal R, Rohlf F. Biometry: The Principles and Practice of Statistics in Biological Research. New York: W. H. Freeman; 1995. [Google Scholar]
- Spike RC, Todd AJ. Ultrastructural and immunocytochemical study of lamina II islet cells in rat spinal dorsal horn. J Comp Neurol. 1992;323:359–369. doi: 10.1002/cne.903230305. [DOI] [PubMed] [Google Scholar]
- Todd AJ. Electron microscope study of Golgi-stained cells in lamina II of the rat spinal dorsal horn. J Comp Neurol. 1988;275:145–157. doi: 10.1002/cne.902750112. [DOI] [PubMed] [Google Scholar]
- Todd AJ. GABA and glycine in synaptic glomeruli of the rat spinal dorsal horn. Eur J Neurosci. 1996;8:2492–2498. doi: 10.1111/j.1460-9568.1996.tb01543.x. [DOI] [PubMed] [Google Scholar]
- Todd AJ. Neuronal circuitry for pain processing in the dorsal horn. Nat Rev Neurosci. 2010;11:823–836. doi: 10.1038/nrn2947. [DOI] [PMC free article] [PubMed] [Google Scholar]
- Todd AJ, Hughes DI, Polgar E, Nagy GG, Mackie M, Ottersen OP, Maxwell DJ. The expression of vesicular glutamate transporters VGLUT1 and VGLUT2 in neurochemically defined axonal populations in the rat spinal cord with emphasis on the dorsal horn. Eur J Neurosci. 2003;17:13–27. doi: 10.1046/j.1460-9568.2003.02406.x. [DOI] [PubMed] [Google Scholar]
- Todd AJ, Maxwell DJ, Brown AG. Relationships between hair-follicle afferent axons and glycine-immunoreactive profiles in cat spinal dorsal horn. Brain Res. 1991;564:132–137. doi: 10.1016/0006-8993(91)91362-5. [DOI] [PubMed] [Google Scholar]
- Todd AJ, McKenzie J. GABA-immunoreactive neurons in the dorsal horn of the rat spinal cord. Neuroscience. 1989;31:799–806. doi: 10.1016/0306-4522(89)90442-9. [DOI] [PubMed] [Google Scholar]
- Todd AJ, Spike RC. The localization of classical transmitters and neuropeptides within neurons in laminae I-III of the mammalian spinal dorsal horn. Prog Neurobiol. 1993;41:609–645. doi: 10.1016/0301-0082(93)90045-t. [DOI] [PubMed] [Google Scholar]
- Todd AJ, Sullivan AC. Light microscope study of the coexistence of GABA-like and glycine-like immunoreactivities in the spinal cord of the rat. J Comp Neurol. 1990;296:496–505. doi: 10.1002/cne.902960312. [DOI] [PubMed] [Google Scholar]
- Wahl-Schott C, Biel M. HCN channels: structure, cellular regulation and physiological function. Cell Mol Life Sci. 2009;66:470–494. doi: 10.1007/s00018-008-8525-0. [DOI] [PMC free article] [PubMed] [Google Scholar]
- Wang H, Rivero-Melian C, Robertson B, Grant G. Transganglionic transport and binding of the isolectin B4 from Griffonia simplicifolia I in rat primary sensory neurons. Neuroscience. 1994;62:539–551. doi: 10.1016/0306-4522(94)90387-5. [DOI] [PubMed] [Google Scholar]
- Watson AH. Presynaptic modulation of sensory afferents in the invertebrate and vertebrate nervous system. Comp Biochem Physiol Comp Physiol. 1992;103:227–239. doi: 10.1016/0300-9629(92)90573-9. [DOI] [PubMed] [Google Scholar]
- Watson AH. Synaptic interactions between the terminals of slow-adapting type II mechanoreceptor afferents and neurones expressing gamma-aminobutyric acid- and glycine-like immunoreactivity in the rat spinal cord. J Comp Neurol. 2004;471:168–79. doi: 10.1002/cne.20043. [DOI] [PubMed] [Google Scholar]
- Watson AH, Bazzaz AA. GABA and glycine-like immunoreactivity at axoaxonic synapses on 1a muscle afferent terminals in the spinal cord of the rat. J Comp Neurol. 2001;433:335–348. doi: 10.1002/cne.1143. [DOI] [PubMed] [Google Scholar]
- Watson AH, Hughes DI, Bazzaz AA. Synaptic relationships between hair follicle afferents and neurones expressing GABA and glycine-like immunoreactivity in the spinal cord of the rat. J Comp Neurol. 2002;452:367–380. doi: 10.1002/cne.10410. [DOI] [PubMed] [Google Scholar]
- Yamamoto T, Carr PA, Baimbridge KG, Nagy JI. Parvalbumin- and calbindin D28k-immunoreactive neurons in the superficial layers of the spinal cord dorsal horn of rat. Brain Res Bull. 1989;23:493–508. doi: 10.1016/0361-9230(89)90195-0. [DOI] [PubMed] [Google Scholar]
- Yasaka T, Kato G, Furue H, Rashid MH, Sonohata M, Tamae A, Murata Y, Masuko S, Yoshimura M. Cell-type-specific excitatory and inhibitory circuits involving primary afferents in the substantia gelatinosa of the rat spinal dorsal horn in vitro. J Physiol. 2007;581:603–618. doi: 10.1113/jphysiol.2006.123919. [DOI] [PMC free article] [PubMed] [Google Scholar]
- Yasaka T, Tiong SY, Hughes DI, Riddell JS, Todd AJ. Populations of inhibitory and excitatory interneurons in lamina II of the adult rat spinal dorsal horn revealed by a combined electrophysiological and anatomical approach. Pain. 2010;151:475–488. doi: 10.1016/j.pain.2010.08.008. [DOI] [PMC free article] [PubMed] [Google Scholar]
- Yoshida S, Senba E, Kubota Y, Hagihira S, Yoshiya I, Emson PC, Tohyama M. Calcium-binding proteins calbindin and parvalbumin in the superficial dorsal horn of the rat spinal cord. Neuroscience. 1990;37:839–848. doi: 10.1016/0306-4522(90)90113-i. [DOI] [PubMed] [Google Scholar]
- Yoshimura M, Jessell TM. Membrane properties of rat substantia gelatinosa neurons in vitro. J Neurophysiol. 1989;62:109–118. doi: 10.1152/jn.1989.62.1.109. [DOI] [PubMed] [Google Scholar]
- Zheng J, Lu Y, Perl ER. Inhibitory neurones of the spinal substantia gelatinosa mediate interaction of signals from primary afferents. J Physiol. 2010;588:2065–2075. doi: 10.1113/jphysiol.2010.188052. [DOI] [PMC free article] [PubMed] [Google Scholar]