Abstract
The signature of slow-wave sleep in the electroencephalogram (EEG) is large-amplitude fluctuation of the field potential, which reflects synchronous alternation of activity and silence across cortical neurons. While initiation of the active cortical states during sleep slow oscillation has been intensively studied, the biological mechanisms which drive the network transition from an active state to silence remain poorly understood. In the current study, using a combination of in vivo electrophysiology and thalamocortical network simulation, we explored the impact of intrinsic and synaptic inhibition on state transition during sleep slow oscillation. We found that in normal physiological conditions, synaptic inhibition controls the duration and the synchrony of active state termination. The decline of interneuron-mediated inhibition led to asynchronous downward transition across the cortical network and broke the regular slow oscillation pattern. Furthermore, in both in vivo experiment and computational modelling, we revealed that when the level of synaptic inhibition was reduced significantly, it led to a recovery of synchronized oscillations in the form of seizure-like bursting activity. In this condition, the fast active state termination was mediated by intrinsic hyperpolarizing conductances. Our study highlights the significance of both intrinsic and synaptic inhibition in manipulating sleep slow rhythms.
Key points
A signature of deep sleep in the EEG is large-amplitude fluctuation of field potential, which reflects alternating periods of activity and silence in the thalamocortical network.
Transitions between active and silent states of sleep slow oscillation are well synchronous between remote populations of neurons with the onsets of silent states synchronized better than the onsets of activity.
We found that synaptic inhibition plays a major role in terminating active cortical states; strong synaptic inhibition is necessary to synchronize onsets of silent states during normal sleep slow oscillation.
We further show that when synaptic inhibition is significantly reduced, active state termination is mediated by intrinsic hyperpolarizing conductances.
Our study suggests that inhibitory interaction in the cortical network actively mediates the patterns of neural activity during slow-wave sleep and may, therefore, contribute to various brain functions developed during deep sleep.
Introduction
The signature characteristic of slow-wave sleep in the electroencephalogram (EEG) is slow (<1 Hz) and large-amplitude fluctuation of the field potential (Blake & Gerard, 1937), which reflects synchronous alternating periods of activity and silence across the cortical network (Steriade et al. 1993a,c; Contreras & Steriade, 1995; Achermann & Borbely, 1997; Steriade et al. 2001; Timofeev et al. 2001; Peterson et al. 2003). Similar patterns were recorded from neostriatal neurons by Wilson & Kawaguchi (1996), who introduced the now widely used terms of ‘Up state’ for the depolarized phases and ‘Down state’ for the hyperpolarized phases of sleep slow oscillation (Mahon et al. 2006).
Each slow oscillation cycle starts in a particular location of the cerebral cortex and rapidly propagates to the other regions (Massimini et al. 2004; Volgushev et al. 2006). Cortically generated slow oscillation was also found to entrain the thalamus (Steriade et al. 1993b; Contreras & Steriade, 1995; Timofeev & Steriade, 1996). During slow-wave sleep, oscillatory activities of neocortical and thalamic neurons display close phase relations (Contreras & Steriade, 1995). Similar to neocortical and neostriatal neurons, both thalamic reticular (RE) and thalamocortical (TC) neurons are hyperpolarized during silent states due to disfacilitation, i.e. an absence of spontaneous synaptic activity (Wilson et al. 1983; Wilson 1986; Contreras et al. 1996; Timofeev et al. 1996). During active states, cortical, neostriatal and inhibitory RE neurons are depolarized and fire spikes, whereas TC neurons are primarily hyperpolarized, revealing rhythmic IPSPs and occasional firing of spike-bursts, which is typical during the waning phase of spindles (Contreras & Steriade, 1995; Timofeev & Steriade, 1996; Rosanova & Timofeev, 2005).
Different mechanisms have been proposed to explain periodic initiation of active states during sleep slow oscillation. These mechanisms include spontaneous release of a neurotransmitter in cortical synapses during silent states, leading to summation of miniature postsynaptic currents and firing (Timofeev et al. 2000a; Bazhenov et al. 2002; Chauvette et al. 2010), spontaneous intrinsic activity in layer V intrinsically-bursting neurons (Sanchez-Vives et al. 2010), self-sustained asynchronous irregular activity in layer V (Destexhe 2009), and intrinsic oscillatory mechanisms in thalamocortical neurons (Hughes et al. 2002; Crunelli & Hughes, 2010). In all of the above scenarios, once sufficient number of action potentials was initiated, spiking activities then propagated to the entire population of neurons via dense lateral excitatory connections, and a cortical active state was initiated.
How does active state terminate? Recent experimental results revealed that the downward transition (from active state to silence) in cortical networks is often better synchronized than the upward transition (from silence to active state), and shows no latency bias for any location or cell type (Volgushev et al. 2006). This in vivo result could not be explained by existing models (Timofeev et al. 2000a; Compte et al. 2003; Hill & Tononi, 2005), and suggested that some larger scale biophysical mechanisms may be involved in manipulating the downward transition during slow oscillation.
Recent recordings of cortical neurons in awake and naturally sleeping animals found that during active cortical states, inhibitory synaptic potentials usually carry more powerful signals and longer-lasting effects than excitatory synaptic potentials (Rudolph et al. 2007). Inhibitory signals were also found to synchronously inhibit nearby pyramidal neurons (Shu et al. 2003; Hasenstaub et al. 2005; Rudolph et al. 2007; Sanchez-Vives et al. 2010). In the current study, we have explored the role of inhibitory interneurons in manipulating state transition during slow oscillation. Using a detailed conductance-based model of the thalamocortical network, we characterized the relative contribution of intrinsic and synaptic inhibition in controlling the temporal precision of network activities and maintaining the regular slow-wave sleep pattern.
Methods
Ethical approval
Experiments were carried out in accordance with the guidelines of the Canadian Council on Animal Care and approved by the Laval University Committee on Ethics and Animal Research. The cats for these experiments were purchased from a reputable animal breeding supplier in good health as determined by physical examination. Upon arrival at the animal house, all animals underwent standard examination by animal facilities technicians and a veterinarian, which is required by the Canadian Council on Animal Care. The animals were used for experiments within 5–20 days from arrival at the local animal house.
In vivo experiments
Preparation
The preparation for the experiment was identical to that previously described (Timofeev et al. 2000a). Briefly, four cats used in these experiments were anaesthetized with a mixture of ketamine and xylazine (10–15 and 2–3 mg kg−1). The EEG was monitored continuously during the experiments to maintain a deep level of anaesthesia; additional doses of anaesthetic were given at the slightest tendency toward an activated EEG pattern. In this study, the ketamine–xylazine was injected intramuscularly (i.m.), both for induction and for anaesthetic maintenance. In addition, all pressure points and tissues to be incised were infiltrated with lidocaine (0.5%). The cats were subject to neuromuscular blockade with gallamine triethiodide and artificially ventilated to an end-tidal CO2 of 3.5–3.8%. The heartbeat was monitored and kept constant (90–110 beats min−1). Body temperature was maintained at 37–38°C. Glucose saline (5% glucose, 10 ml i.p.) was given every 3–4 h during experiments, which lasted for 8–14 h. The stability of intracellular recordings was ensured by cisternal drainage, bilateral pneumothorax and hip suspension, and by filling the hole made for recordings with a solution of 4% agar. At the end of the experiments, cats were killed with a lethal dose of pentobarbital (50 mg kg−1 i.v.).
Isolated slabs (see Fig. 1 in Timofeev et al. 2000a) were prepared from areas 5 and 7 of the suprasylvian gyrus. After opening a hole in the parietal bone, a small perforation was made in the dura above a part of the pia that did not contain large vessels. A custom crescent knife was inserted along its curve into the cortex until the tip of the knife appeared about 10 mm frontally under the pia. The knife was then turned by 90 deg in both the right and left directions. The pia was intact except at the place where the knife entered. Slabs were about 8–10 mm long (rostro-caudal direction), 5–6 mm wide (medio-lateral direction), and 4–5 mm deep. The completeness of neuronal transections and the boundaries of the slab were verified in every case on 80 μm thionine-stained sections.
Figure 1. During slow oscillation, the termination of the active state is more synchronous across the cortical network than its initiation.
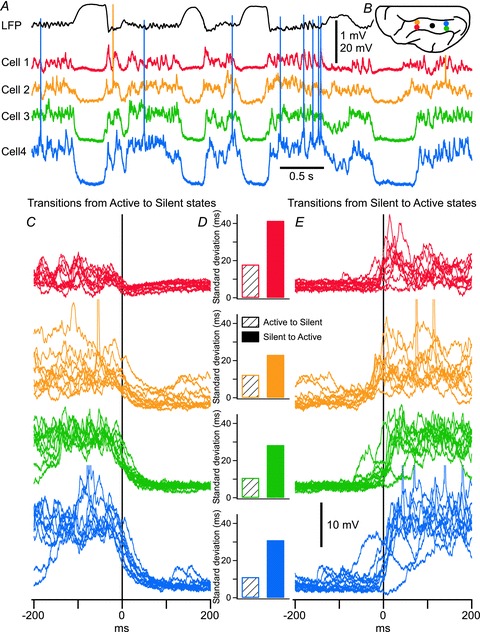
A, segment of simultaneous quadruple intracellular and local field potential recordings performed in the suprasylvian gyrus of a cat anaesthetized with ketamine–xylazine. Action potentials of cell 2 (orange) are truncated. B, schematic representation of electrode locations. The colour code applies for all panels. In C and E, the superposition of 10 transitions from active to silent state (in C) and from silent to active state (in E) for the four neurons shown in A. Time zero corresponds to the cluster mean time of transition evaluated at the half-amplitude of the transition. Action potentials are truncated for clarity. D, standard deviation of transition delays between individual neurons and the cluster mean time are displayed. Open bars represent the standard deviation of the downward transition, and filled bars represent the standard deviation of the upward transition. In each recorded neuron, the standard deviation during upward transitions is much larger than that during downward transition.
Recordings
Local field potential (LFP) recordings were obtained from a monopolar tungsten electrode (10 MΩ, FHC inc., Bowdoin, ME) inserted in the suprasylvian gyrus (area 7). A simultaneous quadruple intracellular recording from suprasylvian association areas 5 and 7 was performed using glass micropipettes (40–60 MΩ) filled with a solution of 2.5 m potassium acetate (KAc). A high-impedance amplifier with an active bridge circuitry was used to record the membrane potential and to inject current into the neurons. Two groups of two closely located neurons (less than 0.3 mm in lateral distance) were recorded at approximately 4 mm on each side (antero-posterior direction) of a LFP recording (see Fig. 1B).
For slab experiments, field potential recordings were obtained from bipolar coaxial macroelectrodes inserted in the slab, as well as outside the slab (adjacent suprasylvian areas and/or precruciate area 4) for control EEG recordings. The outer pole of the electrode was placed at the cortical surface, or 0.1 mm deep, and the inner pole was placed at 0.8–1 mm of cortical depth. The recordings in the slab were obtained in a bipolar setting between the outer and inner pole of electrodes using AM 3000 differential amplifiers (A-M systems, Inc., Sequim, WA, USA). An eight-electrode linear array (electrode separation, 1.5 mm) was inserted with six electrodes located in the slab and two other electrodes located anterior to the slab. The control recordings were obtained 3–5 h after preparation of the slab. Following control recordings, using a Hamilton syringe, 20 μl of a 50 mm solution of bicuculline (GABAA blocker) was injected in the middle of the slab, between the 3rd and 4th electrodes.
All electrographic recordings were digitalized at 10–20 kHz on a Vision acquisition system (Nicolet Instrument Technologies, Madison, WI, USA), and analysed using IgorPro 4.0 software (WaveMetrics, Inc, Lake Oswego, OR, USA).
Analysis of clusters
Transitions (active to silent and silent to active) were fitted with sigmoid curves to reduce the effect of noise, similar to the procedure found in a previous report (Chauvette et al. 2010). The timing of transition in each cell was defined as the time at half-amplitude of the sigmoid fit curve. The time zero (see Fig. 1C and E), corresponding to the mean of transition time across all recorded cells, was defined as the ‘cluster mean time of transition’, similar to that indicated in Volgushev et al. (2006). Next, delays from individual cells to the cluster mean time of transition were computed and the standard deviation of these delays was calculated (see Fig. 1D). Thus, smaller standard deviations acquired from this evaluation represent less variation of transition delays (more synchronous transition) across all recorded cells.
Computational models
Network geometry and stimulation
A schematic of geometry of the thalamocortical network model is shown in Fig. 3. This model incorporated two populations of thalamocortical (TC) cells: (1) matrix TC neurons forming diffuse projections to matrix pyramidal (PY) cortical neurons with cell bodies in layer V; (2) core TC neurons forming specific, focused projections to the core PY neurons with cell bodies in layer VI (Jones 2002).
Figure 3. Schematic diagram of the anatomical structure of the thalamocortical network model used in this study.
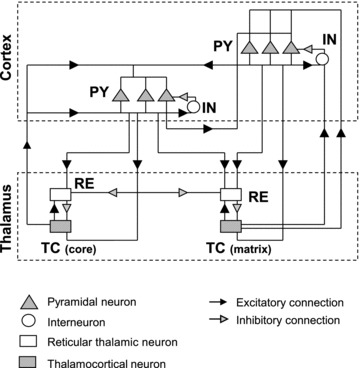
The model contains two populations of thalamocortical (TC) neurons representing the core and matrix subsystems respectively. Furthermore, a population of thalamic reticular (RE) neurons, two populations of cortical (PY) neurons and a population of interneurons (INs) were also included. The black arrowheads indicate excitatory connections and the grey arrowheads represent inhibitory connections. The thalamocortical and corticothalamic projections in the matrix pathway were made more expansive than in the core pathway. The widths of all connections are summarized in Table 1.
The thalamic reticular (RE) neurons were incorporated and interconnected with PY and TC neurons. Cortical layers included a population of inhibitory interneurons (INs) that received thalamocortical inputs from thalamic areas. The thalamocortical model was structured as a one-dimensional, multi-layer array of cells. Detailed network architecture is determined by the radius of network connections (listed in Table 1). The absolute values of synaptic connectivity radiuses were determined by the network size; to avoid limitations of ‘all-to-all’ connectivity, we limited connectivity by 5–20 cells in any direction so the system would be able to display complex spatio-temporal dynamics (e.g. propagating waves). We also tested larger one-dimensional network models where the radius of connection was proportionally scaled. The strength of individual synapses was also scaled to ensure that total synaptic strength per cell did not change. Finally, we tested two-dimensional networks with similar network topology. While detailed analysis of the 2D model was impractical because of the high computational cost, the results were consistent with data from a 1D model. In all cases, we tested the model dynamics for different connectivity patterns to ensure that our results were structurally stable – small changes of the model structure lead to small changes in the model dynamics.
Table 1.
Settings of the network connections
| Source cell | Target cell | Types of synapses | Connecting radius |
|---|---|---|---|
| PY (matrix) | PY (matrix) | AMPA (gAMPA = 0.156 μS; EAMPA = 0 mV) | 5 cells |
| NMDA (gNMDA = 0.013 μS; ENMDA = 0 mV) | |||
| PY (matrix) | IN | AMPA (gAMPA = 0.025 μS; EAMPA = 0 mV) | 1 cells |
| NMDA (gNMDA = 0.004 μS; ENMDA = 0 mV) | |||
| PY (matrix) | PY (core) | AMPA (gAMPA = 0.156 μS; EAMPA = 0 mV) | 5 cells |
| NMDA (gNMDA = 0.013 μS; ENMDA = 0 mV) | |||
| PY (matrix) | RE | AMPA (gAMPA = 0.05 μS; EAMPA = 0 mV) | 5 cells |
| PY (matrix) | TC (matrix) | AMPA (gAMPA = 0.025 μS; EAMPA = 0 mV) | 10 cells |
| PY (core) | PY (core) | AMPA (gAMPA = 0.156 μS; EAMPA = 0 mV) | 5 cells |
| NMDA (gNMDA = 0.013 μS; ENMDA = 0 mV) | |||
| PY (core) | IN | AMPA (gAMPA = 0.025 μS; EAMPA = 0 mV) | 1 cells |
| NMDA (gNMDA = 0.004 μS; ENMDA = 0 mV) | |||
| PY (core) | PY (matrix) | AMPA (gAMPA = 0.156 μS; EAMPA = 0 mV) | 5 cells |
| NMDA (gNMDA = 0.013 μS; ENMDA = 0 mV) | |||
| PY (core) | RE | AMPA (gAMPA = 0.05 μS; EAMPA = 0 mV) | 10 cells |
| PY (core) | TC (core) | AMPA (gAMPA = 0.025 μS; EAMPA = 0 mV) | 5 cells |
| IN | PY (matrix) | GABAA (gGABA−A = 0.25 μS; EGABA−A = −70 mV) | 5 cells |
| IN | PY (core) | GABAA (gGABA−A = 0.25 μS; EGABA−A = −70 mV) | 5 cells |
| TC (matrix) | PY (matrix) | AMPA (gAMPA = 0.09 μS; EAMPA = 0 mV) | 20 cells |
| TC (matrix) | IN | AMPA (gAMPA = 0.09 μS; EAMPA = 0 mV) | 2 cells |
| TC (matrix) | RE | AMPA (gAMPA = 0.4 μS; EAMPA = 0 mV) | 4 cells |
| TC (core) | PY (core) | AMPA (gAMPA = 0.09 μS; EAMPA = 0 mV) | 10 cells |
| TC (core) | IN | AMPA (gAMPA = 0.09 μS; EAMPA = 0 mV) | 2 cells |
| TC (core) | RE | AMPA (gAMPA = 0.4 μS; EAMPA = 0 mV) | 4 cells |
| RE | TC (matrix) | GABAA (gGABA−A = 0.15 μS; EGABA−A = −70 mV) | 4 cells |
| GABAB (gGABA−B = 0.04 μS; EGABA−B = −95 mV) | |||
| RE | TC (core) | GABAA (gGABA−A = 0.15 μS; EGABA−A = −70 mV) | 4 cells |
| GABAB (gGABA−B = 0.04 μS; EGABA−B = −95 mV) | |||
| RE | RE | GABAA (gGABA−A = 0.2 μS; EGABA−A = −70 mV) | 4 cells |
Intrinsic currents – thalamus
Single-compartment models were used to simulate spiking properties of TC and RE neurons. Each model neuron was characterized by Hodgkin–Huxley type kinetics described in the following equation:
| (1) |
where the membrane capacitance, Cm, is equal to 1 μF cm−2, non-specific (mixed Na+, K+, Cl−) leakage conductance, gleak, is equal to 0.01 mS cm−2 for TC cells and 0.05 mS cm−2 for RE cells, and the reversal potential, Eleak, is equal to −70 mV for TC cells and −77 mV for RE cells. Iint is the sum of active intrinsic currents, and Isyn is the sum of synaptic currents. The area of a RE cell and a TC cell was 1.43 × 10⁻⁴ cm2 and 2.9 × 10⁻⁴ cm2, respectively (Bazhenov et al. 2002).
Both RE and TC cells contain a fast sodium current, INa, a fast potassium current, IK (Traub & Miles, 1991), a low-threshold Ca2+ current IT (Huguenard & Prince, 1992; McCormick 1992), and a potassium leak current, IKL = gKL (V − EKL), where EKL = −95 mV. A hyperpolarization-activated cation current, Ih (McCormick & Pape, 1990), was also included in TC cells (Bazhenov et al. 1998). The Ih includes both voltage and Ca2+ dependencies (Destexhe et al. 1996) and is described by the following equation:
| (2) |
where k = 2 and Eh = −40 mV. The fraction of the channels in the closed, [C], opened, [O], and locked, [OL], states were calculated according to the kinetic equations (3) and (4) below:
| (3) |
where C and O indicate closed and opened states of a channel, and α(V) and β(V) are the voltage-dependent transition rates: α = h∞/τs, β = (1 −h∞)/τs, h∞ = 1/(1 + exp((V+ 75)/5.5)), τs = (20 + 1000/(exp((V+ 71.5)/14.2) + exp(−(V + 89)/11.6))). In addition, calcium dependence was based on higher order kinetics involving a regulation factor P. The binding of calcium molecules with an unbound form of the regulation factor, P0, leads to the bound form P1. Next, the bound form binds to the open state of channel that produces the locked state, OL:
| (4) |
where k1 = 2.5 × 107 mm−4, k2 = 4 × 10⁻⁴ ms−1, k3 = 0.1 ms−1, and k4 = 0.001 ms−1. Ca in eq (4) is calcium.
For both RE and TC cells, the calcium dynamics is described by a simple first order model (Destexhe et al. 1994):
| (5) |
where [Ca]∞ is 2.4 × 10⁻⁴ mm indicating equilibrium Ca2+ concentration, A = 5.18 × 10⁻⁵ mm cm2/(ms μA) and τ = 5 ms.
The dynamical models of all voltage- and Ca2+-dependent currents are given in Table 2. For TC cells, the maximal conductances are gK = 10 mS cm−2, gNa = 90 mS cm−2, gT = 2.2 mS cm−2, gh = 0.017 mS cm−2, gKL = 0.03 mS cm−2. For RE cells, the maximal conductances are gK = 10 mS cm−2, gNa = 100 mS cm−2, gT = 2.3 mS cm−2, gKL = 0.05 mS cm−2 (Bazhenov et al. 2002).
Table 2.
Dynamical models of intrinsic currents
| Cell | Current | Current dynamic | |
|---|---|---|---|
| RE | Fast sodium current INa | 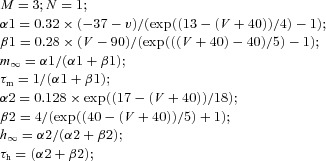 |
|
| Fast potassium current IK |  |
||
| Low threshold calcium current IT |  |
||
| Potassium leak current IKL |  |
||
| TC | Fast sodium current INa | 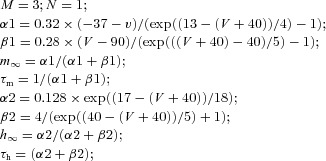 |
|
| Fast potassium current IK |  |
||
| Low threshold calcium current IT |  |
||
| Potassium A current IA |  |
||
| hyperpolarization-activated cation current Ih | 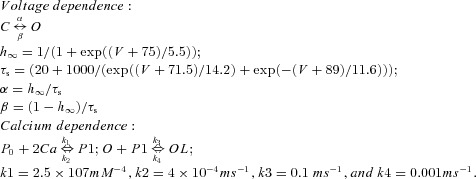 |
||
| Potassium leak current IKL |  |
||
| PY | (Dendrite) Fast sodium current INa | 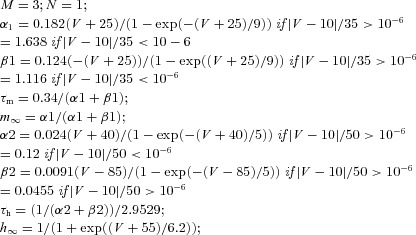 |
|
| (Dendrite) Persistent sodium current INa(p) |  |
||
| (Dendrite) Slow voltage-dependent noninactivating potassium current IKm |  |
||
| (Dendrite) Slow calcium-dependent potassium current IKCa |  |
||
| (Dendrite) High threshold calcium current IHVA | 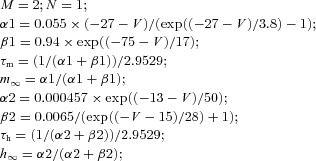 |
||
| (Dendritic) Potassium leak current IKL |  |
||
| (Axosomatic) Fast sodium current INa | 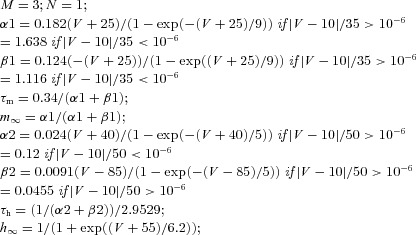 |
||
| (Axosomatic) Fast potassium current IK |  |
||
| (Axosomatic) Persistent sodium current INa(p) |  |
||
| IN | The intrinsic currents in IN have the same dynamics as those in PY except that INa(p) is not included. The ratio of dendritic area to axosomatic area was R = 165 for PY neuron and R = 50 for IN. | ||
The voltage-dependent ionic currents had the general form I = gmM hN (V−E) where g is the maximal conductance, m(t) is the activation variable, h(t) is the inactivation variable, and (V−E) is the driving force. The gating variables, m(t) and h(t), follow:  .
.
Intrinsic currents – cortex
Cortical pyramidal (PY) cells and interneurons (INs) were described previously by two electrically coupled compartments (Mainen & Sejnowski, 1996; Timofeev et al. 2000a; Bazhenov et al. 2002):
 |
(6) |
where Cm is the membrane capacitance, gleak is the leakage conductance of the dendritic compartment, Eleak is the reversal potential, VD and VS are the membrane potentials of dendritic and axosomatic compartments, IDint and ISint are the sums of active intrinsic currents in dendritic and axosomatic compartments, Isyn is the sum of synaptic currents, and g is the conductance between axosomatic and dendritic compartments. This model was first proposed in (Mainen & Sejnowski, 1996) as a reduction of a multi-compartmental pyramidal cell model, based on the assumption that the current dynamics in axosomatic compartment are fast enough to ensure that VS is always at equilibrium state, as defined by the second equation (6). Indeed, this reduced model has relatively high Na+ and K+ conductance values (gNa = 3000 mS cm−2, gK = 200 mS cm−2; Mainen & Sejnowski, 1996) in the axosomatic compartment (representing axon hillock in the model). Therefore, the full version of the axosomatic membrane voltage equation CdVs/dt = −g(VS−VD) −ISint can be rewritten in a form ɛdVs/dt = F(Vs), where ɛ is a small parameter and F(Vs) represents axosomatic currents normalized to match the magnitude of the dendritic currents. Using singular perturbations analysis (Kuznetsov, 1995), we find that the state variable Vs quickly reaches the manifold of slow motion defined by equation F(Vs) = 0, that corresponds to equation (6) in our model. Through bifurcation analysis (M. Bazhenov, unpublished), it was shown that the bifurcation structure of the reduced model (see, e.g. Fig. 3 in Frohlich & Bazhenov, 2006 for similar analysis) is equivalent to the full model, without losing the accuracy of simulation. Furthermore, because of the high conductance values in the axosomatic compartment, numerical stability of simulation with a full model requires very small integration steps (of the order of 1/ɛ or less than 0.0002 ms) that make network simulation impractical. On the other hand, a reduced model allows for the use of a larger integration time step; dt = 0.02 ms in all simulations. This reduced model can closely match spiking patterns of different classes of cells (Mainen & Sejnowski, 1996; see Fig. 4C in Mainen & Sejnowski (1996) for voltage trace of a regular-spiking pyramidal cell) and has been successfully used in many cortical network simulations (Timofeev et al. 2000a; Bazhenov et al. 2002; Frohlich et al. 2008, 2010).
Figure 4. Alternation of active and silent states during slow oscillation in the thalamocortical network model.
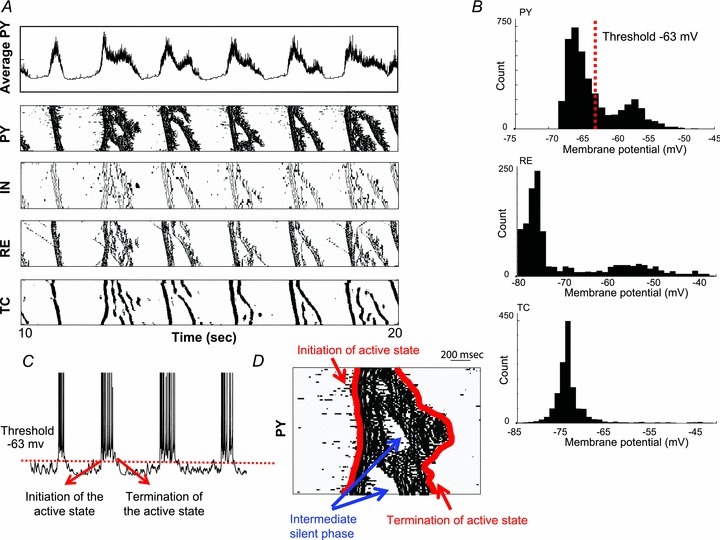
A, representative trace of the average activity of all pyramidal neurons in the core subsytem (top) and the rastergrams of activity in different cell populations during 10 s of simulation. For each raster plot, the x-axis indicates time and the y-axis indicates cell index. Six spontaneous cycles of active and silent states were observed (frequency of oscillation ∼0.6 Hz). B, distributions of the membrane potential acquired from the entire population of PY (top), RE (middle) and TC (bottom) neurons during slow oscillation are displayed. The distributions obtained from PY and RE neurons show two peaks representing the activity during active and silent states respectively. On the other hand, the distribution obtained from TC neurons is unimodal. C, the timing of initiation/termination of an active state is defined as the time when the membrane potential of individual PY neurons crossed the threshold (−63 mv) that was selected between the two peaks of membrane potential distribution in B. D, definition of initiation and termination times of the active state is illustrated here. If the short-lasting hyperpolarizing period appeared in the middle of an active state, the termination time of an active state was defined at the end of this wave, and the short and intermediate silent phases were ignored.
The model contained fast Na+ current, INa, with a higher density in the axosomatic compartment than in the dendritic compartment. In addition, a fast-delayed rectifier potassium K+ current, IK, was present in the axosomatic compartment. A persistent sodium current, INa(p), was included in both the axosomatic and dendritic compartments (Alzheimer et al. 1993; Kay et al. 1998). A slow voltage-dependent, non-inactivating K+ current, IKm, a slow Ca2+-dependent K+ current, IKCa, a high-threshold Ca2+ current, IHVA, and a potassium leak current, IKL = gKL(V – EKL), were included in the dendritic compartment. The expressions for the voltage- and Ca2+-dependent transition rates for all currents are given in Timofeev et al. (2000a). The maximal conductances and passive properties were Ssoma = 1.0 × 10⁻⁶ cm2, gNa = 3000 mS cm−2, gK = 200 mS cm−2, gNa(p) = 0.07 mS cm−2 for the axosomatic compartment, Cm = 0.75 μF cm−2, gL = 0.033 mS cm−2, gKL = 0.0025 mS cm−2, Sdend = Ssomar, gHVA = 0.01 mS cm−2, gNa = 1.5 mS cm−2, gKCa = 0.3 mS cm−2, gKm = 0.01 mS cm−2, and gNa(p) = 0.07 mS cm−2 for the dendritic compartment, EKL = −95 mV and Eleak = −68 mV for PY neurons and Eleak = −75 mV for the INs (Bazhenov et al. 2002). For interneurons, gNa = 2500 mS cm−2. In addition, the INa(p) was not included in the interneurons. The resistance between compartments was r = 10 MΩ.
The firing properties of the model in equation (2) depend on the coupling conductance between compartments (g = 1/r) and the ratio of dendritic area to axosomatic area R (Mainen & Sejnowski 1996). We used a model of a regular-spiking neuron for PY cells (R = 165) and a model of a fast-spiking neuron for INs (R = 50). The dynamical models of all voltage- and Ca2+-dependent currents are given in Table 2.
Synaptic currents
GABAA, NMDA and AMPA synaptic currents were modelled by first-order activation schemes (Galarreta & Hestrin, 1998). Dependence of postsynaptic voltage for NMDA receptors was 1/(1 + exp(Vpost−Vth)/σ)), where Vth = −25 mV, σ = 12.5 mV (Traub & Miles, 1991; Destexhe et al. 1994; Golomb & Amitai, 1997). GABAB receptors were modelled by a higher-order reaction scheme that took into account the activation of K+ channels by G-proteins (Dutar & Nicoll, 1988; Destexhe et al. 1994; Destexhe et al. 1996). All synaptic currents were calculated according to:
| (7) |
where gsyn is the maximal conductivity, [O] is the fraction of open channels, and Esyn is the reversal potential. In RE and PY cells, reversal potential is 0 mV for AMPA and NMDA receptors, and −70 mV for GABAA receptors. For TC cells, the reversal potential is −80 mV for GABAA receptors (Ulrich & Huguenard, 1997). The fraction of open channels [O] is calculated according to the equation (8):
| (8) |
where θ(x) is the Heaviside function and t0 is the time of receptor activation. The parameters for the neurotransmitter pulse were amplitude A = 0.5 and duration tmax = 0.3 ms. The rate constants were α = 1.1 ms and β = 0.19 ms for AMPA receptors, α = 1 ms and β = 0.0067 ms for NMDA receptors, and α = 0.53 ms and β = 0.18 ms for GABAA receptors. GABAB synaptic current is given by equation (9) (Destexhe et al. 1996):
 |
(9) |
where [R](t) is the fraction of activated receptors, [G](t) is the concentration of G proteins, and Ek = − 95 mV is the potassium reverse potential. The rate constants were r1 = 0.5 mm−1 ms−1, r2 = 0.0012 ms−1, r3 = 0.1 ms−1, r4 = 0.034 ms−1, and K = 100 μm4.
A simple phenomenological model characterizing short-term depression of intracortical excitatory connections (Abbott et al. 1997; Tsodyks & Markram, 1997; Galarreta & Hestrin, 1998; Timofeev et al. 2000a) was also included in the current model. According to this model, maximal synaptic conductance was multiplied by the depression variable, D, which represents the amount of available synaptic resources. Here, D = 1 − (1 −Di (1 −U)) exp (−(t−ti)/τ), where U = 0.2 is the fraction of resources used per action potential, τ = 500 ms is the time constant of recovery of synaptic resources, Di is the value of D immediately before the ith event, and (t−ti) is the time after the ith event.
The maximal conductances for each receptor type were gAMPA(PY−PY) = 0.156 μS, gNMDA(PY−PY) = 0.013 μS, gAMPA(PY−TC) = 0.025 μS, gAMPA(PY−RE) = 0.05 μS, gAMPA(TC−PY) = 0.09 μS, gAMPA(PY−IN) = 0.025 μS, gNMDA(PY−IN) = 0.004 μS, gGABA−A(IN−PY) = 0.25 μS, gAMPA(TC−IN) = 0.09 μS, gGABA−A(RE−RE) = 0.2 μS, gGABA−A(RE−TC) = 0.15 μS, gGABA−B(RE−TC) = 0.04 μS, and gAMPA(TC−RE) = 0.4 μS (Bazhenov et al. 2002).
Spontaneous miniature excitatory postsynaptic potentials (EPSPs) and inhibitory postsynaptic potentials (IPSPs) were simulated by the same equations as the regular PSPs, and their arrival times followed the Poisson process (Stevens 1993), with time-dependent mean rate μ = k× log((t−t0+T)/τ), where t is time in milliseconds and t0 is the time instant of the last presynaptic spike (Timofeev et al. 2000a), the time shift T = 50 ms was introduced to ensure that no minis are generated right after the last spike, τ = 50 ms, k = 2.5 Hz. The miniature EPSPs and IPSPs amplitude was ∼0.75 mV.
Evaluating the degree of synchronization
In order to detect state transitions during slow oscillation, a threshold of −63 mV was selected. In accordance with the distribution of membrane potential, this threshold is located between the two peaks representing the active states and the silent states, respectively (see Fig. 4B). Thus, the initiation (termination) of active state is identified as the moment when traces of the membrane potential crossed the threshold upward (downward). In a rastergram, each active state is recognized as an individual wave. If short-lasting hyperpolarization appeared in the middle of an active wave (recognized as a branching strip in a rastergram), the termination of this active state was defined at the end of this wave, and the short and intermediate silent phases were ignored (see Fig. 4D). After the onset and offset times of each active state were identified in each PY, the cluster mean time of transition of each onset and offset across whole populations of PY neurons was calculated. Then, in each wave, the relative time difference between onset or offset time in each PY neuron to the cluster mean time of transition could be found. Finally, based on 30 consecutive waves in each run of simulation, the distribution of the time difference of initiation/termination of active states across entire populations of PY neurons was acquired. The standard deviation of this distribution was then used to quantify the level of synchronization during state transition. A smaller standard deviation (indicating a smaller time difference) thus implies a more synchronous transition across the pyramidal cells.
Results
Active state termination is more synchronous than active state initiation in vivo
We previously reported that termination of active states in vivo was more synchronous across populations of neocortical neurons than active state initiation during slow oscillation in anaesthetized cats (Volgushev et al. 2006). Figure 1 shows a representative example of local field potential (LFP) and four simultaneous intracellular recordings during multiple cycles of slow oscillation in anaesthetized cats (see Methods for details). The data set used in this analysis is different from the one used in a previous study (Volgushev et al. 2006), where only distant recordings were used for analysis. In the current study, the recordings are a mixture of closely located neurons (<0.3 mm in lateral distance) and distant neurons (approximately 8 mm between recording sites). A sigmoid curve was used to fit each transition from active to silent state and also from silent to active state (not shown; similar to Chauvette et al. 2010). The time at half-amplitude was used as the time of transition. For every cycle, transition time was calculated for all four neurons, and the group mean, defined as mean cluster time of transition, was calculated. When the mean cluster time of transitions was set as time zero, for each neuron, delays to the mean cluster time in each cycle were calculated. According to Fig. 1D, it was noticed that the standard deviation of these delays was larger for the upward (from silent to active states) transitions than for the downward transitions. This result confirms our previous reports (Volgushev et al. 2006), and suggests the existence of a global network mechanism controlling the termination of active states across large populations of cortical neurons. We also recorded inhibitory interneurons simultaneously with pyramidal cells and found that they all behave similarly with identical upward and downward transition patterns during slow oscillation.
It is important to note that the results in Fig. 1C–E indicate a higher reliability of downward transitions in individual recorded neurons. We then extended statistical analysis to include all four neurons. We found that the standard deviation (SD) of downward transitions in all four cells across multiple cycles was 14.93 ± 10.13, and the SD of upward transitions was 28.98 ± 23.39 (P = 0.089). The ‘absolute distance’ to the cluster mean time was 43.12 ± 29.83 ms for active-to-silent transitions, and 90.92 ± 79.16 ms for silent-to-active transitions (P = 0.063). These results confirmed a higher population synchrony at active state termination.
Blocking the inhibitory connections shortens the duration of spontaneous active states
To explore the possible role of synaptic inhibition during active state termination, we performed a set of in vivo experiments in isolated neocortical slabs. Similar to the intact neocortex, slab activity is characterized by alternation between active and silent states. The active states in the slab carry many essential similarities with active states occurring during the natural sleep slow oscillation (Timofeev et al. 2000a). On the other hand, periods of silence are usually longer and variable in the slab. A relatively small slab size allows for a better control of distribution of GABAA antagonists, which would be impossible in the intact thalamocortical network in vivo. Therefore, we used this slab preparation to investigate network dynamics in the extreme case of a complete blockage of inhibition (see Fig. 2).
Figure 2. Comparison of the duration of the active state under normal conditions (control) and a condition when GABAA receptors were blocked by the application of bicuculline in an isolated cortical slab in vivo.
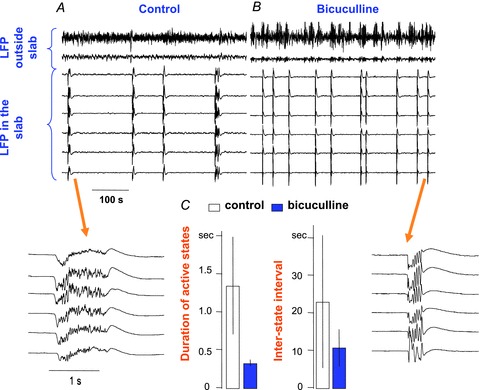
Two segments of 8 LFP recordings are displayed (6 in a cortical slab, 2 in the intact cortex) in A (control conditions) and B (after the application of bicuculline). Compared to controls, active state was much shorter when inhibition was blocked. C, mean (bar) and standard deviation (line) of the duration of the active state (left panel) and silent state (right panel) in the control conditions (open bars) and in the presence of bicuculline (filled bars) are shown. After inhibition was blocked by the application of bicuculline, both the active and silent states became shorter (P value <0.0001). Interstate interval was also significantly reduced in the presence of bicuculline (P value = 0.0064) (both statistics from an unpaired t test with Welch's correction).
Consistent with previous findings, slabs in the control condition were mainly silent (Timofeev et al. 2000b; Crochet et al. 2006). On average, we observed three active periods per minute, but the time between active periods varied considerably as indicated by a large standard deviation in Fig. 2C. The duration of active states varied between 0.7 s and 3 s, with the mean around 1.4 ± 0.66 s, similar to active states of regular sleep slow oscillation (Steriade et al. 1993a,b; Volgushev et al. 2006). One hour after injection of bicuculline, a GABAA-receptor blocker, the number of active periods increased to about 10 per minute. At the same time, they become more periodic, as evidenced by a decreased standard deviation of inter-state intervals (Fig. 2C). Following bicuculline injection, the duration of active states significantly decreased and was always situated between 0.2 and 0.3 s (Fig. 2B and C). These results are in agreement with recent in vitro studies (Mann et al. 2009; Sanchez-Vives et al. 2010); however, application of bicuculline in vitro only slightly changed the frequency of Up–Down cycles. A possible explanation is that in the slice (Sanchez-Vives et al. 2010), the frequency of slow oscillation was higher than that in the slab before bicuculline injection and was already close to the frequency of slow oscillation in the intact cortex in vivo. The synchrony of active state termination was improved in the slab following bicuculline injection. The standard deviation of UP–Down transition was 48.28 ± 39.76 in control slab; 22.76 ± 11.98 in the presence of bicuculline (significantly different: P = 0.0021 of two-tailed unpaired t test with Welch's correction).
To further characterize the potential role of interneuron-mediated inhibition in regulating slow oscillation, a conductance-based thalamocortical network model was used. Our modelling results are presented below.
Periodical alternation between active and silent states in the thalamocortical network resembles sleep slow oscillation
The architecture of a large scale thalamocortical network model used in the current study is illustrated in Fig. 3. It includes main distinct but interconnected thalamocortical pathways based on observation of non-human primates (Jones 2002): (i) the core pathway, in which the thalamic efferents project to the middle layers of the cortex (mostly to layers III and IV), and (ii) the matrix pathway, which has thalamic afferents to superficial layers of the cortex (mainly to layer I) where they make connections with apical dendrites of layer V cells. The matrix thalamocortical pathway has more diffuse connections than the core pathway, the latter being more topologically compact and specific (Jones 2002; see Table 1). In Fig. 4A, a trace of the average membrane voltage of all PY neurons in the core subsystem and rastergrams including the entire population of cortical and thalamic neurons are shown. The patterns of activity in the matrix subsystems were very similar to the patterns in the core subsystem and we have only shown the results of the core subsystem here. During 10 s of simulation under the baseline setting, this thalamocortical network displayed six self-regulating cycles of state transitions. The frequency of this oscillation was about 0.6 Hz, with an active state lasting around 400 ms and a silent state lasting nearly 1000 ms.
In this model, slow oscillation is driven by intracortical dynamics. Spontaneous summation of miniature EPSPs through AMPA-mediated synapses among pyramidal neurons (see Methods) triggered Na+ spikes in some (randomly located) PY neurons, which then initiated spikes in their postsynaptic neighbours (Timofeev et al. 2000a; Bazhenov et al. 2002). Thus, the level of synchronization at the initiation of an active state depended on how many PY neurons generated an initial Na+ spike within the same short time window, how close these neurons were located within the network and, to a large extent, how fast the signals were propagated within the network. The spread of activity within a cortical layer and between cortical layers was mediated by the lateral excitatory connections, which limited the degree of synchronization at active state onset.
During slow oscillation, cortical pyramidal neurons exhibited a bimodal distribution of membrane voltage with peaks appearing around –57 mV (active state) and −67 mV (silent state) (Fig. 4B, top). In order to identify the transition between active and silent states, a threshold of membrane voltage at −63 mV was selected (Fig. 4C; see Methods for details). If short-lasting hyperpolarization appeared in the middle of an active state (see Fig. 4D), the termination of active state was defined at the end of this wave, and the short and intermediate silent phases (identified based on the analysis of the entire spatio-temporal pattern of the network activity) were ignored. In the thalamus, the correlative alternations between active and silent phases of the slow oscillation were also observed across populations of RE cells and TC cells. RE cells were strongly depolarized by corticothalamic inputs and fired action potentials during active states. During silent states, they were hyperpolarized and quiet (Fig. 4B, middle). In this thalamocortical network model, TC cells displayed a superposition of cortical EPSPs and RE-mediated IPSPs, and usually generated only a few action potentials near the onset of an active state. TC cells showed a unimodal distribution of membrane voltages (see Fig. 4B, bottom). In addition, two thalamic populations, core and matrix, were found to be synchronized. This baseline setting captured many essential properties of sleep slow activity (Contreras & Steriade, 1995; Timofeev & Steriade, 1996); however, the downward transition in this setting is much more diverse compared to the data observed in in vivo experiment (see Fig. 1). We intentionally used this setup as a baseline model since it matches our previous modelling studies of slow oscillation (Timofeev et al. 2000a; Bazhenov et al. 2002). This diverse downward transition can be improved as the strength of feedback inhibition is changed in the following modelling experiments.
Increase of interneuron excitability enhances the synchrony of active state termination
To explore the possible role of interneuron-mediated inhibition in manipulating the spatio-temporal patterns of slow oscillation, we altered the intrinsic excitability of INs as well as the strength of synaptic connectivity mediating feedback inhibition (Stopfer & Bazhenov, 2010) from INs to PY neurons. First, we tested whether the levels of excitability in INs affected the pattern of slow oscillation. The control of excitability was achieved by altering the non-specific leak currents in INs. When leak reversal potential was relatively depolarized, IN resting potential became closer to the threshold for spike generation and made these INs more excitable. Conversely, making the leak reversal potential more negative led to hyperpolarization and low excitability in INs. With this approach, the input resistance of INs remained largely unchanged. The plots at the top of Fig. 5A show slow oscillation with shorter active states and more synchronous downward transition when INs were relatively depolarized. In contrast, at the bottom of Fig. 5A, when INs were relatively hyperpolarized, the length of active states became longer and the timing of downward transitions across PY neurons became highly diverse. Further hyperpolarization of INs (below −80 mV) drastically reduced IN activities and caused the entire population of PY neurons to fire continuously (not shown; see Fig. 7).
Figure 5. Impact of interneuron excitability on the level of synchronization of state transition during slow oscillation.
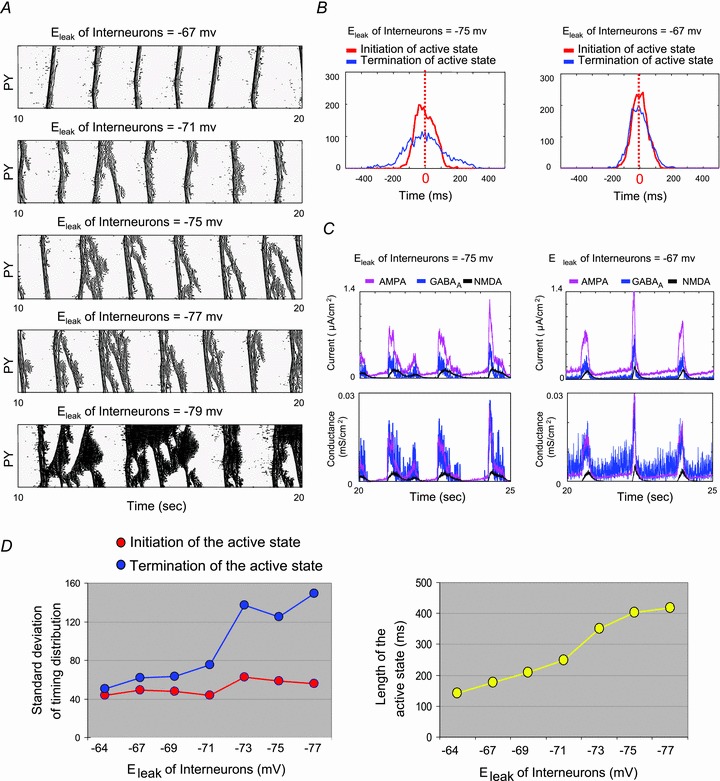
A, rastergrams of the network activity across a population of PY neurons were plotted under five different settings of equilibrium potentials of the non-specific leak current (Eleak) in inhibitory interneurons. When interneurons were more excitable (more positive value of Eleak), active states became shorter and the termination of active states became more synchronous across cell ensembles. B, the level of synchronization during a state transition is further evaluated by plotting the distribution of the times when state transitions occur across a population of pyramidal neurons (left panel: Eleak of interneurons is −75 mV; right panel: Eleak of interneurons is −67 mV). The red line indicates the distribution of upward transition, while the blue line shows the distribution of downward transition. The synchronous level of downward transitions (blue line) significantly improved as the interneurons became more excitable. C, the traces of synaptic currents (top panel) and the corresponding synaptic conductances (bottom panel), including AMPA, GABAA and NMDA, during 5 s of simulation are displayed. The traces on the right were obtained from a simulation setting in which the interneurons were more excitable (Eleak of interneurons = −67 mv) compared to the traces on the left (Eleak of interneurons = −75 mv). D, the standard deviation of the timing distributions (upward and downward transitions) under different settings of interneuron excitability is summarized in a plot (left). The synchronous level of upward transition stayed constant regardless the levels of interneuron excitability (red line). On the other hand, the synchronous level of downward transition was significantly enhanced (smaller values of standard deviation) when the interneurons became more excitable. Furthermore, the average duration of active states was found to be shorter as the interneurons became more excitable (right plot).
Figure 7. Influence of excitatory and inhibitory synaptic strength on the duration of active states during slow oscillation.
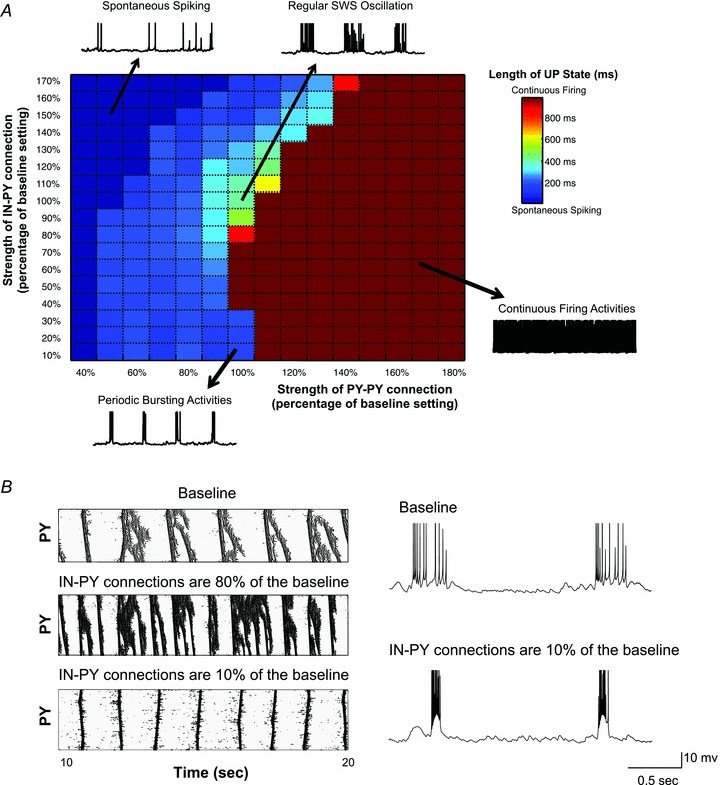
A, the average length of active states is plotted based on different combinations of the strength of the intracortical excitatory (PY→PY) and inhibitory (IN→PY) connections. Sample traces of the PY neuron membrane potential illustrate typical examples of PY activity (e.g. spontaneous spiking, periodic bursting, regular slow oscillation, continuous firing). Colour bar indicates the average length of active states. B, the rastergrams and representative traces of the PY neuron membrane voltage were obtained from simulations with different strengths of the IN–PY neuron connection. Short and bursting activity appeared when the strength of the IN–PY neuron connection was significantly reduced (10% of the baseline in this case).
To quantify the level of synchronization of state transition across the entire population of PY neurons, we calculated the timing of onsets and offsets of active states in all PY neurons by setting a membrane potential threshold at −63 mV (Fig. 4C and D). The results accumulating from 30 consecutive oscillatory cycles are presented as a distribution in Fig. 5B. When INs were relatively hyperpolarized (Fig. 5B, left), the distribution of the onset times across all PY cells (red line) was significantly narrower than the distribution of the offset times (blue line). Increasing leak reversal potential of INs to −67 mV did not affect the distribution of onset times, but did significantly reduce the width of the distribution of offset times (Fig. 5B, right). This effect was simply induced by a higher level of excitability in INs.
Figure 5C shows representative traces of synaptic currents (top) and conductance (bottom) during simulations with different levels of interneuron excitability. In all simulation settings, GABAA conductance exceeded AMPA conductance during active states (Fig. 5C, bottom) in agreement with previous in vivo recording data (Rudolph et al. 2007). Due to the difference in driving force (V–EAMPA vs. V−EGABAA), the average amplitude of the AMPA-mediated currents was larger than the amplitude of GABAA-mediated currents for the majority of the time (Fig. 5C, top). At the beginning of an active state, both currents (AMPA and GABAA) increased immediately and nearly simultaneously. After reaching the peak, the decay pattern of these two currents became different in two simulation settings with different IN excitability. When INs were more excitable (Fig. 5C, right), both currents decayed rapidly and reached their lowest point nearly simultaneously close to the end of an active state. On the other hand, when interneuron excitability was reduced (Fig. 5C, left), the decay time of excitatory currents was longer than that of inhibitory currents and synaptic excitation dominated over synaptic inhibition until the very end of an active state.
The overall impact of interneuron excitability on the level of synchronization of state transition is summarized in Fig. 5D. In general, the level of synchrony at upward transition stayed constant, regardless of the changes of interneuron excitability. Nevertheless, the level of synchrony at downward transition improved dramatically as interneurons became more excitable, and eventually reached the level close to that of the upward transition (the setting of Eleak = −64 mV in Fig. 5D). In addition, the length of active states became shorter and the length of silent states became longer as the interneurons’ excitability increased (Fig. 5A and D, right).
Increasing the strength and radius of PY neuron–IN connections enhances synchrony of active state termination
Next, we investigated the impact of the strength of PY neuron–IN connection on the level of synchronization of downward transition. First, increasing the strength of AMPA-mediated conductance from PY neurons to INs caused higher firing rates of interneurons during active states. As a result, stronger inhibition was sent back to PY neurons and produced an effect similar to an increase in excitability of interneurons. In Fig. 6A, four rastergrams acquired from four different runs of simulation with different strengths of PY neuron–IN connection (a baseline setting, and three additional settings with the strength of PY neuron–IN increased by 20%, 40% and 80% from the baseline setting) are displayed. The frequencies of slow oscillation are similar (0.6–0.7 Hz) in all four settings. However, as the synaptic strength of PY neuron–IN connection was increased, the length of active states and the degree of branching (appearance of short-lasting hyperpolarization events in the middle of an active wave) in each oscillatory cycle were reduced. In Fig. 6B, the level of the synchronous state transition was further evaluated by the distributions of the onset and the offset times across entire populations of PY neurons. We found that the synchrony of downward transition was clearly improved by strengthening connections from PY neurons to INs. In Fig. 6C, the rastergrams of the network activity, the traces of synaptic currents (AMPA, NMDA, GABAA), the ratio between fast inhibitory and excitatory currents (GABAA/AMPA), and the synaptic conductances are plotted. Consistent with our previous results, a higher ratio of GABAA/AMPA currents was maintained throughout an entire active state, especially when the strength of PY neuron–IN connections was increased. This suggests that the presence of inhibition, particularly near the offset of an active state, can be an important factor in explaining high synchrony of downward transition observed from in vivo recordings.
Figure 6. Impact of the strength and radius of PY neuron–IN connections on synchrony of downward transitions during sleep slow oscillation.
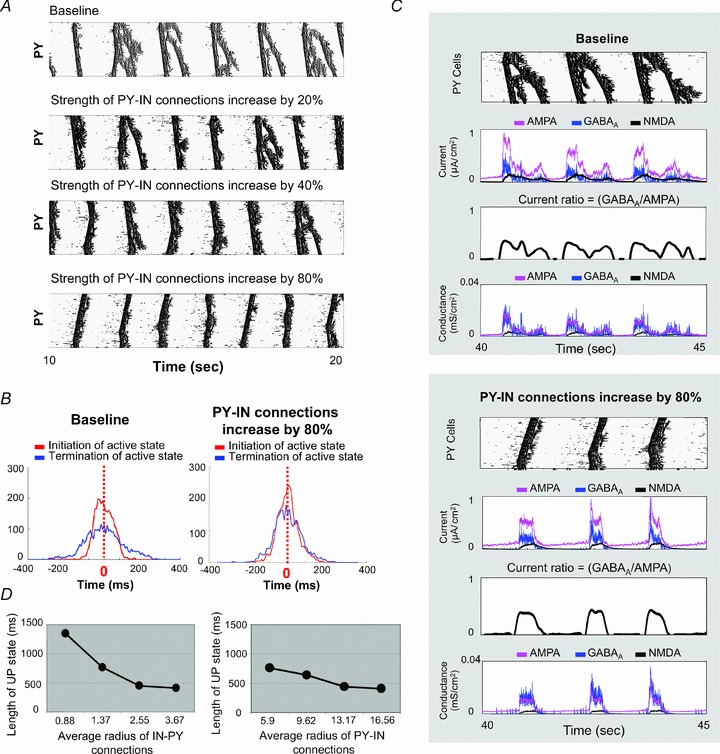
A, four rastergrams acquired from simulations with different strength of PY neuron–IN connection (baseline, and increasing to 20%, 40% and 80% above the baseline). B, distributions of initiation and termination times of active state are displayed. Increasing the strength of PY neuron–IN improved the degree of synchrony of the downward transition (blue line) that approached the level of synchronization of the upward transition (red line). C, the rastergrams of PY activity, the traces of synaptic currents, the ratio of GABAA/AMPA, and the traces of synaptic conductances are plotted here. When the strength of PY neuron–IN connections was increased, the ratio GABAA/AMPA remained high till the end of active state. D, dependence of the duration of active state on the average width of IN–PY neuron or PY neuron–IN connections is shown.
Further analysis of the impact of interneuron-mediated inhibition on slow oscillation was done by varying the width of IN–PY neuron or PY neuron–IN connection (Fig. 6D). Increasing the radius of the IN–PY neuron connections (implying how many INs project to single PY neuron on average) reduced the length of active states and also improved the synchrony of downward transition (Fig. 6D, left). Similar results were found when the average radius of PY neuron–IN connection (implying how many PY neurons project to single IN on average) was increased from 5.9 cells to 16.56 cells (Fig. 6D, right).
Effect of blocking IN–PY neuron inhibition in the model
Our model predicts that a sufficient level of synaptic inhibition is required to explain the high degree of synchrony of downward transition during slow oscillation. To realize the impact of complete blockage of synaptic inhibition on slow oscillation and to compare simulating results with experimental data involving bicuculline injection, we systematically varied the synaptic strength from INs to PY neurons in the model. We found that the effect of alternating IN–PY neuron GABAA type connection highly depends on the strength of excitatory PY neuron–PY neuron connection (Fig. 7A). For weak PY neuron–PY neuron connection, the cortical network displayed spontaneous spikes and an active state cannot be initiated regardless the strength of IN–PY neuron connection (Fig. 7A, dark blue). Increasing the strength of PY neuron–PY neuron connection led to initiation of active states toward a regular pattern of slow oscillation, but only when synaptic excitation in the network was balanced by the inhibition (Fig. 7A, light colours). Further increase of synaptic excitation reduced the chance of periodic transition to silence and, eventually, led the entire cortical network to continuously fire (Fig. 7A, dark red).
In agreement with our earlier results (Figs 5 and 6), for a range of PY neuron–PY neuron connection strength (e.g. 100% in Fig. 7A), reducing the strength of feedback synaptic inhibition first led to an increase of active state duration (e.g. comparing gIN−PY = 150% and gIN−PY = 100% among the range of gPY−PY = 60%–100% in Fig. 7A). However, a further reduction of synaptic inhibition shortened active state duration (e.g. comparing gIN−PY = 100% and gIN−PY = 20% in Fig. 7A). In the latter case, regular active states were replaced by intense bursting, suggesting that different termination mechanisms may be involved (Fig. 7B). These bursts were characterized by short duration and high-frequency spiking and resembled paroxysmal bursting after blockage of synaptic inhibition in vivo (see Fig. 2) or in vitro (see Mann et al. 2009; Sanchez-Vives et al. 2010).
To reveal the mechanisms controlling active state termination after synaptic inhibition was blocked, in Fig. 8A, traces of intrinsic currents under two different settings of synaptic strength of IN–PY neuron are compared to each other. This showed that the high-threshold Ca2+ current, IHVA, and voltage-dependent K+ current, IKm, reached a much higher level when the strength of IN–PY neuron was decreased to 10% of the baseline. In addition, the slow Ca2+-dependent K+ current, IKCa, was found to have a larger amplitude and shorter rising time to reach the peak. Indeed, a blockage of synaptic inhibition to PY neurons caused a dramatic increase of PY neuron firing frequency at the very beginning of an active state (see Fig. 7B). These high frequency activities led to an increase in intracellular Ca2+ concentration and a fast activation of Ca2+-dependent K+ currents, which then hyperpolarized PY neurons and immediately terminated an active state. To verify this point, we have tested the effect of alternating the Ca2+-dependent K+ conductance on the network dynamics (Fig. 8B). When Ca2+-dependent K+ current was small in the network with weak IN–PY neuron inhibition, periodic bursting was replaced by continuous firing and the cortical network was not able to switch to a silent state (Fig. 8B, right). In contrast, in the model with strong IN–PY neuron inhibition, reducing the strength of the Ca2+-dependent K+ current increased active state duration, but transitions from active state to silent state can still be observed even when gKCa was fully blocked (Fig. 8B, left, gKCa = 0). Thus, when the synaptic inhibition (gIN−PY) was weak, the mechanism of intrinsic inhibition (gKCa) played a major role in terminating bursting activities.
Figure 8. Effect of intrinsic hyperpolarizing currents on active state duration and termination.
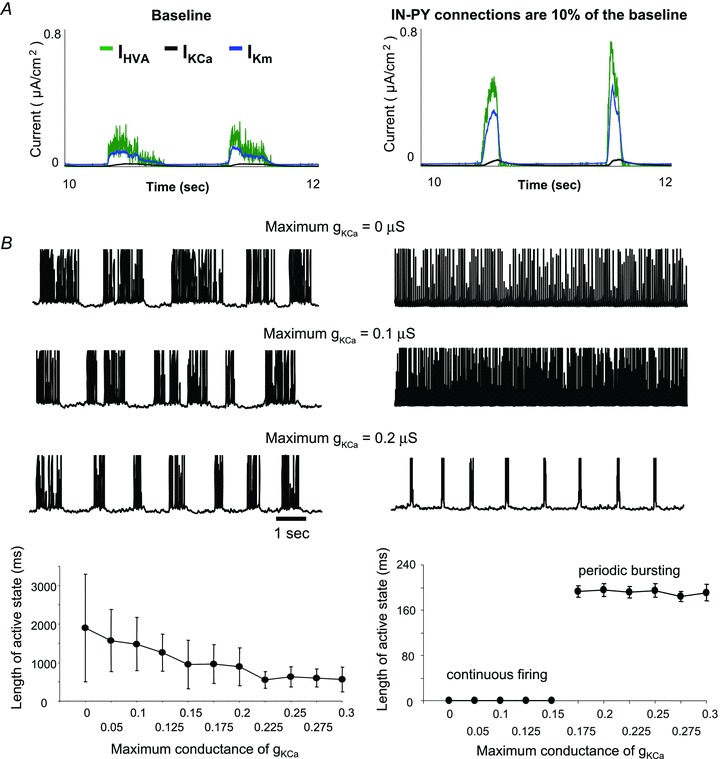
A, traces of intrinsic currents, including a high threshold Ca2+ current (IHVA), a Ca2+-dependent K+ current (IKCa) and a slow voltage-dependent K+ current (IKm), were obtained from simulations with two different settings of synaptic inhibition (baseline or 10% of the baseline). When the strength of inhibitory connections was reduced by 90%, PY neurons showed a high spiking rate during active states. This caused an instant rise in the voltage- and Ca2+-dependent K+ currents and an immediate termination of active state. B, representative membrane voltage traces (top) and a summary of the duration of active state as a function of Ca2+-dependent K+ conductance, gKCa, (bottom) for two different settings of synaptic inhibition are shown here. Under weak IN–PY neuron connection setting (right column), decreasing the strength of gKCa prevented bursting activity in PY neurons and led to continuous firing.
Discussion
Previous studies have suggested that the initiation of active states of sleep slow oscillation may involve several mechanisms including the summation of spontaneous transmitter release in excitatory synapses of the neocortex (Timofeev et al. 2000a; Bazhenov et al. 2002; Chauvette et al. 2010), spontaneous activity of some pyramidal neurons remaining active during the silent states of slow oscillation (Sanchez-Vives & McCormick, 2000; Compte et al. 2003), self-sustained asynchronous irregular activity in layer V (Destexhe 2009), or intrinsic oscillatory mechanisms in thalamocortical neurons (Hughes et al. 2002; Crunelli & Hughes 2010). In the current study, we further investigated the role of intrinsic and synaptic inhibition in manipulating sleep slow oscillation, particularly focusing on their contribution in terminating active cortical states.
Using a detailed computational model of the thalamocortical network, we revealed the complementary role of synaptic and intrinsic inhibition in controlling active states during slow oscillation. In normal physiological conditions, when fast synaptic inhibition was sufficiently strong, it limited the firing rates of pyramidal neurons during active states and therefore confined the level of activation of intrinsic inhibitory conductances. In this condition, synaptic inhibition played a major role in terminating active cortical states. Strong synaptic inhibition (mediated by the strength of PY→IN→PY connections and the level of excitability of inhibitory interneurons) was necessary to synchronize downward transitions during sleep slow oscillation. A small decrease in synaptic inhibition led to an increase in the duration of active states and broke the regular spatio-temporal patterns of slow oscillation. However, when fast synaptic inhibition was significantly reduced, the intrinsic hyperpolarizing conductances took over the role of synaptic inhibition in controlling active state duration. High firing rate of pyramidal cells led to the fast activation of intrinsic hyperpolarizing conductances and rapid termination of an active state. Network activity thus appeared in the form of synchronous short and high-frequency bursts across all cortical neurons.
Synaptic inhibition and synchrony of state transitions during slow oscillation
The results of our modelling study explain experimental observations acquired from the intact cortex (Fig. 1 and Volgushev et al. 2006). Using simultaneous multisite intracellular recordings in anaesthetized cats, it was found that both active and silent states of slow oscillation start almost synchronously in cells located up to 12 mm apart. Termination of active states was even better synchronized than initiation (Volgushev et al. 2006). Earlier studies proposed that the activation of the Ca2+- and Na+-dependent K+ currents in pyramidal neurons and depression of the excitatory synaptic currents between pyramidal neurons mediate downward transitions of sleep slow oscillation (Timofeev et al. 2000a; Bazhenov et al. 2002; Compte et al. 2003; Hill & Tononi, 2005). In the current study, we predict that in addition to the intrinsic properties operating within individual neurons, the interneuron-mediated inhibitory circuits are significantly involved in manipulating synchronous state transitions during slow oscillation. Enhancing feedback inhibition by increasing the excitability of interneurons or by enhancing the strength of PY neuron–IN connection significantly increased the degree to which the termination of active cortical states was synchronized across the network. A similar level of inhibition across the cortical network was mediated by widespread inhibitory projections and can be further enhanced by gap junctions between inhibitory interneurons (Tamas et al. 2000).
Our study suggests that different biological mechanisms are involved in the initiation and termination of active states during slow oscillation. The initiation of an active state mostly relies on the overall level of the network excitability regulated by the properties of spontaneous synaptic transmitter release and intrinsic depolarizing conductances. The termination of an active state depends on the balance of excitation and inhibition and can be controlled by both intrinsic inhibitory conductances and activity of inhibitory interneurons. Because of this difference, during slow oscillation, alternating a specific network property, such as the activity of interneurons, would only affect the downward transitions but not the upward transitions.
Another possible mechanism that plays a role in regulating state transitions during slow oscillation could be mediated by the cortico-thalamo-cortical loop. Cortical activity can recruit intrinsic oscillatory mechanisms in the thalamocortical neurons (Hughes et al. 2002; Crunelli & Hughes, 2010), which could then increase synchrony within populations of cortical cells. This idea is supported by the observation that the offset of active states (downward transition) is less synchronous in neocortical slabs when there is no thalamocortical input (Timofeev et al. 2000a). However, TC cells are typically more active at the beginning of an active state (and therefore can contribute to the initiation of activity), but usually remain silent during the later phase (probably due to the strong inhibitory drive from RE neurons). Thus, the main contribution of TC neurons to the regulation of sleep slow oscillation is likely to be towards the initiation of an active state.
Effects of inhibition blockage on slow oscillation
Blocking inhibition is a common way to induce highly synchronized epileptic activity (Matsumoto & Ajmone-Marsan, 1964; Prince 1978; Chagnac-Amitai & Connors, 1989; Steriade et al. 1998). We found that under normal physiological conditions, fast synaptic inhibition controlled the properties of active states during slow oscillation. Therefore, when inhibition was only moderately reduced in the model, it prolonged active states and reduced the level of synchronization of the downward transitions. In contrast, a severe decrease of synaptic inhibition had the opposite effect, that of reducing the duration of the active state. Without synaptic inhibition, intense firing of pyramidal neurons near the onset of an active state immediately triggered intrinsic hyperpolarizing currents (such as Ca2+-dependent K+ current), and then terminated the active cortical state rapidly.
In a recent paper, Sanchez-Vives et al. (2010) have tested the impact of a progressive block of GABAA synaptic inhibition on the transition between active and silent states in vitro. They found that a progressive removal of inhibition leads to a steeper upward and downward transition in individual neurons. It was proposed that during the upward transition, synaptic events accumulate faster after the removal of inhibition suggesting that inhibition is able to slow down the recruitment of excitatory activity in local networks during physiological sleep slow oscillation (Sanchez-Vives et al. 2010). Here, we also found that interneuron-mediated inhibition can slow down the firing rate of pyramidal neurons during active states, particularly near the onset of an active state. Higher firing rates in severely disinhibited networks led to vigorous activation of the K+ channels that facilitated the early termination of an active state.
In another recent report, Mann et al. (2009) revealed that in rat entorhinal cortex, application of a slow inhibitory (GABAB type) receptor antagonist, CGP55845, increased the duration of persistent network activity, and prevented stimulus-induced downward transition. It was suggested that activation of slow inhibitory receptors, GABAB type, contributes to termination of active cortical states. While intracortical GABAB type receptors were not installed in our cortical network model, this reported effect of blockage of slow inhibition can be equivalent to the moderate increase of excitation in our cortical network model by mild reduction of fast inhibition; such increase of excitation in the cortical network led to increase of the active state duration consonant with in vitro data reported by Mann et al. (2009).
Our results regarding the effects of synaptic inhibition during slow oscillation are in agreement with previous studies in vitro (Mann et al. 2009; Sanchez-Vives et al. 2010) and highlight the idea that inhibitory circuits in the cortex play a critical role in manipulating the spatio-temporal pattern of slow oscillation.
Balance between excitatory and inhibitory signals in the thalamocortical network
During sleep slow oscillation, a silent state is characterized by the dramatic reduction of any synaptic activity in individual neurons. On the other hand, during active states, diverse combinations of recurrent excitation and inhibition were observed (Shu et al. 2003). A nearly ‘linear’ relationship between the excitatory and inhibitory conductances during active states was reported experimentally (Shu et al. 2003; Haider et al. 2006). In non-anaesthetized naturally sleeping animals (Rudolph et al. 2007), it was found that at the beginning of an active state, the inhibitory conductance is usually lower than the excitatory conductance. As the intensity of the recurrent network activity increased, both conductances rose. This was followed by a relative increase in inhibitory conductances until a transition to the silent state was effected (Rudolph et al. 2007). It was also found that the variance in inhibitory conductance was usually larger than the excitatory conductance during an active state (Rudolph et al. 2007). In addition, inhibitory synaptic barrages were found to be stronger (at frequencies between 2 and 200 Hz) and more synchronized than excitatory synaptic barrages during an active state (Hasenstaub et al. 2005).
More evidence supporting the potential contribution of inhibitory interneurons in manipulating neural network oscillations came from the anatomical studies. Electron microscopy has demonstrated that inhibitory interneurons are extensively connected via electrical synapses (Sloper 1972; Sotelo & Llinas, 1972). This low-resistance pathway allows quick communication within interneuron circuits and further synchronizes its activity (Gibson et al. 1999; Beierlein et al. 2000; Galarreta & Shaul, 2001). Evidence highlighting the significance of inhibition during sleep slow oscillation can be also derived from clinical studies. Several reports have showed that heightening cortical inhibitory activity using tiagabine (Mathias et al. 2001), or producing a tonic inhibitory conductance using gaboxadol (Deacon et al. 2007) can pharmacologically increase sleep slow oscillation and reduce the negative neurobehavioural and physiological consequences of sleep loss (Walsh 2009).
However, another study performed with animals anaesthetized using a mixture of ketamine–xylazine and urethane (Haider et al. 2006) concluded that excitation dominates the active state until the downward transition to silence. Considering the apparent contradiction between different sets of experimental data, our model predictions regarding the role of inhibition in terminating active cortical states provide some new insights into this open question. A more complete experimental design and study will be necessary to test the model predictions and to resolve this controversy (Haider et al. 2006; Rudolph et al. 2007). So far, the results reported in this study are consistent with previous observations (Shu et al. 2003; Hasenstaub et al. 2005; Volgushev et al. 2006). We further demonstrated that the powerful, prolonged, and synchronous inhibitory signals toward the end of an active state can lead to a higher incidence of IPSPs in neocortical neurons, and then synchronously cease recurrent activity in the cortical network. Thus, interneuron-mediated inhibition can be critical in regulating state transitions during slow oscillation and may directly contribute to various brain functions developed during slow-wave sleep.
Acknowledgments
This study was supported by NIH-NINDS (grant 1R01NS060870 to M.B. and I.T.), by Canadian Institutes of Health Research (grants MOP-37862, MOP-67175 to I.T.), and by the National Science and Engineering Research Council of Canada (grant 298475 to I.T.). I.T. is a Fonds de la Recherche en Santé du Québec Research Scholar. The authors thank Dr Giri Krishnan for help with model analysis.
Glossary
- EEG
electroencephalogram
- IN
interneuron
- PY
pyramidal
- RE
thalamic reticular
- TC
thalamocortical
Author contributions
J.-Y.C. and M.B. designed and performed the computational modelling experiments and wrote the manuscript. S.C. and I.T. designed and performed the biological experiments and also assisted in the writing of the manuscript. S.S. contributed to the modelling experiments and analysis of the modelling results. All authors approved the final version for publication.
References
- Abbott LF, Verela JA, Sen K, Nelson SB. Synaptic depression and cortical gain control. Science. 1997;275:220–224. doi: 10.1126/science.275.5297.221. [DOI] [PubMed] [Google Scholar]
- Achermann P, Borbely AA. Low-frequency (< 1 Hz) oscillations in the human sleep electroencephalogram. Neuroscience. 1997;81:213–222. doi: 10.1016/s0306-4522(97)00186-3. [DOI] [PubMed] [Google Scholar]
- Alzheimer C, Schwindt PC, Grill WE. Modal gating of Na+ channels as a mechanism of persistent Na+ current in pyramidal neurons from rat and cat sensorimotor cortex. J Neurosci. 1993;13:660–673. doi: 10.1523/JNEUROSCI.13-02-00660.1993. [DOI] [PMC free article] [PubMed] [Google Scholar]
- Bazhenov M, Timofeev I, Steriade M, Sejnowski TJ. Cellular and network models for intrathalamic augmenting responses during 10 Hz stimulation. J Neurophysiol. 1998;79:2730–2748. doi: 10.1152/jn.1998.79.5.2730. [DOI] [PubMed] [Google Scholar]
- Bazhenov M, Timofeev I, Steriade M, Sejnowski TJ. Model of thalamocortical slow-wave sleep oscillations and transitions to activated states. J Neurosci. 2002;22:8691–8704. doi: 10.1523/JNEUROSCI.22-19-08691.2002. [DOI] [PMC free article] [PubMed] [Google Scholar]
- Beierlein M, Gibson JR, Conors BW. A network of electrically coupled interneurons drives synchronized inhibition in neocortex. Nat Neurosci. 2000;3:904–910. doi: 10.1038/78809. [DOI] [PubMed] [Google Scholar]
- Blake H, Gerard RW. Brain potentials during sleep. Am J Physiol. 1937;119:692–703. [Google Scholar]
- Chagnac-Amitai Y, Connors BW. Horizontal spread of synchronized activity in neocortex and its control by GABA-mediated inhibition. J Neurophysiol. 1989;61:747–758. doi: 10.1152/jn.1989.61.4.747. [DOI] [PubMed] [Google Scholar]
- Chauvette S, Volgushev M, Timofeev I. Origin of active states in local neocortical networks during slow sleep oscillation. Cereb Cortex. 2010;20:2660–2674. doi: 10.1093/cercor/bhq009. [DOI] [PMC free article] [PubMed] [Google Scholar]
- Compte A, Sanchez-Vives MV, McCormick DA, Wang X-J. Cellular and network mechanisms of slow oscillatory activity (< 1 Hz) in a cortical network model. J Neurophysiol. 2003;89:2707–2725. doi: 10.1152/jn.00845.2002. [DOI] [PubMed] [Google Scholar]
- Contreras D, Steriade M. Cellular basis of EEG slow rhythms: a study of dynamic corticothalamic relationships. J Neurosci. 1995;15:604–622. doi: 10.1523/JNEUROSCI.15-01-00604.1995. [DOI] [PMC free article] [PubMed] [Google Scholar]
- Contreras D, Timofeev I, Steriade M. Mechanisms of long-lasting hyperpolarizations underlying slow sleep oscillations in cat corticothalamic networks. J Physiol. 1996;494:251–264. doi: 10.1113/jphysiol.1996.sp021488. [DOI] [PMC free article] [PubMed] [Google Scholar]
- Crochet S, Fuentealba P, Cisse Y, Timofeev I, Steriade M. Synaptic plasticity in local cortical network in vivo and its modulation by the level of neuronal activity. Cereb Cortex. 2006;16:618–631. doi: 10.1093/cercor/bhj008. [DOI] [PubMed] [Google Scholar]
- Crunelli V, Hughes SW. The slow (<1 Hz) rhythm of non-REM sleep: a dislogue between three cardinal oscillations. Nat Neurosci. 2010;13:9–17. doi: 10.1038/nn.2445. [DOI] [PMC free article] [PubMed] [Google Scholar]
- Deacon S, Staner C, Staner C, Legters A, Loft H, Lundahl J. Effect of short-term treatment with gaboxadol on sleep maintenance and initiation in patients with primary insomnia. Sleep. 2007;30:281–287. doi: 10.1093/sleep/30.3.281. [DOI] [PubMed] [Google Scholar]
- Destexhe A. Self-sustained asynchronous irregular states and Up-Down states in thalamic, cortical and thalamocortical networks of nonlinear integrate-and-fire neurons. J Comput Neurosci. 2009;27:493–506. doi: 10.1007/s10827-009-0164-4. [DOI] [PubMed] [Google Scholar]
- Destexhe A, Bal T, McCormick DA, Sejnowski TJ. Ionic mechanisms underlying synchronized oscillation and propagating waves in a model of ferret thalamic slices. J Neurophysiol. 1996;76:2049–2070. doi: 10.1152/jn.1996.76.3.2049. [DOI] [PubMed] [Google Scholar]
- Destexhe A, Mainen ZF, Sejnowski TJ. Synthesis of models for excitable membrane, synaptic transmission and neuromodulation using a common kinetic formalism. J Comp Neurosci. 1994;1:195–230. doi: 10.1007/BF00961734. [DOI] [PubMed] [Google Scholar]
- Dutar P, Nicoll RA. A physiological role for GABA receptors in the central nervous system. Nature. 1988;332:156–158. doi: 10.1038/332156a0. [DOI] [PubMed] [Google Scholar]
- Frohlich F, Bazhenov M. Coexistence of tonic firing and bursting in cortical neurons. Physical Review E. 2006;74:031922. doi: 10.1103/PhysRevE.74.031922. [DOI] [PubMed] [Google Scholar]
- Frohlich F, Bazhenov M, Sejnowski TJ. Pathological effect of homeostatic synaptic scaling on network dynamics in diseases of the cortex. J Neurosci. 2008;28:1709–1720. doi: 10.1523/JNEUROSCI.4263-07.2008. [DOI] [PMC free article] [PubMed] [Google Scholar]
- Frohlich F, Sejnowski TJ, Bazhenov M. Network bistability mediates spontaneous transitions between normal and pathological brain states. J Neurosci. 2010;30:10734–10743. doi: 10.1523/JNEUROSCI.1239-10.2010. [DOI] [PMC free article] [PubMed] [Google Scholar]
- Galarreta M, Hestrin S. Frequency-dependent synaptic depression and the balance of excitation and inhibition in the neocortex. Nat Neurosci. 1998;1:587–594. doi: 10.1038/2822. [DOI] [PubMed] [Google Scholar]
- Galarreta M, Shaul H. Electrical synapses between GABA-releasing interneurons. Nat Rev Neurosci. 2001;2:425–433. doi: 10.1038/35077566. [DOI] [PubMed] [Google Scholar]
- Gibson JR, Beierlein M, Connors BW. Two networks of electrically coupled inhibitory neurons in neocortex. Nature. 1999;402:75–79. doi: 10.1038/47035. [DOI] [PubMed] [Google Scholar]
- Golomb D, Amitai Y. Propagating neuronal discharges in neocortical slices: computational and experimental study. J Neurophysiol. 1997;78:1199–1211. doi: 10.1152/jn.1997.78.3.1199. [DOI] [PubMed] [Google Scholar]
- Haider B, Duque A, Hasenstaub AR, McCormick DA. Neocortical network activity in vivo is generated through a dynamic balance of excitation and inhibition. J Neurosci. 2006;26:4535–4545. doi: 10.1523/JNEUROSCI.5297-05.2006. [DOI] [PMC free article] [PubMed] [Google Scholar]
- Hasenstaub A, Shu Y, Haider B, Kraushaar U, Duque A, McCormick DA. Inhibitory postsynaptic potentials carry synchronized frequency information in active cortical networks. Neuron. 2005;47:423–435. doi: 10.1016/j.neuron.2005.06.016. [DOI] [PubMed] [Google Scholar]
- Hill S, Tononi G. Modeling sleep and wakefulness in the thalamocortical system. J Neurophysiol. 2005;93:1671–1698. doi: 10.1152/jn.00915.2004. [DOI] [PubMed] [Google Scholar]
- Hughes SW, Cope DW, Blethyn KL, Crunelli V. Cellular mechanisms of the slow (<1 Hz) oscillation in thalamocortical neurons in vitro. Neuron. 2002;33:947–958. doi: 10.1016/s0896-6273(02)00623-2. [DOI] [PubMed] [Google Scholar]
- Huguenard JR, Prince DA. A novel T-type current underlies prolonged Ca2+-dependent burst firing in GABAergic neurons of rat thalamic reticular nucleus. J Neurosci. 1992;12:3804–3817. doi: 10.1523/JNEUROSCI.12-10-03804.1992. [DOI] [PMC free article] [PubMed] [Google Scholar]
- Jones EG. Thalamic circuitry and thalamocortical synchrony. Philos Trans R Soc Lond B Biol Sci. 2002;357:1659–73. doi: 10.1098/rstb.2002.1168. [DOI] [PMC free article] [PubMed] [Google Scholar]
- Kay AR, Sugimori M, Llinas R. Kinetic and stochastic properties of a persistent sodium current in mature guinea pig cerebellar Purkinje cells. J Neurophysiol. 1998;80:1167–1179. doi: 10.1152/jn.1998.80.3.1167. [DOI] [PubMed] [Google Scholar]
- Kuznetsov Y. Elements of Applied Bifurcation Theory. New York: Springer-Verlag; 1995. [Google Scholar]
- Mahon S, Vautrelle N, Pezard L, Slaght SJ, Deniau JM, Chouvet G, Charpier S. Distinct patterns of striatal medium spiny neuron activity during the natural sleep-wake cycle. J Neurosci. 2006;26:12587–12595. doi: 10.1523/JNEUROSCI.3987-06.2006. [DOI] [PMC free article] [PubMed] [Google Scholar]
- Mainen ZF, Sejnowski TJ. Influence of dendritic structure of firing pattern in model neocortical neurons. Nature. 1996;382:363–366. doi: 10.1038/382363a0. [DOI] [PubMed] [Google Scholar]
- Mann EO, Kohl MM, Paulsen O. Distinct roles of GABAA and GABAB receptors in balancing and terminating persistent cortical activity. J Neurosci. 2009;29:7513–7518. doi: 10.1523/JNEUROSCI.6162-08.2009. [DOI] [PMC free article] [PubMed] [Google Scholar]
- Massimini M, Huber R, Ferrarelli F, Hill S, Tononi G. The sleep slow oscillation as a traveling wave. J Neurosci. 2004;24:6862–6870. doi: 10.1523/JNEUROSCI.1318-04.2004. [DOI] [PMC free article] [PubMed] [Google Scholar]
- Mathias S, Wetter TC, Steiger A, Lancel M. The GABA uptake inhibitor tiagabine promotes slow wave sleep in normal elderly subjects. Neurobiol Aging. 2001;22:247–253. doi: 10.1016/s0197-4580(00)00232-3. [DOI] [PubMed] [Google Scholar]
- Matsumoto H, Ajmone-Marsan C. Cortical cellular phenomena in experimental epilepsy: interictal manifestations. Exp Neurol. 1964;9:286–304. doi: 10.1016/0014-4886(64)90025-1. [DOI] [PubMed] [Google Scholar]
- McCormick DA. Neurotransmitter actions in the thalamus and cerebral cortex and their role in neuromodulation of thalamocortical activity. Prog Neurrobiol. 1992;39:337–388. doi: 10.1016/0301-0082(92)90012-4. [DOI] [PubMed] [Google Scholar]
- McCormick DA, Pape HC. Properties of a hyperpolarization activated cation current and its role in rhythmic oscillation in thalamic relay neurons. J Physiol. 1990;431:291–318. doi: 10.1113/jphysiol.1990.sp018331. [DOI] [PMC free article] [PubMed] [Google Scholar]
- Petersen CC, Hahn TT, Mehta M, Grinvald A, Sakmann B. Interaction of sensory responses with spontaneous depolarization in layer 2/3 barrel cortex. Proc Natl Acad Sci U S A. 2003;100:13638–13643. doi: 10.1073/pnas.2235811100. [DOI] [PMC free article] [PubMed] [Google Scholar]
- Prince DA. Neurophysiology of epilepsy. Annu Rev Neurosci. 1978;1:395–415. doi: 10.1146/annurev.ne.01.030178.002143. [DOI] [PubMed] [Google Scholar]
- Rosanova M, Timofeev I. Neuronal mechanisms mediating the variability of somatosensory evoked potentials during sleep oscillations in cats. J Physiol. 2005;562:569–582. doi: 10.1113/jphysiol.2004.071381. [DOI] [PMC free article] [PubMed] [Google Scholar]
- Rudolph M, Pospischil M, Timofeev I, Destexhe A. Inhibition determines membrane potential dynamics and controls action potential generation in awake and sleeping cat cortex. J Neurosci. 2007;27:5280–5290. doi: 10.1523/JNEUROSCI.4652-06.2007. [DOI] [PMC free article] [PubMed] [Google Scholar]
- Sanchez-Vives MV, Mattia M, Compte A, Perez-Zabalza M, Winograd M, Descalzo VF, Reig R. Inhibitory modulation of cortical up states. J Neurophysiol. 2010;104:1314–1324. doi: 10.1152/jn.00178.2010. [DOI] [PubMed] [Google Scholar]
- Sanchez-Vives MV, McCormick DA. Cellular and network mechanisms of rhythmic recurrent activity in the neocortex. Nat Neurosci. 2000;3:1027–1034. doi: 10.1038/79848. [DOI] [PubMed] [Google Scholar]
- Shu Y, Hasenstaub A, McCormick DA. Tuning on and off recurrent balanced cortical activity. Nature. 2003;423:288–293. doi: 10.1038/nature01616. [DOI] [PubMed] [Google Scholar]
- Sloper JJ. Gap junctions between dendrites in the primate neocortex. Brain Res. 1972;44:641–646. doi: 10.1016/0006-8993(72)90327-7. [DOI] [PubMed] [Google Scholar]
- Sotelo C, Llinas R. Specialized membrane junctions between neurons in the vertebrate cerebellar cortex. J Cell Biol. 1972;53:271–289. doi: 10.1083/jcb.53.2.271. [DOI] [PMC free article] [PubMed] [Google Scholar]
- Steriade M, Amzica F, Neckelmann D, Timofeev I. Spike-wave complexes and fast components of cortically generated seizures. II. Extra- and intracellular patterns. J Neurophysiol. 1998;80:1456–1479. doi: 10.1152/jn.1998.80.3.1456. [DOI] [PubMed] [Google Scholar]
- Steriade M, Contreras D, Dossi RC, Nuñez A. The slow (<1 Hz) oscillation in reticular thalamic and thalamo-cortical neurons: scenario of sleep rhythm generation in interacting thalamic and neocortical networks. J Neurosci. 1993a;13:3284–3299. doi: 10.1523/JNEUROSCI.13-08-03284.1993. [DOI] [PMC free article] [PubMed] [Google Scholar]
- Steriade M, Nuñez A, Amzica F. A novel slow (<1 Hz) oscillation of neocortical neurons in vivo : depolarizing and hyperpolarizing components. J Neurosci. 1993b;13:3252–3265. doi: 10.1523/JNEUROSCI.13-08-03252.1993. [DOI] [PMC free article] [PubMed] [Google Scholar]
- Steriade M, Nuñez A, Amzica F. Intracellular analysis of relations between the slow (<1 Hz) neocortical oscillations and other sleep rhythms of electroencephalogram. J Neurosci. 1993c;13:3266–3283. doi: 10.1523/JNEUROSCI.13-08-03266.1993. [DOI] [PMC free article] [PubMed] [Google Scholar]
- Steriade M, Timofeev I, Grenier F. Natural waking and sleep states: a view from inside neocortical neurons. J Neurophysiol. 2001;85:1969–1985. doi: 10.1152/jn.2001.85.5.1969. [DOI] [PubMed] [Google Scholar]
- Stevens CF. Quantal release of neurotransmitter and long-term potentiation. Cell. 1993;72S:55–63. doi: 10.1016/s0092-8674(05)80028-5. [DOI] [PubMed] [Google Scholar]
- Stopfer M, Bazhenov M. Forward and back: motifs of inhibition in olfactory processing. Neuron. 2010;67:357–358. doi: 10.1016/j.neuron.2010.07.023. [DOI] [PMC free article] [PubMed] [Google Scholar]
- Tamas G, Buhl EG, Lorincz A, Somogyi P. Proximal targeted GABAergic synapses and gap junctions synchronize cortical interneurons. Nat Neurosci. 2000;3:366–371. doi: 10.1038/73936. [DOI] [PubMed] [Google Scholar]
- Timofeev I, Contreras D, Steriade M. Synaptic responsiveness of cortical and thalamic neurones during various phases of slow sleep oscillation in cat. J Physiol. 1996;494:265–278. doi: 10.1113/jphysiol.1996.sp021489. [DOI] [PMC free article] [PubMed] [Google Scholar]
- Timofeev I, Grenier F, Bazhenov M, Sejnowski TJ, Steriade M. Origin of slow cortical oscillations in deafferented cortical slabs. Cereb Cortex. 2000a;10:1185–1199. doi: 10.1093/cercor/10.12.1185. [DOI] [PubMed] [Google Scholar]
- Timofeev I, Grenier F, Steriade M. Impact of intrinsic properties and synaptic factors on the activity of neocortical networks in vivo. J Physiol. 2000b;94:343–355. doi: 10.1016/s0928-4257(00)01097-4. [DOI] [PubMed] [Google Scholar]
- Timofeev I, Grenier F, Steriade M. Disfacilitation and active inhibition in the neocortex during the natural sleep-wake cycle: An intracellular study. Proc Natl Acad Sci U S A. 2001;98:1924–1929. doi: 10.1073/pnas.041430398. [DOI] [PMC free article] [PubMed] [Google Scholar]
- Timofeev I, Steriade M. Low-frequency rhythms in the thalamus of intact-cortex and decorticated cats. J Neurophysiol. 1996;76:4152–4168. doi: 10.1152/jn.1996.76.6.4152. [DOI] [PubMed] [Google Scholar]
- Traub RD, Miles R. Neuronal Networks of the Hippocampus. Cambridge, UK: Cambridge UP; 1991. [Google Scholar]
- Tsodyks MV, Markram H. The neural code between neocortical, pyramidal neurons depends on neurotransmitter release probability. Proc Natl Acad Sci U S A. 1997;94:719–723. doi: 10.1073/pnas.94.2.719. [DOI] [PMC free article] [PubMed] [Google Scholar]
- Ulrich D, Huguenard JR. Nucleus-specific chloride homeostasis in rat thalamus. J Neurosci. 1997;17:2348–2354. doi: 10.1523/JNEUROSCI.17-07-02348.1997. [DOI] [PMC free article] [PubMed] [Google Scholar]
- Volgushev M, Chauvette S, Mukovski M, Timofeev I. Precise long-range synchronization of activity and silence in neocortical neurons during slow-wave sleep. J Neurosci. 2006;26:5665–5672. doi: 10.1523/JNEUROSCI.0279-06.2006. [DOI] [PMC free article] [PubMed] [Google Scholar]
- Walsh JK. Enhancement of slow wave sleep: implications for insomnia. J Clin Sleep Med. 2009;5:S27–S32. [PMC free article] [PubMed] [Google Scholar]
- Wilson CJ, Kawaguchi Y. The origins of two-state spontaneous membrane potential fluctuations of neostriatal spiny neurons. J Neurosci. 1996;16:2397–2410. doi: 10.1523/JNEUROSCI.16-07-02397.1996. [DOI] [PMC free article] [PubMed] [Google Scholar]
- Wilson CJ. Postsynaptic potentials evoked in spiny neostriatal projection neurons by stimulation of ipsilateral and contralateral neocortex. Brain Res. 1986;367:201–213. doi: 10.1016/0006-8993(86)91593-3. [DOI] [PubMed] [Google Scholar]
- Wilson CJ, Chang HT, Kitai ST. Disfacilitation and long-lasting inhibition of neostriatal neurons in the rat. Exp Brain Res. 1983;51:227–235. doi: 10.1007/BF00237198. [DOI] [PubMed] [Google Scholar]


