

Abstract
Though epistasis has long been postulated to have a critical role in genetic regulation of important pathways as well as provide a major source of variation in the process of speciation, the importance of epistasis for genomic selection in the context of plant breeding is still being debated. In this paper, we report the results on the prediction of genetic values with epistatic effects for 280 accessions in the Nebraska Wheat Breeding Program using adaptive mixed least absolute shrinkage and selection operator (LASSO). The development of adaptive mixed LASSO, originally designed for association mapping, for the context of genomic selection is reported. The results show that adaptive mixed LASSO can be successfully applied to the prediction of genetic values while incorporating both marker main effects and epistatic effects. Especially, the prediction accuracy is substantially improved by the inclusion of two-locus epistatic effects (more than onefold in some cases as measured by cross-validation correlation coefficient), which is observed for multiple traits and planting locations. This points to significant potential in using non-additive genetic effects for genomic selection in crop breeding practices.
Keywords: adaptive mixed LASSO (least absolute shrinkage and selection operator), epistasis, genomic selection, plant breeding, wheat
Introduction
Epistasis has long been postulated to have a critical role in genetic regulation of important pathways as well as provide a major source of variation in the process of speciation (Phillips, 2008). At the molecular level, the interactions between genes are well documented. For less diversified plant populations, the importance of epistasis is still an area of active research. In a number of studies, epistasis has been shown to contribute a large portion of genetic variance in the progeny of line crosses (Malmberg and Mauricio, 2005; Malmberg et al., 2005; Hu et al., 2011). Regarding the potential of utilizing epistatic effects in genomic selection, evidence from different studies is notably varied and it may depend on crop species and traits. On one hand, Blanc et al. (2006) suggested significant marker by background interactions in maize; Dudley (2008) and Dudley and Johnson (2009) argued for substantial benefits in using epistatic effects to improve genetic value prediction in intermated maize recombinant inbred lines; Hu et al. (2011) gave an example for the advantages of using epistatic effects in soybean biparental populations. On the other hand, using nested mapping populations, the study in Buckler et al. (2009) and Tian et al. (2011) seemed to suggest very little role for the contribution of epistasis; Lorenzana and Bernardo (2009) found that including interaction terms in fact reduced prediction accuracy for the intermated recombinant inbred line population that they analyzed. More discussion on this topic can be found in Cooper et al. (2009) and Lorenz et al. (2011). In summary, the potential advantage of incorporating epistatic effects in the prediction of genetic values for plant breeding requires further investigation. Results from actual breeding populations are especially needed.
Genomic selection (Meuwissen et al., 2001) using a large number of markers has been studied by various researchers in plant populations (Bernardo and Yu, 2007; Piepho, 2009; Jannink et al., 2010; Crossa et al., 2010 among others). Significant literatures also exist in animal breeding research (for example, Gonzalez-Recio et al., 2008; van Raden et al., 2008; de los Campos et al., 2009a; Hayes et al., 2009 and Toosi et al., 2009). In both settings, the large amount of variation resulted from hundreds or thousands of markers can be controlled by various shrinkage methods formulated in frequentist or Bayesian frameworks, which has notable success in multiple crop species (for example, Lorenzana and Bernardo, 2009 and Crossa et al., 2010). In principle, epistatic effects can be incorporated just as main marker effects in these models, but the elevated number of epistatic effects can still pose serious problems when the number of markers is large. Some work has been done to directly model two-locus epistatic effects, mainly in biparental populations (for example, Hu et al., 2011). A related method for modeling non-additive effects is to use models based on reproducing kernel Hilbert spaces (RKHS; Gianola and van Kaam, 2008; de los Campos et al., 2009b). RKHS regression implicitly maps marker effects into a high dimensional feature space and consequently utilizes non-additive effects of genetic markers. Crossa et al. (2010) demonstrated that RKHS regression can be advantageous for predicting genetic values in some cases. Due to the manner of model formulation, it is usually not apparent from RKHS regression which markers and their interactions are important for the prediction, a knowledge that is important to breeders. Recent developments in this area also include efforts to apply machine learning algorithms like neural networks (González-Camacho et al., 2012).
In the setting of association analysis, Wang et al. (2011) proposed the adaptive mixed least absolute shrinkage and selection operator (LASSO) method for identifying quantitative trait loci and epistatic effects in structured plant populations. In comparison with the original LASSO (Tibshirani, 1996), adaptive LASSO (Zou, 2006) uses different weights to modulate the amount of shrinkage applied to each regression coefficient and thus enhances the performance of the model. Wang et al. (2011) extended adaptive LASSO to models that accounts for population structure in breeding populations by incorporating random effects, which lead to adaptive mixed LASSO. Moreover, a two-step procedure was devised to handle epistatic effects with a large number of genetic markers.
In this paper, we further develop the method of Wang et al. (2011) for genomic selection purpose. Specifically, the criteria for the inclusion of markers and epistatic effects into the model are relaxed, leading to larger models that are better suited for prediction tasks (as opposed to the selection of the correct set of genetic effects). We applied adaptive mixed LASSO to several traits measured on 280 winter wheat accessions with >1000 Diversity Array Technology (DArT) markers at 9 locations. These accessions are drawn from the active breeding population of Nebraska Wheat Breeding Program and are part of a larger study of association analysis in winter wheat. The results reported here are directly relevant to current plant breeding practices. It is shown very consistently for different traits and locations in this study that incorporating two-locus epistatic effects substantially improves the prediction accuracy for genetic values for these accessions. This suggests that utilizing epistatic effects for plant breeding has significant potential. We shall focus on the development of adaptive mixed LASSO for genomic selection and the implication of incorporating epistatic effects. Detailed discussion of the genetic structure of the Nebraska wheat breeding population including significant genomic regions will be published elsewhere.
Materials and methods
Breeding population
The Nebraska Wheat Breeding Program focuses on releasing winter wheat cultivars with good properties in agronomic performance, winter hardiness, stem rust (caused by Puccinia graminis Pers.: Pers. f. sp. tritici Eriks & E. Henn.) resistance and end-use quality. The procedure of generating a wheat cultivar has been described inBaenziger et al. (2001, 2008). The 280 accessions considered in this paper are part of a population for an ongoing multi-year association study in winter wheat. Data regarding various traits for these accessions were collected in 2010 at up to nine Nebraska locations (see Baenziger et al., 2011 for a description of these testing sites). Traits considered in this paper include grain yield (nine locations), grain volume weight (nine locations), plant height (eight locations) and flowering date (three locations). Each accession was genotyped with >6000 DArT (Akbari et al., 2006) markers by Triticarte Pty. Ltd. (Canberra, Australia; http://www.triticarte.com.au). The genotype for each marker was coded as one or zero, corresponding to the presence or absence of the feature. Information on markers including genetic maps can be accessed at the Triticarte website. Triticarte uses several measures to filter out unreliable markers, including the separation of the two phases (one or zero) in the data, calling rate and reproducibility. A total of 1083 markers passed these quality control measures and were polymorphic for the accessions under study, the proportion is typical for genotyping with DArT markers. We restricted analysis to markers with minor allele frequency of at least 5% and avoided including multiple highly correlated markers, details are given in data analysis.
Adaptive mixed LASSO
The mathematical property of adaptive mixed LASSO and its application to association mapping have been discussed in Wang et al. (2011). Here, we provide a outline of the method and discuss the modification for the setting of genomic selection.
For n accessions in a breeding population, let yi, i=1,…, n be the phenotypic value of the ith accession and xi=(xi1,…,xip)T be the covariate vector for p genetic effects (marker main effects or epistatic effects) for this accession. In the following linear mixed effects model,
 |
β* is the p dimensional coefficient vector for fixed effects (markers and epistatic effects), ui is the random effect of the ith accession and ɛi is the independent error term. For simplicity, we assume that there is only one phenotypic value for each accession, though more complex cases can be readily accommodated. Alternatively, we can write it in the matrix form,  . Here, the matrix X is the ‘design' matrix corresponding to fixed effects. Matrix Z is the n × n identity matrix in the simple case that we considered here, but would take other forms for more complex designs. Following usual assumptions of linear mixed models, we assume that u and ɛ are independent Gaussian vectors with
  and
and  where K is the relationship matrix for the accessions, I is the n × n identity matrix, and
  and
and  are variance components associated with accessions and residual errors, respectively. With this formulation, we have
 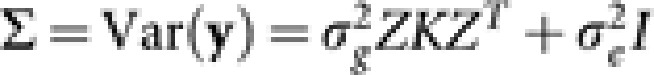 .
.
Here, we use the relationship matrix, K, to account for the population structure. The matrix K can be derived using the pedigree information for all accessions, or it can be estimated with genetic markers. In the latter case, high precision can be achieved with enough genetic markers. How to derive K with marker information has been discussed extensively by other authors (for example, Kang et al., 2008 and Stich et al., 2008). We shall use the emma package of Kang et al. (2008) for estimating the relationship matrix for numerical results in this paper.
The adaptive mixed LASSO estimator of the fixed effect β* is obtained as
 |
where λn is the tuning parameter (depending on the population size n) for controlling the amount of shrinkage, wk is the weight for the kth genetic effect such that each effect will receive a different amount of shrinkage and  is a consistent estimator of Σ. In practice, it is more convenient to determine λn indirectly by choosing the number of predictors to be included in the model. Wang et al. (2011) demonstrated the so-called ‘oracle' property for adaptive mixed LASSO, that is, adaptive mixed LASSO selects the correct set of predictors with probability tending to 1 and at the same time attains the same asymptotic efficiency for the estimation of non-zero coefficients as when the correct model is known. It also means that adaptive mixed LASSO can be used to obtain consistent estimates of genetic values, though the optimal value for the tuning parameter is usually different from that for association mapping context considered in Wang et al. (2011). When the number of markers is large, additional modifications are required to achieve computational efficiency, which is described below. Our results show that the attractive properties of adaptive mixed LASSO are maintained with these modifications.
Computation
As in the original LASSO, choosing the value of the tuning parameter λn is equivalent to determining how many predictors should be included in the model. When λn is sufficiently large, no fixed effect will be included in the model  . As λn is gradually reduced, fixed effects will enter the model one by one, which provides an ordering for the genetic effects. We utilize this ordering to add one extra genetic effect at a time into the model and iteratively estimate β* and variance components. The rationale closely follows that of the LARS (Least Angle Regression) algorithm in Efron et al. (2004) with the added complexity of estimating variance components. Specifically, the computational algorithm is as follows:
Perform the (unadaptive) LASSO fitting using the phenotypic value as the response variable and all genetic effects (marker main effects and epistatic effects) and the eigenvectors associated with the largest few eigenvalues of K as predictors with the LARS algorithm. Keep the q genetic effects that enter the LASSO solution first for subsequent analysis and let Xq be the design matrix corresponding to these q genetic effects. The R package lars is used to implement the LARS algorithm in this step.
- For k=0,…,q−1, repeat the following.
- b.1 Use the estimate of the fixed effects from the last iteration (all fixed effects are set to zero if k=0) as the real values to calculate the estimate for the variance components by maximum likelihood and obtain the corresponding estimator
 for Σ.
 - b.2 Obtain the transformed response and explanatory variables:
 ,
,  . Use the LARS algorithm to perform the adaptive LASSO fitting on
  and
and  to obtain the estimates of the first k+1 fixed effects.
 - b.3 Increase k by 1.
Use cross-validation (CV) or AIC (Akaike information criterion) to determine how many fixed effects should be included in the model according to when the optimum is achieved in step (b). Fit the final model to obtain the estimates of fixed effects as well as variance components by iteratively fitting adaptive LASSO and maximum likelihood for variance components.
In step (a), a majority of genetic effects is eliminated so that the remaining number, q, of genetic effects is smaller than the sample size. The value of q should be large enough so as not to exclude important effects at this step but otherwise needs not be precise. For example, q can be chosen as one half or two-thirds of the sample size. The retained predictors are the q genetic effects that enter the LASSO solution first. The eigenvectors associated with the largest few eigenvalues of the relationship matrix are included to capture the main features of the population structure (Price et al., 2006). However, these vectors are dropped in subsequent LASSO fitting after step (a) as the population structure is accounted for with the relationship matrix K. The approach of prescreening predictors before more detailed variable selection has been discussed extensively in Fan and Lv (2008). At this point, a crude estimator ( ) was obtained by ordinary least squares for each retained marker and
  , k=1,…,q was then used as weight in the subsequent steps, this is similar to the treatment of Zou (2006).
In step (b), we iteratively carry out the fitting of adaptive LASSO with the LARS algorithm and calculating new estimates of the variance components using the maximum likelihood method (the implementation is similar to that of Kang et al. (2008) where the maximum likelihood estimators for  and the ratio
  are obtained through Newton-Raphson method). In step (b), one might choose to repeat (b.1) and (b.2) a few times to get a more accurate estimate, though it does not seem to make any notable difference while adding to the computational cost.
The major difference between the implementation in this paper and that of Wang et al. (2011) is regarding the criteria for determining the number of genetic effects. Wang et al. (2011) focused on identifying relatively large genetic effects with low type I error rate and recommended the EBIC (extended Bayesian criterion) method of Chen and Chen (2008). As EBIC is very stringent, when there are a number of genetic effects that are relatively small in size but none being large, the algorithm of Wang et al. (2011) tends to include very few genetic effects in the selected model and results in prediction performance very similar to models based only on kinship. For the study here, the primary goal is the accurate prediction of genetic values and the inclusion criterion for genetic effects need not be as stringent as that of Wang et al. (2011). The CV criterion and AIC are more suitable since they tend to select larger models with better prediction performance (the ranking of the genetic effects is unchanged). In comparison with CV, AIC is easier to compute; it tends to select more genetic effects in the model, which leads to a usually modest decrease in CV correlation coefficients. For results reported in this paper, a 10-fold CV is used. After it is determined how many predictors should be included in the final model, more iterations are carried out with the selected predictors to obtain the final estimates as in step (c).
Modeling epistasis
When the number of markers is large (hence a huge number of epistatic effects), it is impractical to consider all epistatic effects simultaneously with a relatively small population size. For this, we adopt two strategies. The first is that if a group of markers are highly correlated (a common occurrence for DArT markers), only one marker will be represented in the model. This is equivalent to using tag single nucleotide polymorphism markers (de Bakker et al., 2005). Specifically, we use the Hclust method of Rinaldo et al. (2005) and pick tag markers with correlation <0.7. The second strategy is to only consider the epistatic effects from markers showing at least a weak signal in main effects. This approach has been successfully applied in human genome-wide association studies (Wu et al., 2010). In particular, after tag markers are selected, adaptive mixed LASSO for the linear mixed model,  , is first fitted with only the main effects (in the matrix X) to generate an ordering of main effects according to the sequence that each marker enters the adaptive mixed LASSO solution (step 1). Step 2 starts with adaptive mixed LASSO fitting with all the markers that are included in the optimal main-effect-only model and their pair-wise epistatic effects, and the AIC or CV criterion is computed. Additional markers (including their main effects and two-locus epistatic effects with other markers in the model) are then sequential added according to the ordering generated in step 1 until the model with the minimum AIC or minimum sum of squared prediction error under CV is identified.
Data analysis
Missing genotypes were imputed with the marginal distribution of marker genotypes. Only markers with minor allele frequency of at least 0.05 are retained for analysis. The Hclust package (Rinaldo et al., 2005) was used to select tag markers from clusters of correlated DArT markers. After the processing, 488 DArT markers and their two-locus epistatic effects were retained for the prediction of genetic values. The number of markers retained in step (a), q, is set to be two-thirds of the sample size. The relationship matrix K for 280 accessions was calculated using the emma package described in Kang et al. (2008). Adaptive mixed LASSO was coded with R statistical software (http://www.r-project.org). The code is available from the corresponding author and an R package will be released upon completion.
Evaluation of performance
The prediction accuracy was evaluated using the CV correlation coefficient. Specifically, 10-fold CV was carried out with the accessions being randomly divided into 10 parts with equal number of accessions. When one part served as the validation set, the other nine parts formed the training set for model building. The adaptive mixed LASSO model built using data in the training set was used to predict the genetic values of accessions in the validation set. The process was repeated till all 10 parts had served as the validation set. The CV correlation coefficient was then calculated as the Pearson correlation coefficient between phenotypic values and the so predicted genetic values. Similar to Xu (2007) and Wang et al. (2011), the contribution of each genetic effect to the phenotypic variation (neglecting covariance between genetic effects) is defined as  for the jth genetic effect (main or epistatic) with
  being the variance of the jth genetic effect. In actual calculation, the estimated values were substituted for their population equivalents.
Result
Adaptive mixed LASSO was used to analyze data regarding four traits, that is, grain yield (nine locations), grain volume weight (nine locations), plant height (eight locations) and flowering date (three locations). The analysis was performed with main marker effects only, as well as with both main effects and two-locus epistatic effects. The results are summarized in Tables 1 and 2. One notable finding here is that the inclusion of epistatic effects has a considerable impact on the prediction power for all traits and locations. This can be seen very directly from the result for grain yields. The prediction power using only main marker effects are generally low, with the CV correlation coefficient being essentially zero at some locations. An analysis using Bayesian LASSO gives similar results. But once epistatic effects are incorporated, adaptive mixed LASSO achieved CV correlation coefficients of 0.44–0.65. This means that by including epistatic effects, marker genotypes can be very useful for breeding purposes when very little gain can be obtained when using main effects alone. Similar results were also observed with other traits that we studied.
Table 1. Prediction of genetic values for grain yield and grain volume weight.
| Location | Cor-M | Cor-M&E |
M&E |
||
|---|---|---|---|---|---|
| Main | Epistatic | Total markers | |||
| Grain yield | |||||
| 1 | 0.29 | 0.62 | 9 | 91 | 62 |
| 2 | 0.22 | 0.62 | 8 | 87 | 62 |
| 3 | 0.02 | 0.42 | 7 | 93 | 75 |
| 4 | 0.36 | 0.61 | 3 | 68 | 56 |
| 5 | 0.31 | 0.52 | 7 | 57 | 55 |
| 6 | 0.07 | 0.44 | 7 | 40 | 37 |
| 7 | 0.41 | 0.65 | 6 | 68 | 42 |
| 8 | 0.18 | 0.57 | 18 | 94 | 46 |
| 9 | 0.05 | 0.52 | 3 | 94 | 74 |
| Grain volume weight | |||||
| 1 | 0.41 | 0.59 | 4 | 83 | 59 |
| 2 | 0.36 | 0.63 | 9 | 82 | 59 |
| 3 | 0.47 | 0.62 | 2 | 48 | 54 |
| 4 | 0.29 | 0.57 | 5 | 57 | 51 |
| 5 | 0.31 | 0.62 | 6 | 74 | 65 |
| 6 | 0.40 | 0.51 | 7 | 68 | 55 |
| 7 | 0.34 | 0.58 | 3 | 102 | 70 |
| 8 | 0.28 | 0.52 | 5 | 47 | 51 |
| 9 | 0.44 | 0.58 | 7 | 91 | 66 |
Abbreviation: LASSO, least absolute shrinkage and selection operator.
The cross-validation correlation coefficients between predicted genetic values and phenotypic values of grain yield and grain volume weight are reported for adaptive mixed LASSO when using main marker effects only (Cor-M) or using both main marker effects and epistatic effects (Cor-M&E). For adaptive mixed LASSO with main and epistatic effects, the number of main effects, two-locus epistatic effects, as well as the total number of markers involved in these effects are also shown for the chosen model.
Table 2. Prediction of plant height and flowering date.
| Location | Cor-M | Cor-M&E |
M&E |
||
|---|---|---|---|---|---|
| Main | Epistatic | Total markers | |||
| Plant height | |||||
| 1 | −0.02 | 0.57 | 2 | 96 | 76 |
| 2 | 0.43 | 0.52 | 5 | 56 | 60 |
| 3 | 0.25 | 0.41 | 2 | 44 | 54 |
| 4 | 0.30 | 0.59 | 4 | 77 | 61 |
| 6 | 0.39 | 0.66 | 9 | 111 | 57 |
| 7 | 0.36 | 0.62 | 3 | 61 | 55 |
| 8 | 0.31 | 0.58 | 10 | 87 | 61 |
| 9 | 0.20 | 0.58 | 3 | 95 | 73 |
| Flowering date | |||||
| 1 | 0.39 | 0.60 | 8 | 88 | 53 |
| 2 | 0.41 | 0.60 | 25 | 93 | 52 |
| 3 | 0.50 | 0.65 | 8 | 111 | 73 |
Abbreviation: LASSO, least absolute shrinkage and selection operator.
The cross-validation correlation coefficients between predicted genetic values and phenotypic values of plant height and flowering date are reported for adaptive mixed LASSO when using main marker effects only (Cor-M) or using both main marker effects and epistatic effects (Cor-M&E). For adaptive mixed LASSO with main and epistatic effects, the number of main effects, two-locus epistatic effects, as well as the total number of markers involved in these effects are also shown for the chosen model.
As seen in Tables 1 and 2, the number of epistatic effects far exceeds that of marker main effects in the chosen mixed model for various traits. Consider grain yield as an example, the number of main effects ranges from 3 to 18 while the number of epistatic effects ranges from 40 to 94 in 9 locations. Also, the total number of markers involved in the model either as main effects or as part of epistatic effects is between 37 and 74. So for the majority of markers, the main effect has been absorbed into epistatic effects and some markers are involved in multiple epistatic interactions (up to 12 for the grain yield data), which are similar to observations in Hu et al. (2011) for biparental populations. The size of genetic effects in the models for locations 1 and 6, representing two distinct environments, is illustrated in Figure 1. Among nine locations, the total contribution of main marker effects (calculated as the sum of  ) to yield is between 3 and 12% while the total contribution of epistatic effects ranges from 39 to 83%. The largest genetic effects are from epistatic effects for all nine locations, their contribution to phenotypic variation ranges from 3 to 8%. The general pattern observed for grain yield also holds true for grain volume weight, plant height and flowering date. The prominence of epistatic effects likely reflect the intricate structure of genetic networks that modulate complex traits, which can only be discerned with a large number of markers. On the other hand, one might consider the total effect of a genetic locus to include all the epistatic effects for which it is a party in addition to its main effect in the model.
Figure 1.

The size of genetic effects (main marker effects or two-locus epistatic effects) included in the adaptive mixed LASSO model for grain yield, grain volume weight, plant height and flowering date at locations 1 and 6 (flowering date was not measured at location 6). In each panel, only markers with contributions to either main effects or epistatic effects in the chosen model are plotted.
Discussion
As mentioned in the introduction, it is still not clear how important a role that epistasis played in determining complex traits in plant breeding populations. There is, however, evidence that incorporating non-additive effects could be very beneficial in some populations. Xu and others considered two populations from experimental crosses and arrived at strikingly different findings. In the doubled-haploid barley population studied in Xu and Jia (2007), main marker effects were overwhelmingly dominant in the empirical Bayes model for all seven traits that they considered while epistasis was negligible. In contrast, in a study using soybean recombinant inbred lines (Hu et al., 2011), all effects included in the selected model were epistatic effects. Hu et al. (2011) also observed significant improvement in prediction accuracy for models incorporating epistatic effects relative to purely additive models.
For plant breeding populations, Crossa et al. (2010) compared a Bayesian LASSO method that considers only additive effects and RKHS regression that incorporates non-additive effects. In the analysis of grain yield for historical wheat lines from International Maize and Wheat Improvement Center (CIMMYT), RKHS regression out performed Bayesian LASSO for all four environments, thus pointing to the importance of using non-additive effects, though the picture is more mixed for the analysis of two maize data sets considered in the paper. For comparison, we applied adaptive mixed LASSO to the historical wheat data of Crossa et al. (2010). The prediction accuracy of adaptive mixed LASSO using both main and epistatic effects is similar or better than that of RKHS regression (and better than that of Bayesian LASSO, which is similar to adaptive mixed LASSO using only main effects) in four environments (Table 3). This supports the incorporation of non-additive effects to improve prediction accuracy, which is achieved by explicitly modeling epistatic effects with our model while RKHS regression uses a more implicit approach.
Table 3. Prediction accuracy using historical wheat data of Crossa et al. (2010).
| Trait-environment |
Model |
||
| |
AML |
PM-RKHS |
PM-BL |
| GY-E1 | 0.60 | 0.61 | 0.54 |
| GY-E2 | 0.59 | 0.50 | 0.50 |
| GY-E3 | 0.57 | 0.48 | 0.45 |
| GY-E4 | 0.62 | 0.52 | 0.50 |
Abbreviations: CV, cross-validation; LASSO, least absolute shrinkage and selection operator; RKHS, reproducing kernel Hilbert spaces.
The CV correlation coefficients between predicted genetic values and phenotypic values are shown for grain yield in four environments described in Crossa et al. (2010). The methods include adaptive mixed LASSO using main and epistatic effects in addition to pedigrees (AML), RKHS regression using markers and pedigrees (PM-RKHS), and Bayesian LASSO using markers and pedigrees (PM-BL). The results for PM-RKHS and PM-BL are taken from Crossa et al. (2010).
To corroborate these findings with another species, we also used adaptive mixed LASSO to analyze a CIMMYT data set regarding gray leaf spot caused by the fungus Cerospora zeae-maydis on 278 maize lines evaluated in Pereira (Colombia, all 278 lines) and San Pedro Lagunillas (Mexico, 261 lines) with genotype information on 46 374 markers. The results are similar to those for wheat data. The CV coefficient is improved from 0.502 (main effects only) to 0.855 (main and epistatic effects) for the Mexico site and from 0.556 to 0.885 for the Columbia site. Thus, the improvement achieved by considering epistatic effects is not limited to the Nebraska wheat breeding population, though the benefit may still vary with crop species and breeding programs.
Adaptive LASSO was proposed to improve the performance of the original LASSO by applying different degrees of penalty on regression coefficients (Zou, 2006). Wang et al. (2011) extended the same approach to mixed models in the setting of plant association mapping in the form of adaptive mixed LASSO. Wang et al. (2011) and others have discussed the importance of incorporating population structure for association studies. For prediction purpose, the advantage of incorporating population structure (in the form of the K matrix) lies in that it utilizes the information regarding similarities between lines (kinship) when making prediction in addition to using marker genotypes. Especially when marker coverage over some genomic regions is sparse, as in the examples considered here, kinship can provide valuable information not reflected in marker genotypes.
In this paper, we show that adaptive mixed LASSO can also be applied in the context of genomic selection. In separate analysis considering main effects only, adaptive mixed LASSO out performs the original LASSO using all main effects, suggesting the prescreening step retains most or all useful markers. The advantage of the proposed method is especially prominent when epistatic effects are to be considered. The main change comparing with Wang et al. (2011) is to use more relaxed criteria in determining the number of genetic effects to be incorporated in the model. Similar to other shrinkage-based methods, the majority of genetic effects are small. But as an LASSO-based approach, adaptive mixed LASSO still results in sparse models. In the data analyzed here, main and epistatic effects from several dozens of markers are retained out of hundreds of markers and tens of thousands of epistatic effects. This could be a beneficial feature as breeders are often interested in knowing important genetic regions contributing to the model even when gene mapping is not the primary goal. In comparison, RKHS regression does not result in an explicit list of markers though it also improves the prediction accuracy by incorporating non-additive effects. An advantage of RKHS regression is that it simultaneously takes into account higher order epistatic effects for all markers, which could be useful when there exists higher order epistatic interactions of importance. As the exact genetic structure of a trait is usually unknown, there may be cases where a non-sparse model, using a much larger number of markers, would be preferable. This might be clarified thorough further research. Though we only focused on two-locus epistatic effects in our analysis, incorporating epistatic effects of more than two loci poses no significant difficulty to adaptive mixed LASSO in the theoretical aspect. More research is planned to ascertain its performance in applications.
Adaptive mixed LASSO can be further extended in other directions. Since the proposed approach is indifferent to the source underlying the regression coefficients, at least in principle, gene-by-environment interactions and more complex designs can be readily incorporated with suitable modification of computation algorithms. These will be discussed in future publications.
DATA ARCHIVING
Data have been deposited at Dryad: doi:10.5061/dryad.2sk59.
Acknowledgments
We would like to thank three referees and editors whose comments has significantly improved the quality of this paper. This research is supported by a grant from National Institute of Food and Agriculture, US Department of Agriculture (Grant Number 2009-65300-05702). DW also acknowledges the financial support of National Science Foundation (Award 0820668).
References
- Akbari M, Wenzl P, Caig V, Carling J, Xia L, Yang S, et al. Diversity arrays technology (DArT) for high-throughput profiling of the hexaploid wheat genome. Theor Appl Genet. 2006;113:1409–1420. doi: 10.1007/s00122-006-0365-4. [DOI] [PubMed] [Google Scholar]
- Baenziger PS, Beecher B, Graybosch RA, Ibrahim AMH, Baltensperger DD, Nelson LA, et al. Registration of ‘NE01643' wheat. J Plant Regist. 2008;2:36–42. [Google Scholar]
- Baenziger PS, Ibrahim S, Little RS, Santra DK, Regassa T, Wang MY. Structuring an efficient organic wheat breeding program. Sustainability. 2011;3:1190–1205. [Google Scholar]
- Baenziger PS, Shelton DR, Shipman MJ, Graybosch RA. Breeding for end-use quality: reflection on the Nebraska experience. Euphytica. 2001;119:95–100. [Google Scholar]
- Bernardo R, Yu J. Prospects for genome-wide selection for quantitative traits in maize. Crop Sci. 2007;47:1802–1090. [Google Scholar]
- Blanc G, Charcosset A, Mangin B, Gallais A, Moreau L. Connected populations for detecting quantitative trait loci and testing for epistasis: an application in maize. Theor Appl Genet. 2006;113:206–224. doi: 10.1007/s00122-006-0287-1. [DOI] [PubMed] [Google Scholar]
- Buckler ES, Holland JB, Bradbury PJ, Acharya CB, Brown PJ, Browne C, et al. The genetic architecture of maize flowering time. Science. 2009;325:714–718. doi: 10.1126/science.1174276. [DOI] [PubMed] [Google Scholar]
- Chen J, Chen Z. Extended Bayesian information criterion for model selection with large model spaces. Biometrika. 2008;95:759–771. [Google Scholar]
- Cooper M, van Eeuwijk FA, Hammer GL, Podlich DW, Messina C. Modeling QTL for complex traits: detection and context for plant breeding. Curr Opin Plant Biol. 2009;12:231–240. doi: 10.1016/j.pbi.2009.01.006. [DOI] [PubMed] [Google Scholar]
- Crossa J, de los Campos G, Perez P, Gianola D, Burgueno J, Araus JL, et al. Prediction of genetic values of quantitative traits in plant breeding using pedigrees and molecular markers. Genetics. 2010;186:713–724. doi: 10.1534/genetics.110.118521. [DOI] [PMC free article] [PubMed] [Google Scholar]
- de Bakker PIW, Yelensky R, Peér I, Gabriel SB, Daly JJ, Alshuler D. Efficiency and power in genetic association studies. Nat Genet. 2005;37:1217–1223. doi: 10.1038/ng1669. [DOI] [PubMed] [Google Scholar]
- de los Campos G, Gianola D, Rosa GJM. Reproducing kernel Hilbert spaces regression: a general framework for genetic evaluation. J Anim Sci. 2009b;87:1883–1887. doi: 10.2527/jas.2008-1259. [DOI] [PubMed] [Google Scholar]
- de los Campos G, Naya H, Gianola D, Crossa J, Legarra A, Manfredi E, et al. Predicting quantitative traits with regression models for dense molecular markers and pedigree. Genetics. 2009a;182:375–385. doi: 10.1534/genetics.109.101501. [DOI] [PMC free article] [PubMed] [Google Scholar]
- Dudley JW. Epistatic interactions in crosses of Illinois high oi X Illinois low oil and of Illinois high protein X Illinois low protein corn Strains. Crop Sci. 2008;48:59–68. [Google Scholar]
- Dudley JW, Johnson GR. Epistatic models improve prediction of performance in corn. Crop Sci. 2009;49:763–770. [Google Scholar]
- Efron B, Hastie T, Johnstone I, Tibshirani R. Least angle regression. Ann Stat. 2004;32:407–499. [Google Scholar]
- Fan J, Lv J. Sure independence screening for ultra-high dimensional feature space (with discussion) J R Stat Soc Series B Stat Methodol. 2008;70:849–911. doi: 10.1111/j.1467-9868.2008.00674.x. [DOI] [PMC free article] [PubMed] [Google Scholar]
- Gianola D, van Kaam JBCHM. Reproducing kernel Hilbert spaces regression methods for genomic assisted prediction of quantitative traits. Genetics. 2008;178:2289–2303. doi: 10.1534/genetics.107.084285. [DOI] [PMC free article] [PubMed] [Google Scholar]
- González-Camacho JM, de los Campos G, Pérez P, Gianola D, Cairns JE, et al. Genome-enabled prediction of genetic values using radial basis function neural networks. Theor Appl Genet. 2012;125:759–771. doi: 10.1007/s00122-012-1868-9. [DOI] [PMC free article] [PubMed] [Google Scholar]
- Gonzalez-Recio O, Gianola D, Long N, Wiegel K, Rosa GJ, Avendaño S. Non parametric methods for incorporating genomic information into genetic evaluation: an application to mortality in broilers. Genetics. 2008;178:2305–2313. doi: 10.1534/genetics.107.084293. [DOI] [PMC free article] [PubMed] [Google Scholar]
- Hayes BJ, Bowman PJ, Chamberlain AJ, Goddard ME. Genomic Selection using low-density marker panels. Genetics. 2009;182:343–353. doi: 10.1534/genetics.108.100289. [DOI] [PMC free article] [PubMed] [Google Scholar]
- Hu Z, Li Y, Song X, Han Y, Cai X, Xu S, et al. Genomic value prediction for quantitative traits under the epistatic model. BMC Genet. 2011;12:15. doi: 10.1186/1471-2156-12-15. [DOI] [PMC free article] [PubMed] [Google Scholar]
- Jannink J-L, Lorenz AJ, Iwata H. Genomic selection in plant breeding: from theory to practice. Brief Funct Genomics. 2010;9:166–177. doi: 10.1093/bfgp/elq001. [DOI] [PubMed] [Google Scholar]
- Kang HM, Zaitlen NA, Wade CM, Kirby A, Heckerman D, Daly MJ, et al. Efficient control of population structure in model organism association mapping. Genetics. 2008;178:1709–1723. doi: 10.1534/genetics.107.080101. [DOI] [PMC free article] [PubMed] [Google Scholar]
- Lorenz AJ, Chao S, Asoro FG, Heffner EL, Hayashi T, Iwata H, et al. Genomic selection in plant breeding: knowledge and prospects. Adv Agron. 2011;110:77–123. [Google Scholar]
- Lorenzana R, Bernardo R. Accuracy of genotypic value predictions for marker-based selection in biparental plant populations. Theor Appl Genet. 2009;120:151–161. doi: 10.1007/s00122-009-1166-3. [DOI] [PubMed] [Google Scholar]
- Malmberg RL, Held S, Waits A, Mauricio R. Epistasis for fitness-related quantitative traits in Arabidopsis thaliana grown in the field and in the greenhouse. Genetics. 2005;171:2013–2027. doi: 10.1534/genetics.105.046078. [DOI] [PMC free article] [PubMed] [Google Scholar]
- Malmberg RL, Mauricio R. QTL-based evidence for the role of epistasis in evolution. Genet Res. 2005;86:89–95. doi: 10.1017/S0016672305007780. [DOI] [PubMed] [Google Scholar]
- Meuwissen THE, Hayes BJ, Goddard ME. Prediction of total genetic values using genome-wide dense marker maps. Genetics. 2001;157:1819–1829. doi: 10.1093/genetics/157.4.1819. [DOI] [PMC free article] [PubMed] [Google Scholar]
- Phillips PC. Epistasis-the essential role of gene interactions in the structure and evolution of genetic systems. Nat Rev Genet. 2008;9:855–867. doi: 10.1038/nrg2452. [DOI] [PMC free article] [PubMed] [Google Scholar]
- Piepho HP. Ridge regression and extensions for genome-wide selection in maize. Crop Sci. 2009;49:1165–1176. [Google Scholar]
- Price AL, Patterson MJ, Plenge RM, Weinblatt ME, Shadick NA, Reich D. Principal components analysis corrects for stratification in genome-wide association studies. Nat Genet. 2006;38:904–909. doi: 10.1038/ng1847. [DOI] [PubMed] [Google Scholar]
- Rinaldo A, Silviu-Alin Bacanu B, Devlin B, Sonpar V, Wasserman L, Roeder K. Characterization of multilocus linkage disequilibrium. Genet Epidemiol. 2005;28:193–206. doi: 10.1002/gepi.20056. [DOI] [PubMed] [Google Scholar]
- Stich B, Möhring J, Piepho HP, Heckenberger M, Buckler ES, Melchinger AE. Comparison of mixed-model approaches for association mapping. Genetics. 2008;178:1745–1754. doi: 10.1534/genetics.107.079707. [DOI] [PMC free article] [PubMed] [Google Scholar]
- Tian F, Bradbury PJ, Brown PJ, Hung H, Sun Q, Flint-Garcia S, et al. Genome-wide association study of leaf architecture in the maize nested association mapping population. Nat Genet. 2011;43:159–162. doi: 10.1038/ng.746. [DOI] [PubMed] [Google Scholar]
- Tibshirani R. Regression shrinkage and selection via the LASSO. J R Stat Soc Series B Stat Methodol. 1996;58:267–288. [Google Scholar]
- Toosi A, Fernando RL, Dekkers JC. Genomic selection in admixed and crossbred populations. J Anim Sci. 2009;88:32–46. doi: 10.2527/jas.2009-1975. [DOI] [PubMed] [Google Scholar]
- van Raden PM, Van Tassell CP, Wiggans GR, Sonstegard TS, Schnable RD, Taylor J, et al. Invited review: reliability of genomic predictions for North American Holstein bulls. J Dairy Sci. 2008;92:16–24. doi: 10.3168/jds.2008-1514. [DOI] [PubMed] [Google Scholar]
- Wang D, Eskridge KM, Crossa J. Identifying QTLs and epistasis in structured plant populations using adaptive mixed LASSO. J Agric Biol Environ Stat. 2011;16:170–184. [Google Scholar]
- Wu J, Delvin B, Ringquist S, Trucco M, Roeder K. Screening and clean: a tool for identifying interactions in genome-wide association studies. Genet Epidemiol. 2010;34:275–285. doi: 10.1002/gepi.20459. [DOI] [PMC free article] [PubMed] [Google Scholar]
- Xu S. An empirical Bayes method for estimating epistatic effects of quantitative trait loci. Biometrics. 2007;63:513–521. doi: 10.1111/j.1541-0420.2006.00711.x. [DOI] [PubMed] [Google Scholar]
- Xu S, Jia Z. Genomewide analysis of epistatic effects for quantitative traits in barley. Genetics. 2007;175:1955–1963. doi: 10.1534/genetics.106.066571. [DOI] [PMC free article] [PubMed] [Google Scholar]
- Zou H. The adaptive LASSO and its oracle properties. J Am Stat Assoc. 2006;101:1418–1429. [Google Scholar]