

Abstract
We show that a mobile phone can serve as an accurate monitor for several physiological variables, based on its ability to record and analyze the varying color signals of a fingertip placed in contact with its optical sensor. We confirm the accuracy of measurements of breathing rate, cardiac R-R intervals, and blood oxygen saturation, by comparisons to standard methods for making such measurements (respiration belts, ECGs, and pulse-oximeters, respectively). Measurement of respiratory rate uses a previously reported algorithm developed for use with a pulse-oximeter, based on amplitude and frequency modulation sequences within the light signal. We note that this technology can also be used with recently developed algorithms for detection of atrial fibrillation or blood loss.
Index Terms: non-invasive monitoring, telemonitoring, heart rate variability (HRV), breathing rate, oxygen saturation
I. Introduction
There is a need for low-cost physiological monitoring solutions that are easy to use, accurate, and can be used in the home or ambulatory settings. Smart phones are becoming more popular, more powerful and have a variety of sensors available to capture information from the outside world, process the data in real-time, and transfer information remotely using wireless communications. These factors make smart phones an ideal option as a “take-anywhere” physiological monitor without the need for additional hardware, and their potential has been explored for many medical telemonitoring applications [1, 2].
Optical video monitoring of the skin with a digital camera contains information related to the subtle color changes caused by the cardiac signal and can be seen to contain a pulsatile signal [3, 4]. Given illumination of the area with a white LED mobile phone flash, this type of imaging can be described as reflection photoplethysmographic (PPG) imaging. Jonathan et al. showed the potential to extract the heart rate (HR) signal from a sequence of video images [4, 5], and Pelegris et al. compared HR measurements using a mobile phone with those made using a standard pulse-oximeter [6]. An application currently exists on the Android Market to obtain HR using the optical video recordings [7]. The potential of monitoring the dynamics in the HR signal and extracting additional vital physiological parameters from the optical recordings has not been fully explored. It is known that the dynamics of the HR signal that can be captured by PPG contain information that can be used to detect such physiological conditions as atrial fibrillation, blood loss, and cardiac autonomic function [8–12].
In the present letter, we explore the potential that the color change signal detected by a mobile phone has for non-invasively assessing physiological parameters other than HR. We first look at whether the dynamics in the continuous HR signal are representative of those found by standard electrocardiogram (ECG) measurements. We then examine whether the breathing rate can be estimated from the dynamics of the optically recorded pulse signal using a previously published algorithm [13]. Finally, we investigate whether changes in oxygen saturation (SpO2) impact the mobile phone optical measurements by comparing with measurements obtained using a commercial pulse-oximeter.
II. Methods
A. Data Collection
All experiments were approved by the Institutional Review Board of Worcester Polytechnic Institute. Spontaneous finger color changes were recorded using a Motorola Droid® (Motorola Mobility, Inc.) mobile phone. The palmar side of the left index finger was placed over the camera lens with the flash turned on. Subjects were instructed to rest a finger on the camera lens without pressing down with additional force, and to keep their finger still to reduce any motion artifacts. Videos were recorded with 720×480 pixel resolution at a sampling rate of 24.99 fps in 3gpp file format. The 3gpp videos were converted to Audio-Video Interleave (AVI) format at 720×480 pixel resolution and 25 fps using Pazera Free 3gp to AVI Converter 1.3 (http://www.pazera-software.com/). All further analysis was performed on the AVI videos in Matlab R2010b (The Mathworks Inc.) as described in II.B.
Experiment to detect heart rate and respiration rate
ECG recordings were made with an HP 78354A acquisition system using a standard 5-lead electrode configuration. A respiration belt was attached around a subject’s chest to monitor breathing rate (Respitrace Systems, Ambulatory Monitoring Inc.). Respiratory and ECG recordings were saved using LabChart software (ADInstruments) at a sampling rate of 400 Hz.
Data were recorded during spontaneous breathing for a single subject. Data collection was initiated as follows: (1) initiate mobile phone video recording, (2) start recordings of ECG and respiration trace 10 seconds after initiation of mobile phone recording, and (3) set mobile phone down and place subject’s left index finger over camera lens. This procedure allowed for alignment of data from the video, ECG, and respiratory trace to within 1 second of the start of the video.
Metronome breathing experiments were performed on a single subject with rates set at 0.2, 0.3, and 0.4 Hz (12, 18, and 24 Beats per Minute (BPM)). The subject was asked to inhale with each beat of the metronome. Metronome recordings were made for 2 minutes at each rate.
Experiment to measure oxygen saturation
Breath holding experiments were performed to assess the impact of reduced oxygen saturation on the optical recordings of two subjects. A commercial reflectance pulse-oximeter (Radical SET™, Masimo) was placed on the left ring finger to record SpO2 at a sampling rate of 1 Hz. The mobile phone camera lens was placed underneath the subjects’ left index fingertip. A black cloth was placed around the finger on the camera lens to isolate the sensor from light emanating from the commercial pulse-oximeter. The data files were aligned by starting the data logging of the pulse-oximeter by verbal command after the mobile phone recording started and using the audio file to determine the initiation time point.
Subjects were asked to breathe normally for approximately 30 seconds, exhale, and then to hold their breath until they felt discomfort. Two breath holding periods were recorded for each subject.
B. Parameter Extraction
For experiments assessing HR, heart rate variability (HRV), and respiration rate, only the green band from the RGB video recordings was used. A 50×50 pixel average of a region on the green video signal at each frame was made for the green band. This signal is from here on referred to as GREEN.
R-wave peak detection from the ECG signal and beat detection from the GREEN signal were performed using custom algorithms. Beat-beat intervals were computed, and resampled to 4 Hz by fitting a cubic spline to obtain the continuous HR for each signal (HRECG and HRGREEN). The power spectral density (PSD) of HR was computed using the Welch periodogram method.
True respiration rate was found by computing the PSD of the respiration trace signal and finding the frequency at the maximum amplitude. Respiration rates from the GREEN signals were found using the Variable Frequency Complex Demodulation (VFCDM) method for respiration rate detection, described in detail in [13].
Relative SpO2 measurements were made by comparing the red and blue bands, where the blue band is representative of the infrared wavelength used in traditional pulse-oximeter SpO2 calculations [14]. The standard deviations of the red and blue bands at each time point were used as the AC signals. The DC components were computed as the red and blue band mean intensities at each time point. A 10 sec moving average window was then applied to the AC and DC components. Relative oxygen saturation was then computed as in eq. (1):
| (1) |
We estimated the A and B parameters for each subject by setting SpO2 in (1) to the commercial pulse-oximeter SpO2 value and finding the best-fit linear equation with the Matlab Curve Fitting Toolbox.
III. Results
A. Heart Rate and Heart Rate Variability Analysis
A section of an example GREEN signal obtained during spontaneous breathing is shown in Fig. 1a. The pulse signal is similar to a traditional PPG signal obtained from a pulse-oximeter. Peak detection was performed to identify the HR signal, shown in Fig. 1b along with that obtained from an ECG after R-wave peak detection. The mean±SD was 92.2±5.3 for HRECG and 92.3±5.9 for HRGREEN.
Fig. 1.
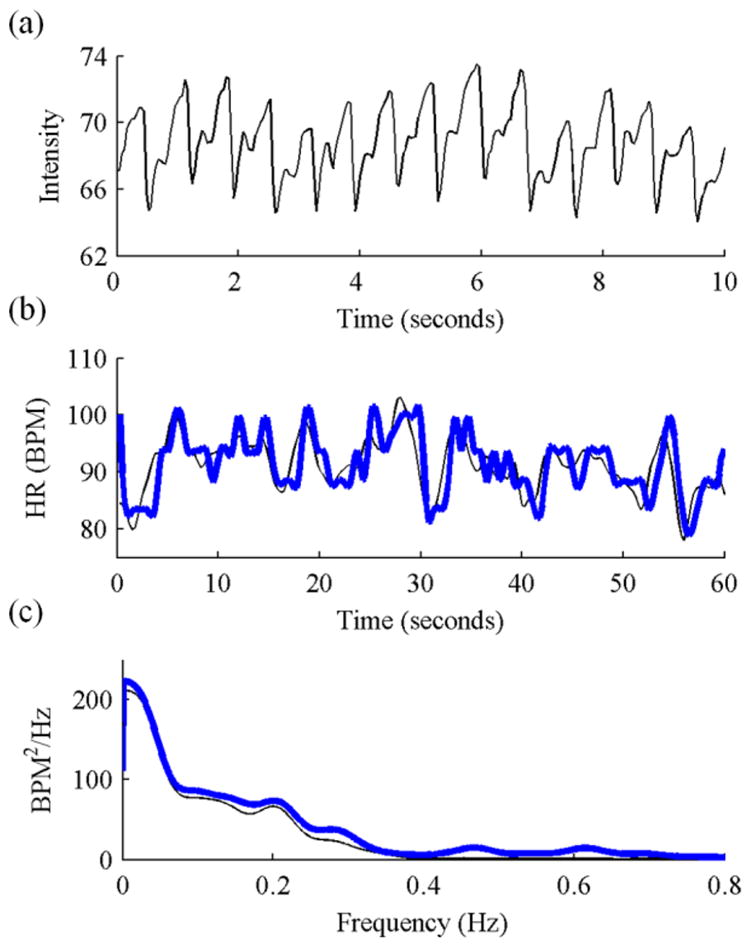
(a) Example green band PPG signal obtained after averaging a 50×50 pixel region. (b) Example HRECG (thin black line) and HRGREEN (thick blue line) during spontaneous breathing. (c) Example HRV plots from ECG (thin black line) and GREEN (thick blue line). Additional high-frequency noise (>0.4 Hz) is present in the GREEN signal.
The dynamics of the HR signals shown in Fig. 1.b were assessed by frequency analysis (Fig. 1c). The dominant peak on both signals is seen to be at a low frequency <0.1 Hz. A second peak is seen on both signals in the range usually associated with variations in sympathetic stimulation of the heart (0.04 – 0.15 Hz), and a third peak at approximately 0.2 Hz is representative of the respiration rate. Additional high frequency components are seen in HRGREEN compared to HRECG, possibly caused by the low sampling frequency of the mobile phone recording resulting in suboptimal beat detection.
B. Respiration Rate Detection
Amplitude modulation (AM) and frequency modulation (FM) sequences were extracted as described in [13] and used to estimate the breathing rate (Fig. 2a&b). Breathing rates were confirmed by taking the PSD of the respiration trace during 3 periods of metronome breathing recorded with the metronome set at 0.2, 0.3, and 0.4 Hz. Breathing rates from the respiration trace and GREEN signal using the FM sequence were estimated at the three metronome rates as 0.18 and 0.16, 0.30 and 0.32, and 0.40 and 0.38 Hz, respectively. The PSDs of the FM sequence and respiration trace for the three breathing rates are shown in Fig. 2c.
Fig. 2.

(a) AM and (b) FM sequences obtained from time-frequency analysis of the GREEN cardiac signal. (c) PSD of FM sequence (thick lines) and respiration trace signal (thin dashed lines) during metronome breathing at 0.2 (black), 0.3 (red), and 0.4 (blue) Hz.
C. Oxygen Saturation Monitoring
The ratio of RED and BLUE in eq. (1) was computed and the A and B parameters were estimated for each subject using the commercial pulse-oximeter SpO2 values as a reference. It can be observed in Fig. 3a&b that our computed SpO2 value obtained from the mobile phone recording appears to correlate with SpO2 decreases monitored with the commercial pulse-oximeter. For the subject in Fig. 3a, a minimum SpO2 level of 84% was recorded from the commercial pulse-oximeter and a minimum of 86% was computed from the optical recording using eq. (1) after linear curve fitting. For the subject in Fig. 3b, a minimum SpO2 level of 77% was reached from the commercial pulse-oximeter and a minimum of 81% was computed with eq. (1).
Fig. 3.
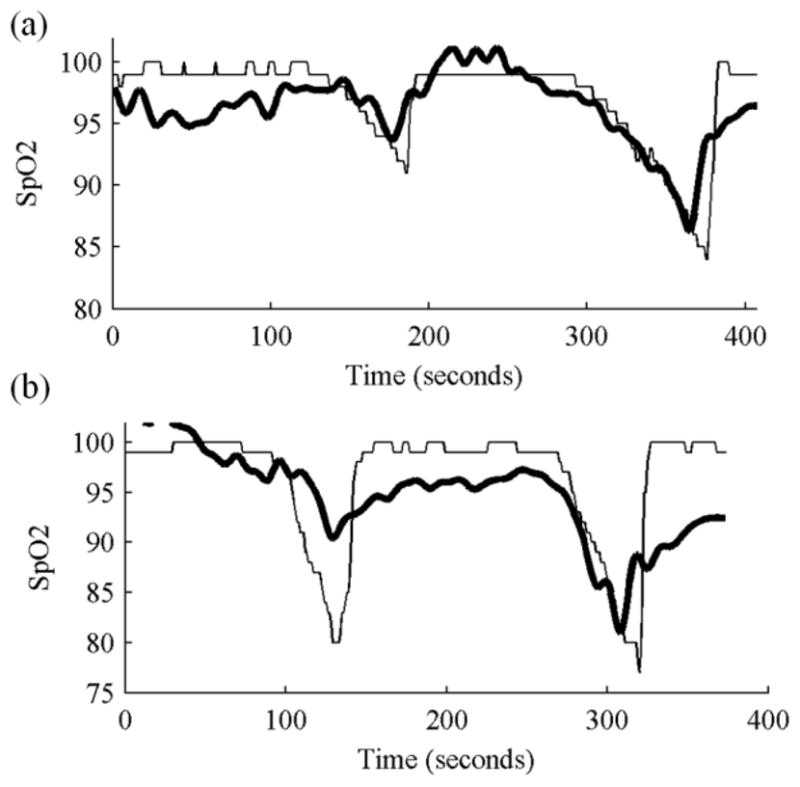
Oxygen saturation measured by a commercial pulse-oximeter (thin black line) and computed using the model shown in eq. (1) from RED and BLUE band signals obtained from a mobile phone camera (thick black line) for two subjects.
IV. Discussion
We have shown that the technology available in a standard mobile phone camera has the potential to be used as an accurate multi-parameter physiological monitor. Estimation of HR and breathing rates using intensity changes in the green band of the video signal provided results that were accurate compared to their respective standards. Breathing rates were monitored over a normal physiological range of 12 – 24 BPM. HRV measurements derived from an ECG and the mobile phone were also shown to agree favorably. Decreases in oxygen saturation from the breath holding test (verified with a commercial pulse-oximeter) led to similar decreases in our SpO2 computation from the mobile phone data using eq. (1), demonstrating proof-of-concept for obtaining SpO2 measurements from a mobile phone digital camera.
Given the ability to monitor cardiac dynamics from a mobile phone video recording allows the application of other algorithms that have been developed for pulse-oximeter or HR signals. We have demonstrated this potential by respiration rate detection with the VFCDM-FM method [13] and HRV analysis. Assessment of R-R intervals has recently been shown to be an accurate way of detecting episodes of atrial fibrillation [8], and the VFCDM method has recently been shown to be capable of detecting significant levels of blood volume loss from a PPG signal [9, 10]. In the present letter, the proof-of-concept we have shown opens the door to implementing these algorithms on a mobile phone platform using simply the optical recordings of the phone. One of the advantages of mobile phone monitoring is that it allows patients to make baseline measurements at any time, building a database of normal cardiac function that could allow for improved detection of disease states.
A low camera sampling rate may be a limitation for accurate measurements. It has previously been stated that heart rate variability measurements should be made with a sampling rate of 400 Hz, and the maximum sampling rate we can achieve with the Motorola Droid camera used in this study was ~25 Hz. Previous studies using built-in computer cameras at 15 Hz were resampled to 250 Hz to perform HRV analysis [15]. We performed the same analysis after resampling to 250 Hz, but found insignificant differences in the results compared to the non-resampled data (not shown). Our final measures still compare favorably with traditional ECG and pulse-oximeter derived measurements made at higher sampling rates.
For analysis of the pulse signal dynamics we utilized only the green band in this report. This is because there is high absorption by hemoglobin in the green range, and it has been demonstrated to give a stronger cardiac pulse signal than the red or blue bands during remote PPG imaging [16]. Previously, Maeda et al. showed the utility of using the green band for wearable PPG monitoring [17]. We found that the red and blue bands also contained the pulse signal, but in general the green band had stronger pulse amplitude and decreased noise. Optimization of the pixel averaging region could lead to an improved pulse signal.
We have shown that decreases in SpO2 values affect the mobile phone optical recording, but work remains to take the camera specifications into account to obtain a more accurate quantifiable measure. It will be necessary to calibrate the recordings to determine the coefficients A and B that would be required for real-time SpO2 monitoring. Traditional pulse-oximeters compute SpO2 using the ratio of red and infrared wavelengths, where the red wavelength is significantly affected by changes in oxygenated hemoglobin, but the infrared wavelength is less so and is used as a reference [14]. In the present study we have only broad red, green, and blue bands. We used the red band assuming it would be affected in the same way as a red LED and used the blue band as a reference. To take into account effects of motion and camera variance we used the standard deviation of the images as the AC component.
Motion artifacts can affect the results since there is no physical device ensuring a stable connection as is the case with pulse-oximeter clips or ECG electrodes. Therefore, it is important for the user to keep his or her finger as stationary as possible on the camera lens while measurements are being made. Recent advances in motion artifact detection in pulse-oximeter signals could be applied in real-time monitoring to ensure that only results from a quality signal are reported [18].
Although here we performed offline analysis, given the current processing power available in mobile phones (1GHz dual-core processors) the ability to perform this analysis directly on a mobile phone is conceivable.
V. Conclusion
The pulse-oximeter has become one of the most common physiological monitors used in hospitals today. Moreover, algorithms have been reported to detect atrial fibrillation, blood loss, and autonomic nervous system disorders, in addition to traditional vital sign measurements of heart rate, respiration rate, and oxygen saturation from the dynamics in a pulse-oximeter signal. We have shown that mobile phone cameras have the potential to monitor the pulsatile PPG signal. Current mobile phone technology extends beyond simply monitoring and measuring with ease for a patient; it could also be used to relay the information to medical professionals. This gives a patient the ability to carry an accurate physiological monitor anywhere, without additional hardware beyond what’s already included in many consumer mobile phones.
Acknowledgments
This work was supported by Office of Naval Research work unit N00014-08-1-0244. C.G. Scully, J. Meyer and A.M. Gorbach were supported by the Intramural Research Program of the National Institute of Biomedical Imaging and Bioengineering, NIH.
Contributor Information
Christopher G. Scully, Email: scullycg@wpi.edu, Department of Biomedical Engineering, Worcester Polytechnic Institute, Worcester, MA 01607 USA.
Jinseok Lee, Email: jinseok@wpi.edu, Department of Biomedical Engineering, Worcester Polytechnic Institute, Worcester, MA 01607 USA.
Joseph Meyer, Email: meyerjm@mail.nih.gov, National Institute of Biomedical Imaging and Bioengineering, NIH, Bethesda, MD 20892 USA.
Alexander M. Gorbach, Email: gorbacha@mail.nih.gov, National Institute of Biomedical Imaging and Bioengineering, NIH, Bethesda, MD 20892 USA.
Domhnull Granquist-Fraser, Email: dgfraser@wpi.edu, Department of Biomedical Engineering, Worcester Polytechnic Institute, Worcester, MA 01607 USA.
Yitzhak Mendelson, Email: ym@wpi.edu, Department of Biomedical Engineering, Worcester Polytechnic Institute, Worcester, MA 01607 USA.
Ki H. Chon, Email: kichon@wpi.edu, Department of Biomedical Engineering, Worcester Polytechnic Institute, Worcester, MA 01607 USA.
References
- 1.Kyriacou EC, Pattichis CS, Pattichis MS. An overview of recent health care support systems for eEmergency and mHealth applications. Conf Proc IEEE Eng Eng Med Biol Soc. 2009:1246–1249. doi: 10.1109/IEMBS.2009.5333913. [DOI] [PubMed] [Google Scholar]
- 2.Boulos M, Wheeler S, Tavares C, Jones R. How smartphones are changing the face of mobile and participatory healthcare: an overview, with example from eCAALYX. BioMedical Engineering OnLine. 2011;10(1):24. doi: 10.1186/1475-925X-10-24. [DOI] [PMC free article] [PubMed] [Google Scholar]
- 3.Poh MZ, McDuff DJ, Picard RW. Non-contact, automated cardiac pulse measurements using video imaging and blind source separation. Opt Express. 2010;18(10):10762–10774. doi: 10.1364/OE.18.010762. [DOI] [PubMed] [Google Scholar]
- 4.Jonathan E, Martin L. Investigating a smartphone imaging unit for photoplethysmography. Physiological Measurement. 2010;31(11):N79. doi: 10.1088/0967-3334/31/11/N01. [DOI] [PubMed] [Google Scholar]
- 5.Jonathan E, Leahy MJ. Cellular phone-based photoplethysmographic imaging. Journal of Biophotonics. 2011;4(5):293–296. doi: 10.1002/jbio.201000050. [DOI] [PubMed] [Google Scholar]
- 6.Pelegris P, Banitsas K, Orbach T, Marias K. A novel method to detect Heart Beat Rate using a mobile phone. Conf Proc IEEE Eng Eng Med Biol Soc. 2010:5488–5491. doi: 10.1109/IEMBS.2010.5626580. [DOI] [PubMed] [Google Scholar]
- 7.Instant Heart Rate. Azumio Inc; 2011. [Google Scholar]
- 8.Dash S, Chon K, Lu S, Raeder E. Automatic Real Time Detection of Atrial Fibrillation. Annals of Biomedical Engineering. 2009;37(9):1701–1709. doi: 10.1007/s10439-009-9740-z. [DOI] [PubMed] [Google Scholar]
- 9.Selvaraj N, Shelley K, Silverman D, et al. A novel approach using time-frequency analysis of pulse-oximeter data to detect progressive hypovolemia in spontaneously breathing healthy subjects. Biomedical Engineering, IEEE Transactions on. 2011;PP(99):1–1. doi: 10.1109/TBME.2011.2144981. [DOI] [PubMed] [Google Scholar]
- 10.Scully CG, Selvaraj N, Romberg FW, et al. Detection of 900 ml blood withdrawal by amplitude modulation analysis of the photoplethysmographic waveform. Submitted. [Google Scholar]
- 11.Freeman R. Assessment of cardiovascular autonomic function. Clinical Neurophysiology. 2006;117(4):716–730. doi: 10.1016/j.clinph.2005.09.027. [DOI] [PubMed] [Google Scholar]
- 12.Lu S, Zhao H, Ju K, et al. Can Photoplethysmography Variability Serve as an Alternative Approach to Obtain Heart Rate Variability Information? Journal of Clinical Monitoring and Computing. 2008;22(1):23–29. doi: 10.1007/s10877-007-9103-y. [DOI] [PubMed] [Google Scholar]
- 13.Chon KH, Dash S, Kihwan J. Estimation of Respiratory Rate From Photoplethysmogram Data Using Time-Frequency Spectral Estimation. Biomedical Engineering, IEEE Transactions on. 2009;56(8):2054–2063. doi: 10.1109/TBME.2009.2019766. [DOI] [PubMed] [Google Scholar]
- 14.Mendelson Y. Pulse oximetry: theory and applications for noninvasive monitoring. Clin Chem. 1992 Sep 1;38(9):1601–1607. [PubMed] [Google Scholar]
- 15.Poh MZ, McDuff DJ, Picard RW. Advancements in Noncontact, Multiparameter Physiological Measurements Using a Webcam. Biomedical Engineering, IEEE Transactions on. 2010;58(1):7–11. doi: 10.1109/TBME.2010.2086456. [DOI] [PubMed] [Google Scholar]
- 16.Verkruysse W, Svaasand LO, Nelson JS. Remote plethysmographic imaging using ambient light. Opt Express. 2008;16(26):21434–21445. doi: 10.1364/oe.16.021434. [DOI] [PMC free article] [PubMed] [Google Scholar]
- 17.Maeda Y, Sekine M, Tamura T. The Advantages of Wearable Green Reflected Photoplethysmography. Journal of Medical Systems. 2009:1–6. doi: 10.1007/s10916-010-9506-z. [DOI] [PubMed] [Google Scholar]
- 18.Selvaraj N, Mendelson Y, Shelley KH, Silverman DG, Chon KH. A computational approach for the detection of motion and noise artifacts in pulse oximetry data. Submitted. [Google Scholar]