Abstract
Non-melanoma skin cancers (NMSCs) are the most common neoplasm in organ transplant recipients (OTRs). These cancers are more invasive and metastatic as compared to those developed in normal cohorts. Previously, we have shown that immunosuppressive drug, cyclosporine A (CsA) directly alters tumor phenotype of cutaneous squamous cell carcinomas (SCCs) by activating TGF-β and TAK1/TAB1 signaling pathways. Here, we identified novel molecular targets for the therapeutic intervention of these SCCs. We observed that combined blockade of Akt and p38 kinases-dependent signaling pathways in CsA-promoted human epidermoid carcinoma A431 xenograft tumors abrogated their growth by more than 90%. This diminution in tumor growth was accompanied by a significant decrease in proliferation and an increase in apoptosis. The residual tumors following the combined treatment with Akt inhibitor triciribine and p38 inhibitors SB-203580 showed significantly diminished expression of phosphorylated Akt and p38 and these tumors were less invasive and highly differentiated. Diminished tumor invasiveness was associated with the reduced epithelial–mesenchymal transition as ascertained by the enhanced E-cadherin and reduced vimentin and N-cadherin expression. Consistently, these tumors also manifested reduced MMP-2/9. The decreased p-Akt expression was accompanied by a significant reduction in p-mTOR. These data provide first important combinatorial pharmacological approach to block the pathogenesis of CsA-induced highly aggressive cutaneous neoplasm in OTRs.
Keywords: OTR, SCC, Cyclosporine A, mTOR, p38, Akt
Introduction
Organ transplant recipients (OTRs) are prone to increased risk for developing various cancers including skin cancers such as basal cell carcinomas (BCCs) and squamous cell carcinomas (SCCs). SCCs are the most frequently diagnosed malignancies in OTRs compared to normal cohorts [1–3]; their incidence is more than 65-fold higher in OTRs [2, 4–6]. The chronic immunosuppression, age and light exposure are often correlated with increased cancer risk in OTRs. These tumors affect more than 40% of OTRs and are responsible for significant morbidity and increased mortality rate in this population [1–8]. The mechanism of the increased tumor risk involves decreased immunosurveillance, impaired DNA repair and/or other direct oncogenic effects of immunosuppressive drugs [9, 10].
Cyclosporine A (CsA) is a most common and powerful immunosuppressive agent which has shown success in recipients of kidney, liver and bone marrow transplants [11]. Apart from this, it has also shown clinical importance in treatment of some autoimmune disorders [12]. It belongs to the class of calcineurin inhibitors (CNIs) and mediates its immunosuppressive effects through inactivation of calcineurin [13]. Inhibition of calcineurin suppresses the expression of interleukin (IL)-2 through the nuclear factor of activated T cells (NFAT) pathway [14]. CNI-based immunosuppressive regimens such as CsA and tacrolimus have been associated with greater incidence of skin cancer [15]. We earlier demonstrated a role of TGF-β signaling pathway in the formation of larger and aggressive tumors in CsA-treated A431 human epidermoid xenograft murine model involving an enhancement of epithelial–mesenchymal transition (EMT) [16]. CsA enhanced the tumor growth of subcutaneously injected colon adenocarcinoma cells in immunodeficient mice bearing a heart allograft [17]. We also showed that CsA alters the functioning of mitochondria and blocks the mitochondrial permeability pore (MPP) opening, thereby interfering with the ability of these cells to undergo apoptosis [18]. Additional studies from our laboratory demonstrated that CsA treatment enhances the growth of SCCs by activating nuclear factor κB (NF κB) and p38 MAP kinase pathways and regulating tumor growth factor β-activated kinase 1 (TAK1) [19].
Here, we have identified Akt and p38 as potential novel molecular targets for the therapeutic intervention of CsA-mediated aggressive SCCs that occur in OTRs. Combined blockade of Akt and p38 signaling pathways in these tumors reduced their growth considerably which was accompanied by a significant decrease in proliferation and a concomitant increase in apoptosis. Restoration of the epithelial phenotype was noted in tumors excised from mice receiving the combined treatment with Akt/p38 inhibitors. The mechanism of this inhibition was related to diminution of mTOR signaling pathway.
Materials and methods
Chemicals, reagents and antibodies
Triciribine (EMD chemicals), SB-203580 (LC-laboratories), antibodies against p-Akt (Ser473), pMAPKAP-2, PCNA, MMP-2, MMP-9 (Santa Cruz Biotechnology, Inc.), N-cadherin, p-mTOR, Bcl-2, Bax (Cell Signaling Technology, Inc.), Cyclin D1 (Thermo Scientific), and secondary anti-mouse, anti-goat and anti-rabbit antibodies (Peirce Biotechnology, Inc.) were purchased.
Cells
Human epidermoid carcinoma A431 (CR-2592) cells were obtained from the American Type Culture Corporation (Manassas, VA, USA). Cells were cultured in Dulbecco’s modified Eagle’s medium (DMEM) supplemented with 10% fetal bovine serum (FBS), 100 U/ml of penicillin, and 100 μg/ml of streptomycin at 37 °C in a CO2 humidified chamber.
Animal study
Female Athymic NCr nude mice (3–5 weeks old) were purchased from NCI-Frederick Animal Production Program (Frederick, MD, USA) and were kept under conditions of constant temperature (23 ± 2°C) and humidity (55 ± 15%) with a 12-hour light/dark cycle and had free access to food and water. As shown in Suppl. Fig. 1, animals were inoculated subcutaneously on their right and left flanks, each with A431 human epidermoid carcinoma cells (2.5 × 10⁶ in 100 μl PBS). These animals were randomly divided into five groups of ten mice each and subjected to following treatment protocol with various agents administered intraperitoneally (I.P) for a period of 2 weeks. Group I received 200 μl of PBS (vehicle) served as a control; group II received CSA (20 mg/kg in PBS); group III received CSA (20 mg/kg in PBS) + SB-203580 (10 mg/kg); group IV received CSA (20 mg/kg in PBS) + triciribine (1 mg/kg) and group V received CSA (20 mg/kg in PBS) + SB-203580 (10 mg/kg) + triciribine (1 mg/kg). Tumors were measured twice a week with a digital microcaliper, and tumor volume was calculated as mean of length × width × height/mouse. Fifteen days after cell inoculation, animals were sacrificed and their tumors were excised. Portions of each tumor were either preserved in formalin for histological analysis/immunofluorescence or snap frozen in liquid nitrogen for western blot studies. This animal study was approved by our Institutional Animal Care and Use Committee.
Western blot analysis
Tissue lysates were prepared in ice-cold lysis buffer (50mM Tris–HCl (pH 7.5), 1% Triton X-100, 0.25% sodium fluoride, 10 mM β-glycerol phosphate, 1 mM EDTA, 5 mM sodium pyrophosphate, supplemented with complete protease inhibitor cocktail (Roche Molecular Biochemicals), 10 mM DTT, 0.5 mM sodium orthovanadate and phosphatase inhibitors) using PowerGen 1000 homogenizer (Fischer Scientific). The lysates were centrifuged at 10,000 r.p.m for 15 min at 4 °C. The supernatant obtained was used for further analysis as described earlier [19].
Immunofluorescent staining
Tumor tissues were excised and fixed in cold formalin solution overnight at 4 °C. These sections were dehydrated by passing through a gradient of 70% ethanol, 95% ethanol and 100% ethanol and were embedded in paraffin wax and sectioned onto slides. Sections measuring 5 μM were cut using a microtome and were deparaffinized in xylene, rehydrated and treated with Vector antigen unmasking solution according to the manufacturer’s protocol (Vector Laboratories, Burlingame, CA, USA). To prevent the non-specific binding, slides were blocked with 2% bovine serum albumin (BSA) in phosphate-buffered saline (PBS). Primary antibodies (diluted in 2% BSA/PBS) were added and incubated overnight at 4 °C followed by incubation with Alexa Fluor conjugated anti-goat or rabbit secondary antibodies for 1 h. The slides were rinsed with PBS and mounted with mounting medium containing DAPI (Vector Laboratories). Fluorescence was immediately recorded on an Olympus EX51 microscope.
Apoptosis
Apoptosis was determined immunohistochemically by the terminal deoxynucleotidyl transferase-mediated dUTP nick end labeling (TUNEL) assay using formalin-fixed tissues employing the In Situ Cell Death Detection Kit, POD (Roche) as per manufacturer’s instructions. Positive control was generated by the treatment of samples with DNase I.
Statistical analyses
Tumor data and western blot quantification were summarized using descriptive statistics and graphical displays. Statistical analysis was done by Student’s t test, and p < 0.05 was considered to be significant.
Results and discussion
p38 and Akt inhibitors block CsA-mediated aggressive skin neoplasia in human epidermoid carcinoma xenograft murine model
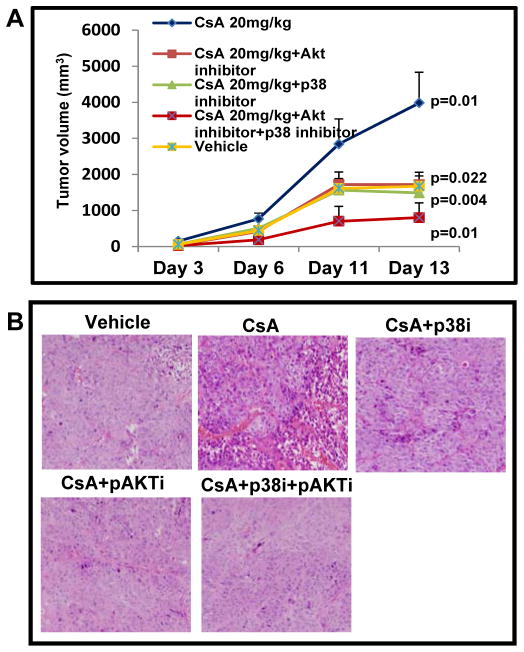
As observed earlier [16], we found that CsA treatment led to the development of larger tumors as compared to the vehicle-treated controls (Figure 1A). These tumors continued to grow beginning from day 6 to day 14. The mean tumor volume in CsA-treated mice was 3982 ± 850 as compared to 1673 ± 412 in vehicle-treated controls (p = 0.01). However, a significant reduction in tumor volumes in mice treated with SB-203580 (p = 0.004) and triciribine (p = 0.02) alone as well in combination (p = 0.01) with mean tumor volumes of 1486 ± 284, 1718 ± 344 and 802 ± 93, respectively was observed. The animals in group III, IV and V showed enormous reduction in tumor growth as compared to those in CsA (alone)-treated group. In addition, unlike the tumors isolated from CsA (only)-treatment group showing increased number of mitotic cells and poorly differentiated histology, the SB-203580 + triciribine-treated tumors were highly differentiated (Figure 1B).
Figure 1.
p38 and Akt inhibitors attenuate the Cyclosporine A-augmented growth of cutaneous SCCs in xenograft murine model. (A) Profile of tumor growth (B) Histology of tumors excised from various treatment groups.
p38 and Akt inhibitors reduced CsA-mediated proliferation and augmented apoptosis
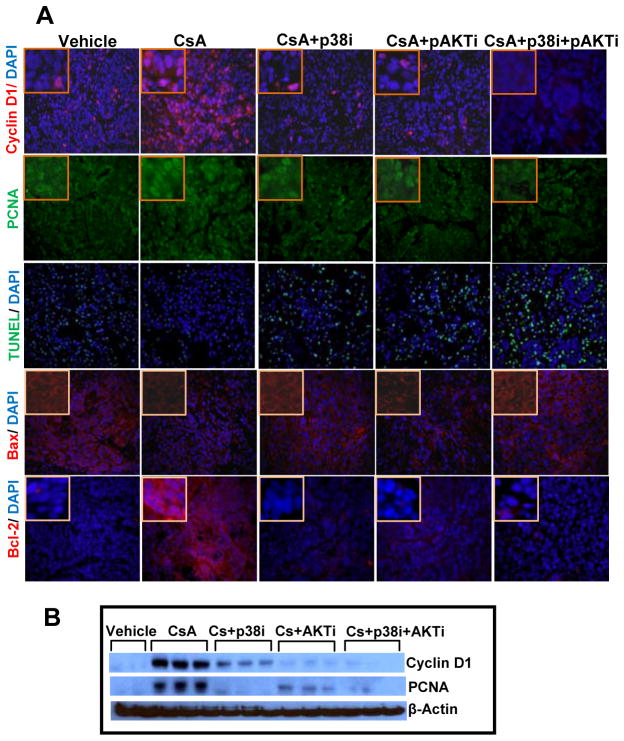
CsA treatment significantly increased the levels of proliferation markers cyclin D1 and proliferating cell nuclear antigen (PCNA) as compared to vehicle-treated control group (Figure 2A and B) confirming our earlier observation [16, 19]. However, administration of inhibitors of p38 or Akt alone or in combination to CsA-treated animals significantly decreased the expression of these proteins (Figure 2A and B and Suppl. Fig. 2). These data suggest that the combined treatment with SB-203580 + triciribine was more effective in decreasing these proliferation marker proteins as compared to single agent treatment. We also found increased number of TUNEL positive cells in the combined treatment group as shown in figure 2A. This was consistent with an increase in pro-apoptotic protein Bax and a decrease in anti-apoptotic protein Bcl-2 (Figure 2A).
Figure 2.
p38 and Akt inhibitors block proliferation and induce apoptosis. (A) Immunofluorescence staining of tumors excised from various treatment groups showing expression of proliferation-related biomarkers cyclin D1 and PCNA, and apoptosis related biomarkers Bcl-2, Bax and TUNEL staining. (B) Western blot analysis showing effects of single and combined treatments with p38 and Akt inhibitors on the expression of cyclin D1 and PCNA.
p38 and Akt inhibitors block molecular targets involved in cell survival pathway
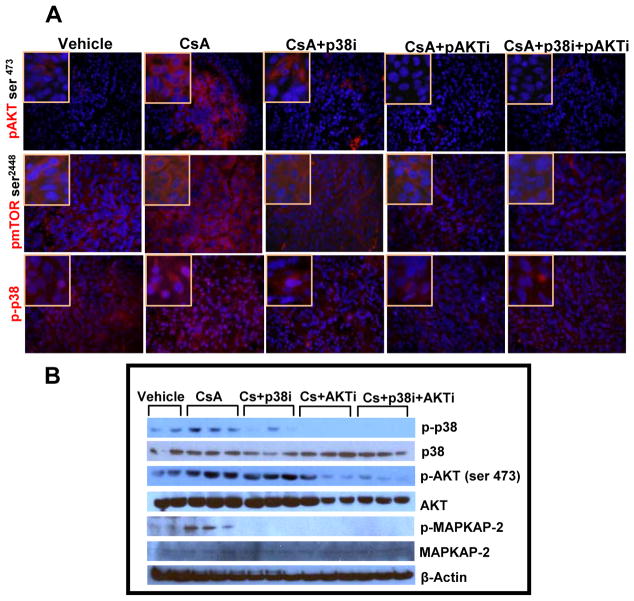
The prototypic pathways that promote cell survival are the phosphoinositide 3′-kinase/Akt/mammalian target of rapamycin (mTOR) pathways, which are constitutively activated in many cancer types including those that develop in the skin [20]. In this study, using western blot analysis and immunostaining we found increased levels of p-Akt in CsA-treated group (Figure 3A). Earlier, CsA treatment was shown to induce Akt pathway [21]. However, here we found that its inhibitor triciribine decreased p-Akt and its downstream target p-mTOR. Similar results were obtained following inhibition of p38 by SB-203580 (Figure 3A and B). Moreover, the combined inhibition of both p38 and Akt in CsA-treated animals was more effective and more significantly reduced p-Akt (p = 0.0001), p-p38 (p = 0.02) and p-mTOR as compared to CsA (alone)-treatment group (Suppl. Fig. 3). We also found reduced expression of phosphorylated MAPK-activated protein kinase-2 (p-MAPKAP-2), a downstream target of p38 in tumors treated with these inhibitors alone or in combination.
Figure 3.
Activated p38 and Akt signaling pathways are blocked by the treatment with p38 and Akt inhibitors when administered singly or in combination. (A) Immunofluorescence staining showing expression of phosphorylated p38, mTOR and Akt. (B) Western blot analysis showing effects of single and combined treatments with p38 and Akt inhibitors on the expression of total and phosphorylated p38, Akt and MAPKAP-2.
p38 and Akt inhibitors restore the epithelial phenotype by reducing EMT
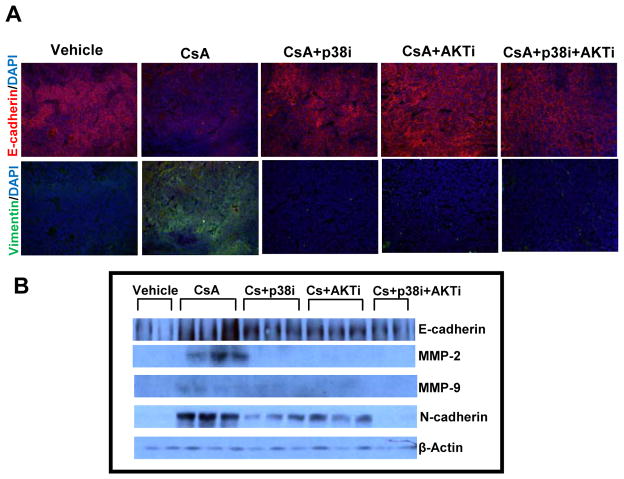
As compared to CsA (alone) treatment group, treatment of CsA-administered animals with p38 and Akt inhibitors enhanced expression of E-cadherin (p = 0.04), an epithelial marker and decreased vimentin, a mesenchymal marker (Figure 4A). N-cadherin, another mesenchymal marker was also decreased significantly (p = 0.009) following treatment with these agents alone or in combination (Figure 4B and Suppl. Fig. 4). Similar decrease was noted in MMP-2 (p = 0.03) and MMP-9 (p=0.006) expression following these treatments (Figure 4B and Suppl. Fig. 4).
Figure 4.
Treatment with p38 and Akt inhibitors reduces aggressiveness of cyclosporine A-induced tumors as ascertained by epithelial/mesenchymal marker protiens. (A) Immunofluorescence staining showing expression of E-cadherin and vimentin. (B) Western blot analysis showing effects of single and combined treatments with p38 and Akt inhibitors on the expression of E-cadherin, N-cadherin, MMP-2 and MMP-9.
It is known that immune-suppressive drugs enhance cutaneous and other neoplasms [22]. These drugs by directly interacting with cancer cells augment their invasiveness and metastatic potential [23]. We and others have shown that the mechanisms underlying these changes involve modulation of NFAT-signaling pathways that regulate expression of multiple cytokines, cell cycle, apoptosis and differentiation related genes [16, 24]. We also showed that CsA by regulating TGFβ-dependent signaling pathway promotes EMT and modulate invasive potential of cutaneous SCCs [16]. In this regard, our studies further demonstrated an involvement of TAK1/TAB1 signaling pathway, which by regulating MAPK and Akt augment cancer cell survival [19]. Here, we demonstrated that combined inhibition of p38 and Akt signaling pathways abrogates CsA-mediated cancer progression. The mechanism by which this combination works seems to involve inhibition of proliferation and enhancement of apoptosis. It is likely that these agents together target cell survival and proliferation-related signaling pathways to attenuate the growth of these lesions. However, the exact molecular mechanism remains to be investigated. In summary, our data provide an identification of novel molecular therapeutic targets for cutaneous SCCs in OTRs. In this regard, diminution in mTOR signaling seems to be the major underlying mechanism.
Supplementary Material
Suppl. Figure 1. The summary of the treatment protocol.
Suppl. Figure 2. Western blot analysis showing effects of single and combined treatments with p38 and Akt inhibitors on the expression of cyclin D1 and PCNA. The bar diagram represents relative expression level of these proteins (cyclin D1: a=0.00001, b=0.0002, c=0.0000001, d=0.0000001, e=0.003, f=0.02; PCNA: a=0.002, b=0.001, c=0.002, d=0.0004, f=0.03). a – significant when compared to vehicle control, b, c & d- significant when compared to CsA-treated positive control, e & f- significant when compared to single treatment groups.
Suppl. Figure 3. Western blot analysis showing effects of single and combined treatments with p38 and Akt inhibitors on the expression of total and phosphorylated p38, Akt and MAPKAP-2. The bar diagram represents relative expression level of these proteins (p-AKT: a=0.03, b=0.02, d=0.0001, e=0.0008; p-p38: a=0.05, b=0.02, c=0.002, d=0.002, e=0.04; p-MAPKAP-2: a=0.04, b=0.002, c=0.002, d=0.003). a – significant when compared to vehicle control, b, c & d-significant when compared to CsA-treated positive control, e & f- significant when compared to single treatment groups.
Suppl. Figure 4. Western blot analysis showing effects of single and combined treatments with p38 and Akt inhibitors on the expression of E-cadherin, N-cadherin, MMP-2 and MMP-9. The bar diagram represents relative expression level of these proteins (E-cadherin: b=0.02, c=0.03, d=0.04; N-cadherin: a=0.008, b=0.006, c=0.007, d=0.008, e=0.05, f=0.0003; MMP-2: a=0.03, b=0.03, c=0.008, d=0.03, e=0.02; MMP-9: a=0.004, b=0.04, c=0.002, d=0.006, e=0.004, f=0.02). a – significant when compared to vehicle control, b, c & d- significant when compared to CsA-treated positive control, e & f- significant when compared to single treatment groups.
Acknowledgments
This work was supported by NIH/NCI Grant RO1 CA138998 to Dr. Athar and by the funds made available from Comprehensive Cancer Centre of UAB.
Abbreviations
- CsA
cyclosporine A
- NFκB
nuclear factor κB
- NMSC
non-melanoma skin cancer
- SCC
squamous cell carcinoma
- BCC
basal cell carcinoma
- UVB
ultraviolet B
- OTRs
organ transplant recipients
- MPP
mitochondrial permeability pore
- VEGF
vascular endothelial growth factor
- TAK1
tumor growth factor β-activated kinase1
- TAB1
TAK binding protein 1
- MMPs
matrix metalloproteinase
- mTOR
mammalian target of rapamycin
- NFAT
nuclear factor of activated T-cells
- CNI
calcineurin inhibitors
- EMT
epithelial-mesenchymal transition
- TUNEL
Terminal deoxynucleotidyl transferase dUTP nick end labeling
References
- 1.Webb MC, Compton F, Andrews PA, Koffman CG. Skin tumors post transplantation: a retrospective analysis of 28 years’ experience at a single centre. Transplant Proc. 1997;29:828–830. doi: 10.1016/s0041-1345(96)00152-2. [DOI] [PubMed] [Google Scholar]
- 2.Winkelhorst J, Brokelman W, Tiggeler R, Wobbes T. Incidence and clinical course of de novo malignancies in renal allograft recipients. Eur J Surg Oncol. 2001;27:409–411. doi: 10.1053/ejso.2001.1119. [DOI] [PubMed] [Google Scholar]
- 3.Blohme I, Larko O. Skin lesions in renal transplant recipients after 10–23 years of immunosuppressive therapy. Acta Derm Venereol. 1990;70:491–494. [PubMed] [Google Scholar]
- 4.Athar M, Walsh SB, Kopelovich L, Elmets CA. Pathogenesis of nonmelanoma skin cancers in organ transplant recipients. Arch Biochem Biophys. 2011;508:159–163. doi: 10.1016/j.abb.2011.01.004. [DOI] [PMC free article] [PubMed] [Google Scholar]
- 5.Hartevelt MM, Bouwes Bavinck JN, Koote A, Vermeer B, Vandenbroucke J. Incidence of skin cancer after renal transplantation in the Netherlands. Transplant. 1990;49:506–509. doi: 10.1097/00007890-199003000-00006. [DOI] [PubMed] [Google Scholar]
- 6.Lampros TD, Cobanoglu A, Parker F, Ratkovec R, Norman DJ, Hershberger R. Squamous and basal cell carcinoma in heart transplant recipients. J Heart Lung Transplant. 1998;17:586–591. [PubMed] [Google Scholar]
- 7.Ong CS, Keogh AM, Kossard S, Macdonald PS, Spratt PM. Skin cancer in Australian heart transplant recipients. J Am Acad Dermatol. 1999;40:27–34. doi: 10.1016/s0190-9622(99)70525-6. [DOI] [PubMed] [Google Scholar]
- 8.Euvrard S, Kanitakis J, Claudy A. Skin cancers after organ transplantation. N Engl J Med. 2003;348:1681–1691. doi: 10.1056/NEJMra022137. [DOI] [PubMed] [Google Scholar]
- 9.Martinez OM, de Gruijl FR. Molecular and immunologic mechanisms of cancer pathogenesis in solid organ transplant recipients. Am J Transplant. 2008;8:2205–2211. doi: 10.1111/j.1600-6143.2008.02368.x. [DOI] [PubMed] [Google Scholar]
- 10.Ulrich C, Schmook T, Sachse M, Sterry W, Stockfleth E. Comparative epidemologiology and pathogenic factors for nonmelanoma skin cancer in organ transplant patients. Dermatol Surg. 2004;30:622–7. doi: 10.1111/j.1524-4725.2004.30147.x. [DOI] [PubMed] [Google Scholar]
- 11.Block LH, Sutter PM, Mihatsch MJ. Cyclosporin A: Pharmacologic activity on the immune system and effects in clinical organ transplantation. J Mol Med. 1983;61:1053–1062. doi: 10.1007/BF01496465. [DOI] [PubMed] [Google Scholar]
- 12.Bach JF. The contribution of cyclosporine A to the understanding and treatment of autoimmune diseases. Transplant Proc. 1999;31:16S–18S. doi: 10.1016/s0041-1345(98)02075-2. [DOI] [PubMed] [Google Scholar]
- 13.Lauren AE, Kurtis RV, Steven KB, Marita SU, Joan MO. Cyclosporin A inhibits calcineurin/nuclear factor of activated T-cells signaling and induces apoptosis in retinoblastoma cells. Invest Ophthalmol Vis Sci. 2005;46:3782–790. doi: 10.1167/iovs.04-1022. [DOI] [PubMed] [Google Scholar]
- 14.McCaffrey PG, Luo C, Kerppola TK, Jain J, Badalian TM, Ho AM, Burgeon E, Lane WS, Lambert JN, Curran T. Isolation of the cyclosporin-sensitive T cell transcription factor NFATp. Science. 1993;262:750–754. doi: 10.1126/science.8235597. [DOI] [PubMed] [Google Scholar]
- 15.Marcén R, Galeano C, Fernández-Rodriguez A, Jiménez-Alvaro S, Teruel JL, Rivera M, Burgos FJ, Quereda C. Effects of the new immunosuppressive agents on the occurrence of malignancies after renal transplantation. Transplant Proc. 2101;42:3055–7. doi: 10.1016/j.transproceed.2010.08.002. [DOI] [PubMed] [Google Scholar]
- 16.Walsh SB, Xu J, Xu H, Kurundkar AR, Maheswari A, Grizzle WE, Timares L, Huang CC, Kopelovich L, Elmets CA, Athar M. Cyclosporine A mediates pathogenesis of aggressive cutaneous squamous cell carcinoma by augmenting epithelial-mesenchymal transition: Role of TGFβ signaling pathway. Mol Carcinog. 2011;50:516–527. doi: 10.1002/mc.20744. [DOI] [PMC free article] [PubMed] [Google Scholar]
- 17.Koehl GE, Andrassy J, Guba M, Richter S, Kroemer A, Scherer MN, Steinbauer M, Graeb C, Schlitt HJ, Jauch KW, Geissler EK. Rapamycin protects allografts from rejection while simultaneously attacking tumors in immunosuppressed mice. Transplant. 2004;77:1319–26. doi: 10.1097/00007890-200405150-00002. [DOI] [PubMed] [Google Scholar]
- 18.Tang X, Zhu Y, Han L, Kim AL, Kopelovich L, Bickers DR, Athar M. CP-31398 restores mutant p53 tumor suppressor function and inhibits UVB-induced skin carcinogenesis in mice. J Clin Invest. 2007;117:3753–64. doi: 10.1172/JCI32481. [DOI] [PMC free article] [PubMed] [Google Scholar]
- 19.Xu J, Walsh SB, Verney ZM, Kopelovich L, Elmets CA, Athar M. Procarcinogenic effects of cyclosporine A are mediated through the activation of TAK1/TAB1 signaling pathway. Biochem Biophys Res Commun. 2011;408:363–8. doi: 10.1016/j.bbrc.2011.02.039. [DOI] [PMC free article] [PubMed] [Google Scholar]
- 20.LoPiccolo J, Granville CA, Gills JJ, Dennis PA. Targeting Akt in cancer therapy. Anticancer Drugs. 2007;18:861–74. doi: 10.1097/CAD.0b013e3280cc2c6f. [DOI] [PubMed] [Google Scholar]
- 21.Han W, Ming M, He TC, He YY. Immunosuppressive cyclosporin A activates AKT in keratinocytes through PTEN suppression: implications in skin carcinogenesis. J Biol Chem. 2010;285:11369–77. doi: 10.1074/jbc.M109.028142. [DOI] [PMC free article] [PubMed] [Google Scholar]
- 22.Kuschal C, Thoms KM, Boeckmann L, Laspe P, Apel A, Schön MP, Emmert S. Cyclosporin A inhibits nucleotide excision repair via downregulation of the xeroderma pigmentosum group A and G proteins, which is mediated by calcineurin inhibition. Exp Dermatol. 2011;20:795–9. doi: 10.1111/j.1600-0625.2011.01320.x. [DOI] [PubMed] [Google Scholar]
- 23.Thoms KM, Kuschal C, Oetjen E, Mori T, Kobayashi N, Laspe P, Boeckmann L, Schön MP, Emmert S. Cyclosporin A, but not everolimus, inhibits DNA repair mediated by calcineurin: implications for tumorigenesis under immunosuppression. Exp Dermatol. 2011;20:232–6. doi: 10.1111/j.1600-0625.2010.01213.x. [DOI] [PubMed] [Google Scholar]
- 24.Wu X, Nguyen BC, Dziunycz P, Chang S, Brooks Y, Lefort K, Hofbauer GF, Dotto GP. Opposing roles for calcineurin and ATF3 in squamous skin cancer. Nature. 2010;465:368–72. doi: 10.1038/nature08996. [DOI] [PMC free article] [PubMed] [Google Scholar]
Associated Data
This section collects any data citations, data availability statements, or supplementary materials included in this article.
Supplementary Materials
Suppl. Figure 1. The summary of the treatment protocol.
Suppl. Figure 2. Western blot analysis showing effects of single and combined treatments with p38 and Akt inhibitors on the expression of cyclin D1 and PCNA. The bar diagram represents relative expression level of these proteins (cyclin D1: a=0.00001, b=0.0002, c=0.0000001, d=0.0000001, e=0.003, f=0.02; PCNA: a=0.002, b=0.001, c=0.002, d=0.0004, f=0.03). a – significant when compared to vehicle control, b, c & d- significant when compared to CsA-treated positive control, e & f- significant when compared to single treatment groups.
Suppl. Figure 3. Western blot analysis showing effects of single and combined treatments with p38 and Akt inhibitors on the expression of total and phosphorylated p38, Akt and MAPKAP-2. The bar diagram represents relative expression level of these proteins (p-AKT: a=0.03, b=0.02, d=0.0001, e=0.0008; p-p38: a=0.05, b=0.02, c=0.002, d=0.002, e=0.04; p-MAPKAP-2: a=0.04, b=0.002, c=0.002, d=0.003). a – significant when compared to vehicle control, b, c & d-significant when compared to CsA-treated positive control, e & f- significant when compared to single treatment groups.
Suppl. Figure 4. Western blot analysis showing effects of single and combined treatments with p38 and Akt inhibitors on the expression of E-cadherin, N-cadherin, MMP-2 and MMP-9. The bar diagram represents relative expression level of these proteins (E-cadherin: b=0.02, c=0.03, d=0.04; N-cadherin: a=0.008, b=0.006, c=0.007, d=0.008, e=0.05, f=0.0003; MMP-2: a=0.03, b=0.03, c=0.008, d=0.03, e=0.02; MMP-9: a=0.004, b=0.04, c=0.002, d=0.006, e=0.004, f=0.02). a – significant when compared to vehicle control, b, c & d- significant when compared to CsA-treated positive control, e & f- significant when compared to single treatment groups.


