

Abstract
OBJECTIVE
To evaluate racial/ethnic differences in pancreatic triglyceride (TG) levels and their relationship to β-cell dysfunction in humans.
RESEARCH DESIGN AND METHODS
We studied black, Hispanic, and white adults who completed three research visits: screening and an oral glucose tolerance test; frequently sampled intravenous glucose tolerance tests for evaluation of β-cell function and insulin resistance; and proton magnetic resonance spectroscopy for evaluation of pancreatic and hepatic TG levels.
RESULTS
Pancreatic TG levels were higher in Hispanics and whites than in blacks (P = 0.006). Hepatic TG levels were highest in Hispanics (P = 0.004). Compensatory insulin secretion and disposition index were higher in blacks (P = 0.003 and P = 0.024, respectively). Insulin sensitivity was comparable between Hispanics and blacks and was lower than in whites (P = 0.005). In blacks, compensatory insulin secretion increased steeply with small increments in pancreatic TG levels (R2 = 0.45, slope = 247). In whites, the range of pancreatic TG levels was higher, and the slope was less steep than in blacks (R2 = 0.27, slope = 27). In Hispanics, pancreatic TG levels were similar to those of whites, but compensatory insulin secretion was described by a combination of pancreatic and hepatic TG levels and visceral fat mass ( R2 = 0.32).
CONCLUSIONS
In a multiethnic sample of adults with mild obesity and without diabetes, we found striking ethnic differences in the levels of pancreatic TGs and in the relationship between pancreatic TGs and β-cell dysfunction. Our data implicate pancreatic TG content measured by proton magnetic resonance spectroscopy as a noninvasive novel biomarker for pancreatic β-cell dysfunction, especially in the Hispanic population.
Diet-induced obesity (1) dramatically increases the risk—by >40-fold in certain populations (2)—for type 2 diabetes. A better understanding of the underlying mechanisms by which overnutrition-induced obesity causes diabetes could lead to the discovery of novel preemptive interventions.
One putative mechanism is pancreatic steatosis with β-cell lipotoxicity (3). We define steatosis as high levels of triglyceride (TG) droplets in the cytosol of nonadipose cells and lipotoxicity as organ dysfunction caused by steatosis. It is important to note that cytosolic TG droplets are not toxic themselves but byproducts of their exaggerated metabolism are toxic and cause lipotoxic β-cell dysfunction, at least in animal models. In the Zucker diabetic fatty (ZDF) rat, a standard genetic model of obesity-related diabetes, pancreatic steatosis heralds the transition from insulin resistance with compensated hyperinsulinemia to β-cell failure and frank diabetes. In this model, excess of cytosolic TG marks excessive levels of ceramide and other toxic metabolites that activate inducible nitric oxide synthase to cause progressive β-cell apoptosis and failure (4–6). A key question is to what extent can this mechanistic hypothesis be translated to common obesity-related diabetes in humans?
Localized proton magnetic resonance spectroscopy (1H MRS) was developed as a noninvasive clinical research tool to conduct translational research testing steatosis and lipotoxicity hypotheses with precise in vivo quantification of cytosolic TGs within parenchymal cells of human skeletal muscle (7), liver (8), and heart muscle (9,10). This research has implicated skeletal muscle and liver steatosis as a cause of insulin resistance (11,12) and cardiac steatosis as a cause of obesity-related cardiomyopathy (13). More recently, we validated localized 1H MRS as a measure of pancreatic TG levels (14). Insulin-secreting β-cells cannot be differentiated from non–insulin-secreting parenchymal cells of the human pancreas with 1H MRS. However, in the ZDF rat, we documented that the accumulation of TGs in pancreatic tissue as measured by 1H MRS closely parallels the development of β-cell failure both in time course and magnitude (14). We then demonstrated that pancreatic TG content is highly reproducible when healthy human subjects are studied repeatedly and that pancreatic TG level increases with increasing stages of human obesity and glucose intolerance even before the development of type 2 diabetes (14).
The goal of this study was to test whether pancreatic TG constitutes a novel biomarker of early (prediabetic) β-cell dysfunction in human subjects representing the three major race/ethnic groups in the United States. African Americans and Hispanic Americans are known to have higher rates of type 2 diabetes than white Americans, even after adjustment for BMI (15). Moreover, Hispanic Americans are known to have higher rates of hepatic steatosis than other groups (8,12). However, ethnic differences in pancreatic steatosis—and its relationship to β-cell dysfunction—have not been studied previously.
RESEARCH DESIGN AND METHODS
Study population
We studied black, Hispanic, and white individuals 18–65 years of age. We excluded individuals with type 2 diabetes to have the opportunity to examine steatosis as a potential cause rather than a consequence of β-cell failure. Additional exclusion criteria were as follows: hypertension or other cardiovascular disease; use of medication known to alter fat metabolism (e.g., steroids, pioglitazone, metformin); weight loss within 6 months before the study; any history of pancreatic or liver disorders; daily consumption of more than two alcoholic beverages; and contraindications to magnetic resonance imaging/spectroscopy (metallic implants, claustrophobia, pregnancy, body weight <50 kg or >160 kg, or body circumference close to or exceeding the magnet bore size). The study was approved by the institutional review boards at both Cedars-Sinai Medical Center and the University of Texas Southwestern Medical Center. All subjects gave their written, informed consent to participate.
Study design
Subjects completed three research visits as follows: two at the outpatient Clinical Translational Research Center and one at the magnetic resonance imaging center. The first visit included initial screening, anthropomorphic measurements, and an oral glucose tolerance test (OGTT). The second visit included a frequently sampled intravenous glucose tolerance test (FSIVGTT) to assess β-cell function and insulin resistance. The third visit included assessment of pancreatic and hepatic steatosis with localized 1H MRS. All research visits were scheduled within a 3-week period.
Anthropometric measurements and clinical evaluation
Height and weight were measured using a stadiometer and a balance scale, respectively. Blood pressure was measured using a validated oscillometric monitor with a standardized protocol (16). After at least 5 min of rest with the subject seated and the dominant arm at heart level, five consecutive blood pressure readings were taken over 10 min, and the last three readings were averaged to obtain a mean value.
OGTT
Baseline venous blood sampling was performed for measurement of lipid profile, hemoglobin A1c, and liver enzymes. A standard 75-g OGTT was administered according to American Diabetes Association criteria (17) to evaluate glycemic status and to screen for the presence of diabetes. The test was performed at 8:30 a.m. after an overnight fast. Blood was sampled at baseline and at 2 h after glucose ingestion for measurement of fasting and postprandial glucose and insulin levels.
FSIVGTT
An FSIVGTT was performed at 8:30 a.m. after an overnight fast. Two intravenous polyethylene catheters were inserted into antecubital veins, one for infusion of glucose and regular human insulin and the other for blood sampling. A bolus of 50% glucose solution (0.3-g glucose/kg body weight) was injected at time 0, and a bolus of regular human insulin (0.03 units/kg body weight) was injected 20 min later. Blood samples were collected for determination of plasma glucose and insulin levels at −15, −10, −5, −1, 2, 3, 4, 5, 6, 8, 10, 14, 19, 22, 25, 30, 40, 50, 70, 100, 140, and 180 min. Data were analyzed using the Millennium Minimal Model software (18). A compensatory insulin secretion (acute insulin response to glucose [AIRg]) describing first-phase insulin secretion was calculated for the first 10 min after the intravenous glucose bolus. The disposition index (DI), which is the product of AIRg and insulin sensitivity (SI), DI = AIRg × SI, was used to estimate β-cell function adjusted for the prevailing SI.
Abdominal magnetic resonance imaging
The amount of subcutaneous and visceral abdominal fat was determined from a single abdominal axial image at the level between the vertebral L2 and L3 bodies (19). Image analysis was performed by a single observer blinded to the volunteer’s characteristics using Slice-O-Matic software (4.3 rev 10; Virtual Magic Inc., Montreal, Canada).
1H MRS
Pancreatic TGs and hepatic TGs were quantified using 1H MRS at 1.5 Tesla as previously described (8,14). In brief, with the volunteer in the supine position, high-resolution, perpendicular images through the abdomen were collected to locate the pancreas and the liver. Images were acquired with a breath-hold at the end of expiration. The volume for spectroscopic testing was selected with special attention to exclude any visceral fat (Fig. 1). Large volumes of interest (pancreas, 2 mL; liver, 8 mL) were used to obtain mean values of pancreatic and hepatic TGs by 1H MRS. Spectroscopic data (Fig. 1) were collected as volunteers breathed freely, and the 1H MRS signal was triggered at exhalation. Data were acquired and processed using previously described parameters (8,14).
Figure 1.

Pancreatic and hepatic steatosis. The axial abdominal magnetic resonance images (left) illustrate typical selection of the volume of interestvoxelin the pancreas and liver (white blocks on pancreas and liver images). The bar graphs illustrate pancreatic (top right) and hepatic (bottom right) TG content, expressed as fat-to-water ratio (f/w %), across race/ethnic groups. Pancreatic TG was approximately threefold higher in Hispanic and white than in black subjects (P = 0.006). In contrast, hepatic TG levels were approximately fivefold higher in Hispanic than in black subjects and approximately threefold higher than in white subjects (P = 0.004). (A high-quality color representation of this figure is available in the online issue.)
Complete spectroscopic data were obtained on 92 of 100 subjects who were eligible and enrolled. We excluded from analysis pancreatic TG data from five subjects and hepatic TG data from three other subjects because of distortion induced by poorly compensated abdominal motion.
Biochemical analyses
Plasma glucose, plasma TGs, cholesterol and HDL cholesterol, alanine transaminase, and aspartate transaminase concentrations were determined by enzymatic colorimetric assays using a Chemistry Analyzer Model ATAC 8000 (Elan Diagnostic Co., Brea, CA) (20). LDL cholesterol levels were calculated using the Friedewald equation (21). Plasma insulin was quantified by a paramagnetic particle chemiluminescent immunoassay using the Beckman Immunoassay Systems Access II (Beckman Coulter, Inc., Chaska, MN).
Statistical analysis
Descriptive statistics were used to compare subjects across the three ethnic groups. We tested for group differences using ANOVA for normally distributed variables and Kruskal-Wallis tests for nonnormally distributed variables. The χ2 test was used to test for group differences in distribution of sex. ANCOVA models included sex, age, BMI, and serum TG levels as covariates. We used stepwise linear regression to model AIRg as a function of TGs in visceral, pancreatic, and hepatic compartments; a separate model was developed for each of the three ethnic groups.
Data are presented as mean ± SE unless otherwise stated. Statistical significance was set at the P < 0.05 level. Pearson r was used for bivariate correlation analysis. StatGraphics Centurion XVI software (version 16.1.05; StatPoint Technologies, Inc., Warrenton, VA) was used for the statistical analysis.
RESULTS
Characteristics of the three race/ethnic study groups
We recruited 109 individuals of both sexes. Nine individuals were diagnosed with type 2 diabetes based on the OGTT blood glucose levels and were excluded from further studies. The remaining 100 individuals were eligible and enrolled. Race (black or white) and ethnicity (Hispanic or non-Hispanic) were self-identified. The three study groups included 30 non-Hispanic white subjects, 50 Hispanic white subjects, and 20 non-Hispanic black subjects; throughout the article, the groups are referred to as white, Hispanic, and black.
The general characteristics, metabolic variables, and abdominal fat distribution of the three race/ethnic study groups are shown in Table 1. Subjects were relatively young adults (mean age, 39 ± 1 years) with mild obesity (mean BMI, 30 ± 1 kg/m2). The groups were matched on general characteristics such as age, BMI, sex, and blood pressure, as listed in Table 1. Mean values of the metabolic variables also listed in Table 1 were within normal limits by clinical standards. However, fasting and 2-h insulin levels were lower in white subjects than in the other groups; hemoglobin A1c was higher in Hispanics; HDL cholesterol was lower in Hispanics; and alanine transaminase was lower in whites.
Table 1.
General characteristics, metabolic variables, and abdominal fat distribution of the three race/ethnic study groups

Subcutaneous fat mass did not differ among groups (P = 0.871), but visceral fat mass did differ (P < 0.013), being highest in Hispanic subjects (161 ± 12 cm2), lowest in black subjects (98 ± 12 cm2), and intermediate in white subjects (134 ± 8 cm2).
Pancreatic and hepatic TG levels
As shown in Fig. 1, pancreatic TG levels were approximately threefold higher in Hispanic subjects and white subjects than in black subjects (P = 0.006, blacks vs. others). In contrast, hepatic TG levels were approximately fivefold higher in Hispanic subjects than in black subjects and approximately threefold higher than in white subjects (P = 0.004, Hispanic vs. others).
Pancreatic TGs did not correlate with serum TGs in any race/ethnic group (r2 = 0.03 in black subjects, r2 = 0.004 in Hispanic and white subjects). Pancreatic TGs also did not correlate with hepatic TGs in black (r2 = 0.03) and Hispanic subjects (r2 = 0.11) but showed some correlation in white subjects (r2 = 0.28).
FSIVGTT
As shown in Fig. 2, compensatory insulin secretion was ~200% higher (P = 0.003) and DI was ~30% higher in black subjects (P = 0.024, blacks vs. others). SI was comparable between Hispanic and black subjects and lower compared with white subjects (P = 0.005, whites vs. others).
Figure 2.

Results of the FSIVGTT. Black subjects have the highest compensatory insulin secretion (AIRg) (left) and the highest DI (middle) but are least sensitive to insulin (right). Hispanic subjects have compensatory insulin secretion and DI values significantly lower than black subjects despite similar insulin resistance. On average, white subjects have low compensatory insulin secretion and DI values similar to those of Hispanic subjects.
To clarify whether the modest differences in glycemic status determined the observed ethnic differences we performed an additional data analysis, which included hemoglobin A1c as an independent covariate. The ethnic differences in our outcomes (including pancreatic and hepatic TG levels, SI, compensatory insulin secretion, and DI) remained significant.
Relationship between compensatory insulin secretion and pancreatic TG by race/ethnicity
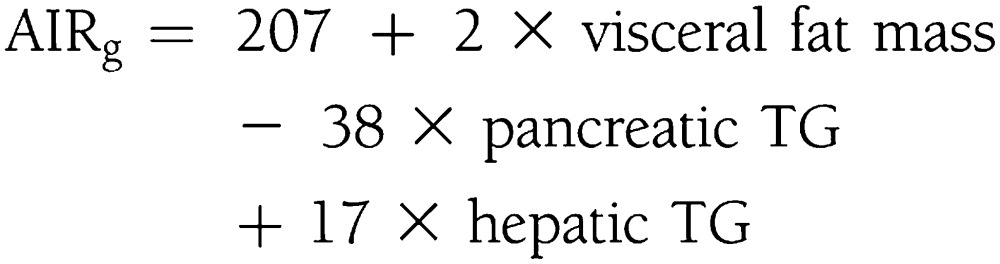
The relationship between compensatory insulin secretion and pancreatic TG levels varied greatly by race/ethnicity (Fig. 3). In black subjects, compensatory insulin secretion increased steeply with small increments in low levels of pancreatic TGs. In white subjects, the range of pancreatic TG was much higher and the slope of the line relating compensatory insulin secretion to pancreatic TG was much less steep (weaker) than in blacks. In Hispanic subjects, the range of pancreatic TG levels was similar to that in whites, but the relationship between compensatory insulin secretion and pancreatic TG was best described as negative.
Figure 3.

Correlations of compensatory insulin secretion and pancreatic TG levels, expressed as fat-to-water ratio (f/w %), across race/ethnic groups. The direct relationship between compensatory insulin secretion and pancreatic TG levels is specific to race/ethnicity. Black subjects (left), who have low levels of pancreatic TGs, have a robust compensatory insulin secretion that was predicted exclusively by pTG levels: AIRg = 266 + 247 × pancreatic TGs. White subjects (middle), with higher levels of pancreatic steatosis, have suppressed compensatory insulin secretion compared with black subjects, but it still was predicted exclusively by pancreatic TG levels: AIRg = 183 + 27 × pancreatic TGs. In Hispanic subjects (right), compensatory insulin secretion is entirely suppressed, and its direct relationship to pancreatic TGs is negative. In Hispanics, compensatory insulin secretion was predicted by a combination of visceral fat mass, pancreatic TGs, and hepatic TGs with negative contribution from pancreatic TG levels: AIRg = 207 + 2 × visceral fat mass – 38 × pancreatic TG + 17 × hepatic TGs.
Multivariable modeling
Stepwise linear regression analysis of compensatory insulin secretion (AIRg) versus three independent variables—pancreatic TGs, hepatic TGs, and visceral fat mass—yielded different equations for each of the three race/ethnic groups.
In black subjects, compensatory insulin secretion was predicted exclusively by pancreatic TGs:
 |
Changes in pancreatic TG levels explained 49% of the total variability in compensatory insulin secretion variability (R2 = 0.49; adjusted R2 = 0.45).
In white subjects, compensatory insulin secretion also was predicted exclusively by pancreatic TGs:
 |
Changes in pancreatic TGs predicted 30% of the variability in compensatory insulin secretion (R2 = 0.30; adjusted R2 = 0.27).
In Hispanic subjects, the model selected three independent variables to predict compensatory insulin secretion: visceral fat mass, pancreatic TGs, and hepatic TGs. The contribution from pancreatic TGs was negative:
 |
This model predicted 38% of the variability in compensatory insulin secretion (R2 = 0.38; adjusted R2 = 0.32).
CONCLUSIONS
In a multiethnic sample of relatively young men and women with stage I obesity and without diabetes, we found striking ethnic differences in the levels of pancreatic TGs and in the relationship between pancreatic TGs and β-cell dysfunction. Black subjects have very low levels of pancreatic TGs and robust compensatory insulin secretion; small increments in pancreatic TGs are accompanied by large linear increases in a compensatory insulin secretion. White subjects have much higher pancreatic TG levels and a flatter positive relationship between pancreatic TGs and compensatory insulin secretion. Hispanic subjects have levels of pancreatic TGs similar to those of whites but the relationship between pancreatic TGs and insulin secretion is paradoxically negative.
The lower level of pancreatic TGs in black compared with Hispanic adults adds to our previous work, showing lower levels of hepatic TGs in black than Hispanic individuals (8), which also was confirmed in this study. Importantly, hepatic TGs cannot be used as a surrogate for pancreatic TGs; pancreatic TG levels were elevated similarly in Hispanic and white subjects, whereas hepatic TG levels were excessively high only in Hispanics. Analysis of our subject-specific data shows that pancreatic TGs cannot be inferred either from hepatic TGs or from serum TGs, thus necessitating direct organ-specific measurement by 1H MRS.
It was reported previously that pancreatic TG levels as measured by 1H MRS are elevated in patients with type 2 diabetes as well as in those with impaired glucose tolerance, impaired fasting glucose, or both (22–24); however, no relation of pancreatic TGs to β-cell dysfunction was found for exclusively middle-aged or older white European subjects. The enrichment of our study sample with blacks and Hispanic young adults enhanced our ability to define these relationships. Our spectroscopic data confirm and extend a previous study of an adolescent population that indicated a lower level of pancreatic TGs in black teenagers than in Hispanic teenagers (25). In that report, the race/ethnicity difference in pancreatic TG levels was small because of the use of a less sensitive method of fat imaging and was related to inflammatory markers and free fatty acids but not to β-cell function. In contrast, we found a striking relationship between pancreatic TG level and compensatory insulin secretion, which differed dramatically by race/ethnicity.
The steep relationship observed between low levels of pancreatic TGs and compensatory insulin secretion in black adults is consistent with glucose-free fatty acid cross-talk, a well-described phenomenon in which free fatty acids stimulate insulin secretion either directly or secondarily by promoting insulin resistance (26–28). The weaker positive relationship seen in white adults and the inverse relationship seen in Hispanic adults is consistent with lipotoxicity offsetting, or even overriding, glucose-free fatty acid cross-talk. The stimulatory effect of free fatty acids on insulin secretion also has been shown to be attenuated in persons who are genetically predisposed to develop type 2 diabetes (26).
A novel finding of our study is that Hispanic subjects were the only group with both pancreatic and hepatic steatosis, the latter being known to 1) attenuate insulin-mediated suppression of gluconeogenesis, elevating fasting plasma glucose and basal insulin secretion; and 2) augment hepatic TG secretion, exposing the pancreas to a higher TG load (29,30). Thus, we speculate that hepatic steatosis begets pancreatic steatosis.
The marked racial/ethnic variation in pancreatic steatosis and its relationship to compensatory insulin secretion suggests a major influence of ancestral genes. Mutations related to ancestral genes previously have been implicated as a risk factor for hepatic steatosis in individuals of Hispanic ancestry and a protective factor in those of African ancestry (31), with the gene products expressed in both hepatocytes and adipocytes. However, the genetic underpinning for racial/ethnic variation in pancreatic steatosis is unknown and will require further exploration.
Our study has several limitations. 1H MRS cannot selectively measure TGs in β-cells; nevertheless, we previously validated whole pancreas TG level as a valid surrogate for β-cells (32). Because our study is cross-sectional and correlational, the tight associations found between pancreatic steatosis and β-cell dysfunction are consistent with the lipotoxicity hypothesis but do not prove causal attribution. However, because we excluded patients with type 2 diabetes, the observed pancreatic steatosis constitutes a putative cause rather than the consequence of β-cell dysfunction. Moreover, our human data are consistent with extensive studies in the ZDF rat showing that excess pancreatic TGs are converted to toxic intermediates that cause β-cell apoptosis. Because black adults were resistant to pancreatic steatosis, other mechanisms must mediate the high incidence of type 2 diabetes in the black population. We do not know whether the pancreatic steatosis and associated β-cell dysfunction in white and Hispanic young adults are reversible. However, a prior study (33) of patients with uncomplicated type 2 diabetes showed that β-cell dysfunction can be rescued by intensive caloric restriction, which also caused a detectable reduction in pancreatic steatosis. Because we studied the three major race/ethnic groups in the U.S., our findings cannot be generalized to other ethnic groups without further study.
This study focused on ethnic differences and did not address potential sex differences. On average, the sex distribution within the groups was balanced (P = 0.4744), although the absolute percentage of Hispanic men was higher compared with white and blacks.
Despite these limitations, the data herein implicate pancreatic TG level measured by 1H MRS as a noninvasive novel biomarker for pancreatic β-cell dysfunction, especially in the at-risk Hispanic population. Pancreatic TGs hold exciting promise as intermediate phenotypes in clinical intervention trials for obesity and as biomarkers to identify mildly obese patients who stand to benefit from early preemptive intervention.
Acknowledgments
This work was supported by National Institutes of Health Grants R01-DK081524, K23-RR024470, UL-1TR000124, and UL-1RR024982 and by a grant from The Lincy Foundation.
No potential conflicts of interest relevant to this article were reported.
L.S.S. designed the study, researched and analyzed data, and wrote the manuscript. R.G.V. contributed to study design, discussion, and writing the manuscript. R.M. performed experiments, contributed to discussion, and reviewed the manuscript. M.D.N. reviewed data, contributed to discussion, and edited the manuscript. E.W.S. performed experiments, processed magnetic resonance data, and contributed to discussion. N.T. performed experiments. I.C. processed data and contributed to discussion. R.H.U. and R.N.B. contributed to discussion and data interpretation and reviewed and edited the manuscript. I.L. participated in study design, performed experiments, researched and analyzed data, and contributed to writing the manuscript. L.S.S. is the guarantor of this work and, as such, had full access to all data in the study and takes responsibility for the integrity of the data and the accuracy of the analysis.
References
- 1.Unger RH, Scherer PE. Gluttony, sloth and the metabolic syndrome: a roadmap to lipotoxicity. Trends Endocrinol Metab 2010;21:345–352 [DOI] [PMC free article] [PubMed] [Google Scholar]
- 2.Field AE, Coakley EH, Must A, et al. Impact of overweight on the risk of developing common chronic diseases during a 10-year period. Arch Intern Med 2001;161:1581–1586 [DOI] [PubMed] [Google Scholar]
- 3.Unger RH. Minireview: weapons of lean body mass destruction: the role of ectopic lipids in the metabolic syndrome. Endocrinology 2003;144:5159–5165 [DOI] [PubMed] [Google Scholar]
- 4.Lee Y, Hirose H, Ohneda M, Johnson JH, McGarry JD, Unger RH. Beta-cell lipotoxicity in the pathogenesis of non-insulin-dependent diabetes mellitus of obese rats: impairment in adipocyte-beta-cell relationships. Proc Natl Acad Sci U S A 1994;91:10878–10882 [DOI] [PMC free article] [PubMed] [Google Scholar]
- 5.Shimabukuro M, Zhou YT, Levi M, Unger RH. Fatty acid-induced beta cell apoptosis: a link between obesity and diabetes. Proc Natl Acad Sci U S A 1998;95:2498–2502 [DOI] [PMC free article] [PubMed] [Google Scholar]
- 6.Cusi K. Role of obesity and lipotoxicity in the development of nonalcoholic steatohepatitis: pathophysiology and clinical implications. Gastroenterology 2012;142:711–725, e6 [DOI] [PubMed] [Google Scholar]
- 7.Szczepaniak LS, Babcock EE, Schick F, et al. Measurement of intracellular triglyceride stores by H spectroscopy: validation in vivo. Am J Physiol 1999;276:E977–E989 [DOI] [PubMed] [Google Scholar]
- 8.Szczepaniak LS, Nurenberg P, Leonard D, et al. Magnetic resonance spectroscopy to measure hepatic triglyceride content: prevalence of hepatic steatosis in the general population. Am J Physiol Endocrinol Metab 2005;288:E462–E468 [DOI] [PubMed] [Google Scholar]
- 9.Szczepaniak LS, Dobbins RL, Metzger GJ, et al. Myocardial triglycerides and systolic function in humans: in vivo evaluation by localized proton spectroscopy and cardiac imaging. Magn Reson Med 2003;49:417–423 [DOI] [PubMed] [Google Scholar]
- 10.Szczepaniak LS, Victor RG, Orci L, Unger RH. Forgotten but not gone: the rediscovery of fatty heart, the most common unrecognized disease in America. Circ Res 2007;101:759–767 [DOI] [PubMed] [Google Scholar]
- 11.McGarry JD. What if Minkowski had been ageusic? An alternative angle on diabetes. Science 1992;258:766–770 [DOI] [PubMed] [Google Scholar]
- 12.Browning JD, Szczepaniak LS, Dobbins R, et al. Prevalence of hepatic steatosis in an urban population in the United States: impact of ethnicity. Hepatology 2004;40:1387–1395 [DOI] [PubMed] [Google Scholar]
- 13.McGavock JM, Lingvay I, Zib I, et al. Cardiac steatosis in diabetes mellitus: a 1H-magnetic resonance spectroscopy study. Circulation 2007;116:1170–1175 [DOI] [PubMed] [Google Scholar]
- 14.Lingvay I, Esser V, Legendre JL, et al. Noninvasive quantification of pancreatic fat in humans. J Clin Endocrinol Metab 2009;94:4070–4076 [DOI] [PMC free article] [PubMed] [Google Scholar]
- 15.National Diabetes Statistics, 2011 [Internet], c2011, last updated 6 December 2011. Bethesda, MD: National Diabetes Information Clearinghouse. Available from http://diabetes.niddk.nih.gov/dm/pubs/statistics/index.aspx Accessed 13 June 2012. [Google Scholar]
- 16.Victor RG, Haley RW, Willett DL, et al. Dallas Heart Study Investigators The Dallas Heart Study: a population-based probability sample for the multidisciplinary study of ethnic differences in cardiovascular health. Am J Cardiol 2004;93:1473–1480 [DOI] [PubMed] [Google Scholar]
- 17.Genuth S, Alberti KG, Bennett P, et al. Expert Committee on the Diagnosis and Classification of Diabetes Mellitus Follow-up report on the diagnosis of diabetes mellitus. Diabetes Care 2003;26:3160–3167 [DOI] [PubMed] [Google Scholar]
- 18.Bergman RN. Orchestration of glucose homeostasis: from a small acorn to the California oak. Diabetes 2007;56:1489–1501 [DOI] [PubMed] [Google Scholar]
- 19.Abate N, Garg A, Coleman R, Grundy SM, Peshock RM. Prediction of total subcutaneous abdominal, intraperitoneal, and retroperitoneal adipose tissue masses in men by a single axial magnetic resonance imaging slice. Am J Clin Nutr 1997;65:403–408 [DOI] [PubMed] [Google Scholar]
- 20.Kaplan LA. Methods in Clinical Chemistry. St. Louis, The CV Mosby Company, 1987 [Google Scholar]
- 21.Friedewald WT, Levy RI, Fredrickson DS. Estimation of the concentration of low-density lipoprotein cholesterol in plasma, without use of the preparative ultracentrifuge. Clin Chem 1972;18:499–502 [PubMed] [Google Scholar]
- 22.Tushuizen ME, Bunck MC, Pouwels PJ, et al. Pancreatic fat content and beta-cell function in men with and without type 2 diabetes. Diabetes Care 2007;30:2916–2921 [DOI] [PubMed] [Google Scholar]
- 23.van der Zijl NJ, Goossens GH, Moors CC, et al. Ectopic fat storage in the pancreas, liver, and abdominal fat depots: impact on β-cell function in individuals with impaired glucose metabolism. J Clin Endocrinol Metab 2011;96:459–467 [DOI] [PubMed] [Google Scholar]
- 24.van Raalte DH, van der Zijl NJ, Diamant M. Pancreatic steatosis in humans: cause or marker of lipotoxicity? Curr Opin Clin Nutr Metab Care 2010;13:478–485 [DOI] [PubMed] [Google Scholar]
- 25.Lê KA, Ventura EE, Fisher JQ, et al. Ethnic differences in pancreatic fat accumulation and its relationship with other fat depots and inflammatory markers. Diabetes Care 2011;34:485–490 [DOI] [PMC free article] [PubMed] [Google Scholar]
- 26.Boden G. Free fatty acids-the link between obesity and insulin resistance. Endocr Pract 2001;7:44–51 [DOI] [PubMed] [Google Scholar]
- 27.Koyama K, Chen G, Lee Y, Unger RH. Tissue triglycerides, insulin resistance, and insulin production: implications for hyperinsulinemia of obesity. Am J Physiol 1997;273:E708–E713 [DOI] [PubMed] [Google Scholar]
- 28.McGarry JD. Banting Lecture 2001: dysregulation of fatty acid metabolism in the etiology of type 2 diabetes. Diabetes 2002;51:7–18 [DOI] [PubMed] [Google Scholar]
- 29.Taylor R. Pathogenesis of type 2 diabetes: tracing the reverse route from cure to cause. Diabetologia 2008;51:1781–1789 [DOI] [PubMed] [Google Scholar]
- 30.Yki-Järvinen H. Liver fat in the pathogenesis of insulin resistance and type 2 diabetes. Dig Dis 2010;28:203–209 [DOI] [PubMed] [Google Scholar]
- 31.Romeo S, Kozlitina J, Xing C, et al. Genetic variation in PNPLA3 confers susceptibility to nonalcoholic fatty liver disease. Nat Genet 2008;40:1461–1465 [DOI] [PMC free article] [PubMed] [Google Scholar]
- 32.Lee Y, Lingvay I, Szczepaniak LS, Ravazzola M, Orci L, Unger RH. Pancreatic steatosis: harbinger of type 2 diabetes in obese rodents. Int J Obes (Lond) 2010;34:396–400 [DOI] [PubMed] [Google Scholar]
- 33.Lim EL, Hollingsworth KG, Aribisala BS, Chen MJ, Mathers JC, Taylor R. Reversal of type 2 diabetes: normalisation of beta cell function in association with decreased pancreas and liver triacylglycerol. Diabetologia 2011;54:2506–2514 [DOI] [PMC free article] [PubMed] [Google Scholar]