

Abstract
OBJECTIVE
Due in large part to effective pharmacotherapy, mortality rates have fallen substantially among those with diabetes; however, trends have been less favorable among those of lower socioeconomic status (SES), leading to a widening gap in mortality between rich and poor. We examined whether income disparities in diabetes-related morbidity or mortality decline after age 65 in a setting where much of health care is publicly funded yet universal drug coverage starts only at age 65.
RESEARCH DESIGN AND METHODS
We conducted a population-based retrospective cohort study using administrative health claims from Ontario, Canada. Adults with diabetes (N = 606,051) were followed from 1 April 2002 to 31 March 2008 for a composite outcome of death, nonfatal acute myocardial infarction (AMI), and nonfatal stroke. SES was based on neighborhood median household income levels from the 2001 Canadian Census.
RESULTS
SES was a strong predictor of death, nonfatal AMI, or nonfatal stroke among those <65 years of age (adjusted hazard ratio [HR] 1.51 [95% CI 1.45–1.56]) and exerted a lesser effect among those ≥65 years of age (1.12 [1.09–1.14]; P < 0.0001 for interaction), after adjusting for age, sex, baseline cardiovascular disease (CVD), diabetes duration, comorbidity, and health care utilization. SES gradients were consistent for all groups <65 years of age. Similar findings were noted for 1-year post-AMI mortality (<65 years of age, 1.33 [1.09–1.63]; ≥65 years of age, 1.09 [1.01–1.18]).
CONCLUSIONS
Observed SES differences in CVD burden diminish substantially after age 65 in our population with diabetes, which may be related to universal access to prescription drugs among seniors.
More than 350 million people have diabetes worldwide, and with the dramatic rise in obesity and the aging of the world’s population, this figure is expected to double in the coming decades (1,2). Diabetes causes substantial morbidity and premature loss of life (3). However, mortality rates have fallen considerably over the past two decades among those with diabetes (4–7), ostensibly due to medical advances in strategies to reduce cardiovascular risk (8). The recent shift in clinical practice toward using more complex drug regimens (9), in combination with behavior change strategies, could prevent as many as one-half of all cardiovascular events among high-risk groups with diabetes (8). Access to medications is therefore essential for optimizing outcomes in this population.
Recent studies suggest that escalating drug costs may have adverse consequences on diabetes care for low-income groups without adequate insurance coverage (10–12). These people are more likely to restrict their use of prescription medications because of high out-of-pocket costs, and this in itself is associated with poorer health outcomes (11–13). Lower-income groups share a disproportionate burden of diabetes, experience more complications from diabetes, and are far less likely to have drug insurance (12–18). This is true even in Canada, where health care is provided free of charge for everyone but prescription drugs are not a universal benefit (12,18). Lower-income patients with diabetes who lack drug coverage are in a conundrum; the short-term costs of multidrug regimens may be too high to bear but the long-term costs of forgoing needed care are substantially greater.
A growing body of literature highlights the importance of health insurance in closing the gap in health outcomes between groups of differing socioeconomic status (SES) (19–24). Since the inception of the U.S. Medicare prescription drug benefit (Part D) in January 2006, drug utilization and adherence to essential medications has risen among seniors (21–23), despite the inherent complexity of this benefit and associated gaps in coverage (25). The newly created Patient Protection and Affordable Care Act (ACA) includes provisions for expanding prescription drug coverage for Medicare beneficiaries and those covered under commercial insurance plans. However, the degree of cost sharing between insurance providers and patients in commercial plans may still vary to a great extent, creating ongoing access barriers for low-income individuals, and those not enrolled in any plan will remain without coverage. Critics have argued that the ACA as it is currently envisioned will fall far short in addressing the vast social disparities that exist in U.S. health care today (25,26).
In Canada, income-related differences in mortality fell substantially after the advent of universal health care (27). However social inequities still persist for a variety of health outcomes, including mortality from coronary heart disease and other causes (6,28,29). Furthermore, the gap in mortality between richer and poorer patients with diabetes has widened over the past decade (6). Little is known about the contribution of prescription drug coverage as an added benefit to the coverage of medical services in reducing SES disparities in chronic disease morbidity or mortality. To address this issue, we conducted a population-based study in Ontario, Canada, where physician and hospital services are universally covered for the whole population under the province’s health care plan. In Ontario, drug programs are publicly funded only for those 65 years of age and older, and for select populations under 65 years of age; otherwise, patients rely on employment benefits, privately purchase insurance, or pay out of pocket. For these reasons, we hypothesized that income would have a lesser effect on cardiovascular outcomes and mortality in the population with diabetes who were >65 years of age compared with younger-aged individuals.
RESEARCH DESIGN AND METHODS
Study population
We conducted a retrospective cohort study using administrative health claims data from Ontario, Canada. Because the Canadian health care system provides coverage for all hospital, laboratory, and physician services, these data sources include records for virtually the entire population of Ontario. The Ontario Diabetes Database (ODD) was used to identify all adults (≥20 years of age) with diabetes living in Ontario on 1 April 2002. The ODD uses a validated algorithm based on hospitalization records and outpatient service claims and has a high level of sensitivity (86%) and specificity (97%) for identifying persons with diagnosed diabetes (30). Once cases enter the database, they remain there until death or migration out of province. Records in the ODD can be linked anonymously to other datasets using a unique identifier created from encrypted health card numbers. To ensure each individual had comparable baseline information, we excluded those who first became eligible for coverage under the province’s health care plan during the 5-year period prior to baseline.
Baseline covariates
The primary explanatory variable in this study was SES, based on the median household income level of an individual’s neighborhood of residence on 1 April 2002 from the 2001 Canadian Census. Neighborhoods were defined using small geographic units (dissemination areas) from Statistics Canada that are fairly homogeneous with respect to social characteristics (average population ∼500). Other baseline covariates included age, sex, diabetes diagnosis ≤2 (recent) versus >2 years, number of visits to a primary care practitioner in the previous year, and baseline cardiovascular disease (CVD) (acute myocardial infarction [AMI], stroke, or coronary or cerebral revascularization within 5 years) based on relevant diagnostic codes from ICD-9 (ICD-10 codes were instituted from 1 April 2002 onwards) and procedure codes from hospital discharge records. Comorbidity was captured using diagnostic codes (for conditions other than diabetes) listed in hospital records and physicians’ service claims from the year prior to baseline to create distinct case-mix categories (collapsed ambulatory diagnostic groups) based on the Johns Hopkins Adjusted Clinical Groups case-mix system.
Outcomes
Individuals in our cohort were followed from baseline (1 April 2002) until 31 March 2008 for the primary end point of death, nonfatal AMI, and nonfatal stroke based on death and hospitalization records (ICD-10 codes: I21, I22, I61, I63, or I64). Secondary outcomes included AMI, stroke, and death from any cause as separate outcomes within the entire cohort. We also examined mortality within 30 days and 1 year after admission for AMI and stroke among those experiencing one of these events between baseline and 31 March 2007. We expected to observe less variation in 30-day mortality across SES groups since the cost of in-patient drug therapies in Ontario are covered by a hospital’s global budget and are not contingent on an individual’s insurance status.
Statistical analysis
For our primary analysis, a Cox proportional hazards model was used to examine the impact of SES on the incidence of death, nonfatal AMI, or nonfatal stroke after adjusting for age (as a continuous variable), sex, recency of diabetes diagnosis, primary care use, and baseline CVD. We included interaction terms for age-group (<65 vs. ≥65 years of age) and SES quintile in our primary Cox proportional hazards model to examine whether being over versus under age 65 (as a proxy for access to universal drug coverage) modified the impact of SES on our primary outcome. Since a significant interaction was observed, we then stratified our analysis on the basis of age (<65 vs. ≥65 years of age). Further interactions were tested between SES and sex, and baseline CVD status.
We conducted a number of sensitivity analyses. To test whether SES-related differences were explained simply by aging itself, we repeated our models within the following age strata: 20–44, 45–54, and 55–64 years of age, to assess the consistency of the SES effect across younger age categories. We then restricted our analysis to those members of our cohort who were <65 years of age (n = 324,755) and included interaction terms between SES quintiles and age-groups 20–44 and 45–54 (55–64 years of age being the reference category). To explore the possibility that age-related differences in SES gradients were caused by a survivor effect, we reran our model adjusting for baseline comorbidity; we further restricted our analysis to the 113,710 individuals in our cohort who had a recent diagnosis of diabetes (within 2 years of baseline). Lastly, we conducted a spline regression analysis to see if age-related SES effects differed across age-groups (<65 vs. ≥65 years of age), after considering the interaction between aging and SES itself.
Analyses were repeated for each secondary outcome separately (censoring for death in models examining AMI or stroke). Lastly, logistic regression was used to examine the impact of SES on 30-day and 1-year mortality after admission for AMI and stroke, both overall and within the subgroups defined above. Analyses for each of these secondary outcomes were again stratified on the basis of age-group (<65 vs. ≥65 years of age).
Ethics
This protocol received ethical approval from the institutional review boards at St. Michael’s Hospital and Sunnybrook Health Sciences Centre in Toronto.
RESULTS
Of the 635,167 potentially eligible Ontario residents who met our inclusion criteria, 25,919 (4.1%) were excluded because they lacked health care coverage for a full 5 years prior to baseline, and a further 3,197 (0.5%) were excluded because of missing information on area SES. The final sample size was 606,051.
Baseline characteristics of the study cohort are summarized in Table 1. Lower-income groups were disproportionately represented; 45% of the cohort was in the bottom two SES quintiles. Lower-income groups were more likely to be younger, female, and to have had a previous AMI or stroke, and had more visits per year to their primary care provider. Older groups had a higher level of comorbidity at baseline compared with younger individuals; however, comorbidity rates were largely unaffected by SES (Supplementary Tables 1 and 2).
Table 1.
Baseline characteristics of study population by SES

Over a median follow-up of 6.0 years, there were 30,380 hospitalizations for AMI, 18,072 hospitalizations for stroke, and 111,237 deaths from any cause among members of our cohort. There was a significant inverse SES gradient in the risk of death, nonfatal AMI, or nonfatal stroke that was independent of baseline age, sex, diabetes duration, CVD, and health care utilization (Table 2). This effect was more pronounced in patients <65 years of age, in whom those in the lowest SES quintile experienced a 50% increased risk of the primary end point (adjusted hazard ratio [HR] 1.51 [95% CI 1.45–1.56]) compared with those in the highest quintile, and weaker among those 65 years of age and older (P ≤ 0.0005 for all SES–age-group interactions). Adjusting for baseline comorbidity had little impact on the HRs generated (data not shown). Similar findings were also apparent when these outcomes were examined individually; the SES gradient before versus after age 65 fell substantially for each outcome (Fig. 1).
Table 2.
Risk of primary outcome (death, nonfatal AMI, or nonfatal stroke) by SES quintile and age-group (N = 606,051)
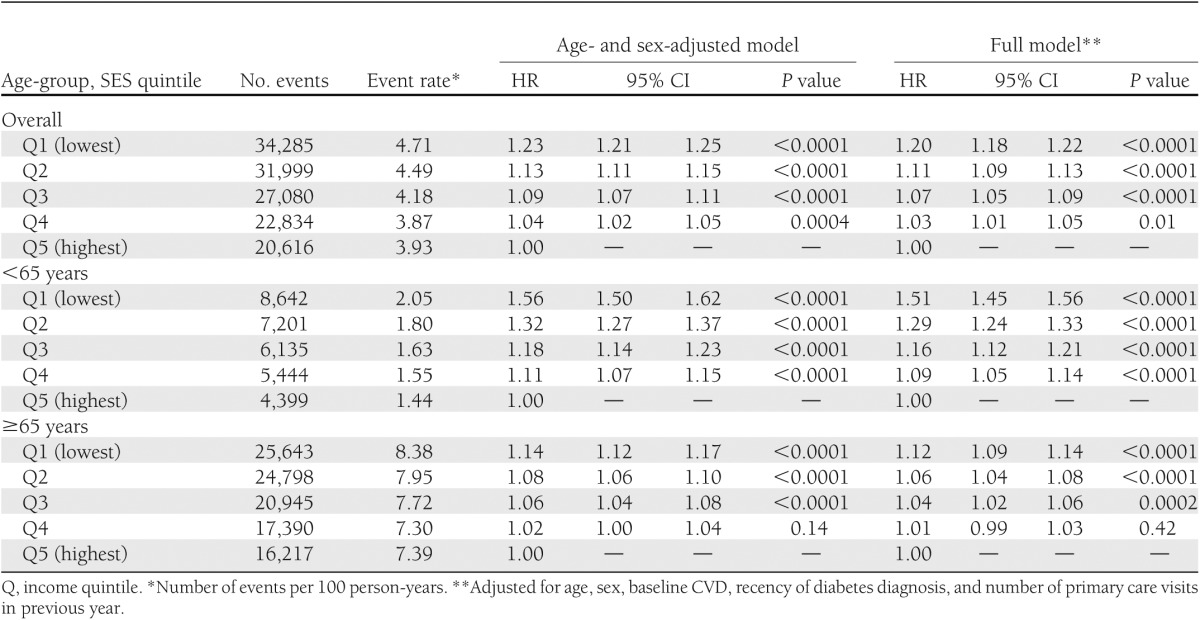
Figure 1.

Risk of death from any cause, AMI, and stroke by SES quintile and age-group (N = 606,051). †Number of events per 100 person-years. *Adjustment for age, sex, baseline CVD, recency of diabetes diagnosis, and number of primary care visits in the previous year.
We conducted a number of sensitivity analyses. First, we found that the SES gradient observed among younger individuals was consistent across all age-groups <65 years of age (Supplementary Fig. 1). Gradients between the lowest and highest SES quintiles were virtually identical when the analysis was restricted to members of our cohort with a diabetes duration of 2 years or less (<65 years of age, adjusted HR 1.52 [95% CI 1.39–1.66]; ≥65 years of age, 1.11 [1.05–1.17]). Spline regression analyses also demonstrated a significant interaction between SES and age-group (<65 vs. ≥65 years of age; P < 0.0001), after accounting for the interaction between age and SES (P < 0.03) and other baseline covariates, and a narrowing of the SES gradient starting at 65 years of age (data not shown). There were no significant interactions between SES and sex or CVD status (P > 0.05 for each).
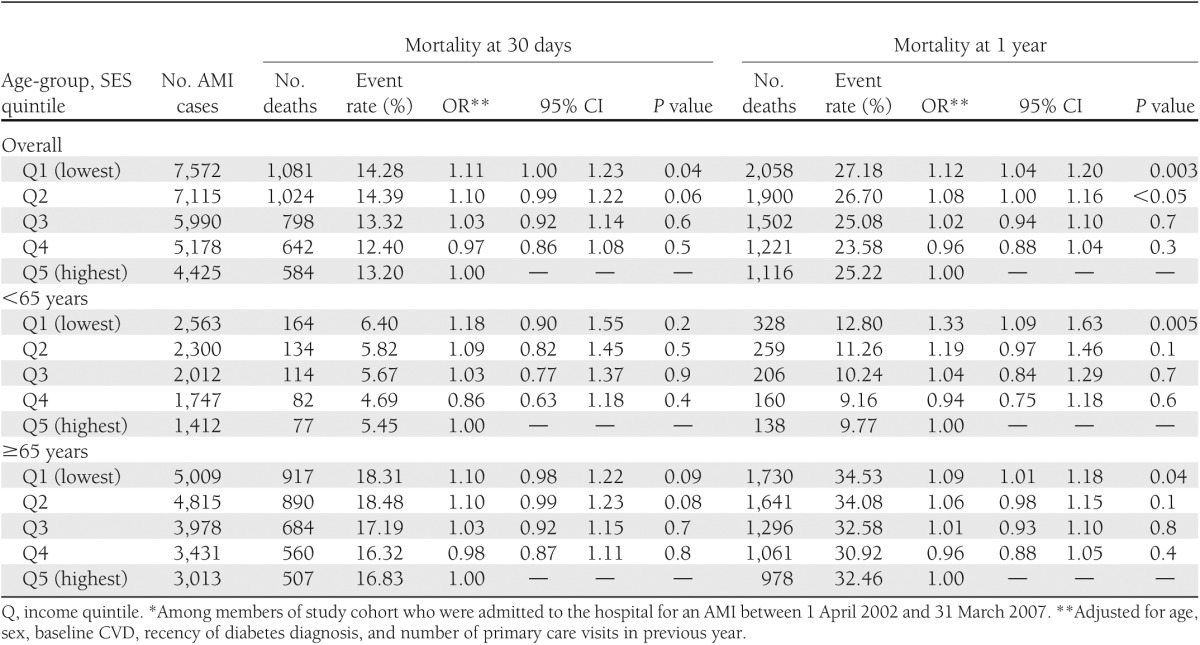
In contrast, SES had little impact on short-term mortality after AMI but was significantly related to long-term mortality (Table 3). Again, this effect was particularly pronounced among those <65 years of age, in whom the lowest SES group had a one-third greater risk of death at 1-year after AMI relative to the highest quintile (adjusted odds ratio [OR] 1.33 [95% CI 1.09–1.63]) (Table 3). There were no SES gradients in 30-day or 1-year mortality after stroke, either overall (lowest vs. highest quintile: 0.91 [0.81–1.02] for 30-day mortality; 0.97 [0.89–1.06] for 1-year mortality) or by age-group (data not shown).
Table 3.
Risk of death at 30 days and 1 year after AMI by SES quintile and age-group (N = 30,280)*
CONCLUSIONS
This population-based study found that socially disadvantaged groups with diabetes have a significantly higher risk of nonfatal AMI, stroke, or death compared with more affluent individuals, in a setting where much of health care is provided to all residents free of charge. This finding was most marked among patients <65 years of age who rely primarily on private insurance or pay out of pocket for their prescription drugs. In contrast, SES gradients were substantially reduced among those 65 years of age or older, for whom drug costs are universally subsidized through a provincial drug benefit program. Although there are many potential reasons why social disadvantage leads to poor health, our findings support the notion that prescription drug coverage could potentially help to close the gap in health between rich and poor. From our observations, as many as 5,000 deaths and nearly 2,700 AMIs or strokes could have been avoided among younger and middle-aged adults with diabetes if the gap between wealthier and poorer individuals had been identical to that seen among older groups.
Although more intensive medical regimens have likely contributed to overall improvements in survival (4–7), and reduced vascular events in patients with diabetes (5), effective care may be becoming increasingly inaccessible for low-income people because of cost. A previous population-based study from Ontario by Lipscombe et al. (6) demonstrated a widening gap in mortality between higher- and lower-income populations with diabetes over a 10-year period, a finding that was largely limited to those <65 years of age. Over the last decade, the number of patients with diabetes who cannot afford their medication has increased in parallel with the rising cost and complexity of diabetes regimens (10,11), which could explain why poorer groups with diabetes have benefited less from advances in medical care. High out-of-pocket costs of medications could lead to lower rates of adherence to therapy and a concomitantly higher risk of adverse events in lower-income groups (12,13,31,32).
The opposite phenomenon may explain the finding of a diminished SES gradient in 30-day mortality after AMI. Access to life-saving therapies, such as primary percutaneous coronary interventions or early thrombolysis, and highly qualified health care professionals is fairly equitable in Ontario across all patient groups once individuals reach the hospital (15). However, longer-term survival is likely to be more affected by aggressive risk reduction strategies and the chronic use of evidence-based medications. Once again, SES-related differences in 1-year mortality were more evident among those <65 years of age. A recent randomized, controlled trial suggested that eliminating insurance copayments can reduce cardiovascular hospitalizations by 14% in patients with previous AMI (33). The SES gradient we observed was of a greater magnitude likely because our lowest SES group included individuals without any drug coverage at all. It is unclear why we did not observe a similar trend for those admitted with stroke, although the number of strokes occurring before 65 years of age was markedly smaller. In 2003, a comprehensive stroke strategy was adopted in Ontario to eliminate province-wide variations in in-hospital and outpatient stroke management, and this program may also have reduced SES-related differences in care (15,34).
Our findings are corroborated by other studies that demonstrate the potential for health insurance to eliminate health gradients. McWilliams et al. (19) noted significant improvements in self-reported health and functional status in previously uninsured individuals with diabetes and other chronic conditions after enrollment in U.S. Medicare at 65 years of age. Racial disparities in glucose, blood pressure, and cholesterol control also appear to be substantially diminished after enrollment in Medicare (20). After the Medicare prescription drug benefit (Part D) became available in 2006, out-of-pocket costs fell among American seniors overall, along with parallel declines in nondrug medical spending, largely related to acute hospitalizations, among those whose prior drug coverage was limited (21–25). At the same time, nonadherence to prescription drugs declined while overall drug utilization increased in all groups, including the sickest and poorest beneficiaries (21–23). Our study adds to this literature by examining the potential role of prescription drug coverage in modifying the impact of SES on morbidity and mortality from chronic disease, in the setting of existing insurance coverage for medical services. Other studies support the notion that differential access to drug benefits contributed to our findings. A recent study by Law et al. (12) found that cost-related nonadherence to medications was four times as common among Canadians who lacked drug insurance; as many as one-third of low-income respondents without coverage reported this behavior. A cost-sharing policy implemented in Quebec in 1996 was associated with immediate reductions in the use of essential medications among the elderly and welfare recipients and increases in avoidable emergency department visits (31). Furthermore, findings from several U.S. studies, including a recent randomized trial, suggest that enhancing prescription drug insurance might be cost effective by enabling the prevention of adverse outcomes, without significant increases in overall spending (24,33).
Other factors may have contributed to the observed SES gradient in CVD, including differences in the prevalence of hypertension, abdominal obesity, and an unhealthy lifestyle (35,36). However, previous studies suggest that adverse health behaviors (cigarette smoking, alcohol drinking, physical inactivity, and poor-quality diet) and obesity explain only a modest proportion of the relationship between social disadvantage and poor health (35,36). Impaired health literacy creates an additional barrier to effective care among low-SES groups but occurs with even greater frequency among low-income elderly than in younger populations (37). There is evidence from other countries that lower-income groups may be less likely to achieve evidence-based targets, but these findings may be driven by differences in access to health care (16). In Ontario, access to primary care is equitable across groups; in fact, lower SES groups have higher numbers of primary care visits per year than higher SES individuals. Moreover, prescribing rates appear to be similar across SES strata among older groups with diabetes, suggesting that treatment differences are less important than factors outside the control of individual care providers (15).
The above factors alone would not explain why the SES gradient we observed was more marked in those <65 years of age. Other policies targeting seniors might have contributed to our findings. In Canada, similar to other countries, individuals >65 years of age receive an old-age security pension, which, after its establishment in the late 1960s, led to a substantial fall in poverty rates among seniors (38). Furthermore, the impact of poverty may vary across the life span. For instance younger socially disadvantaged groups may experience more stress due to work or responsibilities of caring for children and devote less time to self-management. Survivor bias could potentially lead older individuals of lower SES to be relatively healthier than their younger counterparts. This might have contributed to our findings; however, the level of comorbidity was consistently greater among older compared with younger patients and varied little by SES. Moreover, our findings remained unchanged after restricting our analysis to new cases of diabetes, a group expected to have lower levels of morbidity. Another possibility is that of reverse causation (illness or disability leading to lower SES), which might affect the working-age population to a greater extent; although the lack of an SES gradient in comorbidity argues against this theory.
The strengths of this study include its large size and its population-based sample. There are a number of limitations to this study, however, that merit discussion. First, we lacked individual-level data on income. However, neighborhood income is a widely used measure of SES that correlates well with individual-level measures; furthermore, it may even exert an independent influence on the health of a population (39). SES effects tend to be greater when individual measures are applied; thus, we may in fact be underestimating the true gradient in CVD risk related to SES in the population with diabetes (39). Measurements of household or neighborhood income may be less reliable for those >65 years of age who may be living in nursing homes or with their children; although individual income has more potential for misclassification in older individuals who are no longer in the workforce by failing to take their degree of personal “wealth” into account. Second, although universal access to drug benefits at 65 years of age could have accounted for age-related differences in the impact of SES on CVD outcomes, we could not test this assertion directly, as our datasets lacked information on insurance coverage in younger groups. However, the inclusion of individuals in our younger cohort who receive some drug coverage through private or public means would tend to bias our results toward the null hypothesis. Moreover, a significant proportion of lower-income Canadians who are <65 years of age remain without any coverage; this latter group is more than three times as likely to report cost-related nonadherence to prescription medications (12,15). Our databases lack information on clinical variables such as blood pressure and cholesterol levels; thus the degree to which differences in the control of these risk factors can explain the observed gradients is not known. However, these differences may form an important part of the causal pathway linking low SES and CVD, particularly in younger people who are not eligible for universal drug insurance. Lastly, we did not have information on immigration status or ethnicity.
Socially disadvantaged groups share a disproportionate burden of diabetes and diabetes complications. Although current management strategies can reduce the incidence of cardiovascular complications by as much as 50% in high-risk groups with diabetes, wealthier individuals appear to be benefiting to a greater extent from advances in medical care (6,8). Lower-income groups with diabetes, particularly those <65 years of age, have worse outcomes despite greater use of primary care services, suggesting missed opportunities for intervention. Evidence suggests that lower-income groups need more frequent and more intensive interactions with a health care team to achieve improvements in diabetes control (40). Measures to improve the health of low-income groups with diabetes, and other chronic diseases that rely on costly therapies, will also have to address barriers to accessing care related to poverty, including high medication costs. Prescription drug coverage in addition to insurance for medical services is another step that might help bridge the gap in cardiovascular risk between rich and poor groups with diabetes by making state-of-the-art drug regimens more accessible to all.
Acknowledgments
This research was funded in part by the Project for an Ontario Women's Health Evidence-Based Report (POWER Study), which received funding from Echo: Improving Women’s Health in Ontario, an agency of the Ontario Ministry of Health and Long-Term Care. Additional funding was provided by the Canadian Institutes of Health Research (CIHR). G.L.B. and B.R.S. hold New Investigator Awards funded by CIHR and the Ontario Women’s Health Council (G.L.B.). L.L.L. is supported by a Canadian Diabetes Association/CIHR Clinician Scientist Award. This study was supported by the Institute for Clinical Evaluative Sciences (ICES), which is funded by an annual grant from the Ontario Ministry of Health and Long-Term Care.
No potential conflicts of interest relevant to this article were reported.
G.L.B. conceptualized the study, designed the analyses, and wrote the manuscript. P.B. contributed to the discussion and wrote the manuscript. L.L.L., B.R.S., D.S.F., O.B., and A.S.B. contributed to discussion and reviewed and edited the manuscript. G.L.B. is the guarantor of this work and, as such, had full access to all the data in the study and takes responsibility for the integrity of the data and the accuracy of the data analysis.
The authors thank Ping Li, Fangyun Wu, and Hong Zhang (Institute for Clinical Evaluative Sciences) for assistance with statistical analyses and Ashley Johns (Li Ka Shing Knowledge Institute of St. Michael’s Hospital) for administrative support.
Footnotes
None of the funding or supporting agencies were involved in the design or conduct of the study; collection, management, analysis, or interpretation of the data; or preparation, review, or approval of the manuscript. The opinions, results, and conclusions reported in this article are those of the authors and are independent from the funding sources. No endorsement by ICES, Echo, or the Ontario Ministry of Health and Long-Term Care is intended or should be inferred.
This article contains Supplementary Data online at http://care.diabetesjournals.org/lookup/suppl/doi:10.2337/dc12-0364/-/DC1.
References
- 1.World Health Organization. Diabetes fact sheet [Internet]. Available from http://www.who.int/mediacentre/factsheets/fs312/en/index.html Accessed 31 August 2011
- 2.Wild S, Roglic G, Green A, Sicree R, King H. Global prevalence of diabetes: estimates for the year 2000 and projections for 2030. Diabetes Care 2004;27:1047–1053 [DOI] [PubMed] [Google Scholar]
- 3.Booth GL, Kapral MK, Fung K, Tu JV. Relation between age and cardiovascular disease in men and women with diabetes compared with non-diabetic people: a population-based retrospective cohort study. Lancet 2006;368:29–36 [DOI] [PubMed] [Google Scholar]
- 4.Lipscombe LL, Hux JE. Trends in diabetes prevalence, incidence, and mortality in Ontario, Canada 1995-2005: a population-based study. Lancet 2007;369:750–756 [DOI] [PubMed] [Google Scholar]
- 5.Booth GL, Kapral MK, Fung K, Tu JV. Recent trends in cardiovascular complications among men and women with and without diabetes. Diabetes Care 2006;29:32–37 [DOI] [PubMed] [Google Scholar]
- 6.Lipscombe LL, Austin PC, Manuel DG, Shah BR, Hux JE, Booth GL. Income-related differences in mortality among people with diabetes mellitus. CMAJ 2010;182:E1–E17 [DOI] [PMC free article] [PubMed] [Google Scholar]
- 7.Gregg EW, Gu Q, Cheng YJ, Narayan KM, Cowie CC. Mortality trends in men and women with diabetes, 1971 to 2000. Ann Intern Med 2007;147:149–155 [DOI] [PubMed] [Google Scholar]
- 8.Gaede P, Lund-Andersen H, Parving H-H, Pedersen O. Effect of a multifactorial intervention on mortality in type 2 diabetes. N Engl J Med 2008;358:580–591 [DOI] [PubMed] [Google Scholar]
- 9.Alexander GC, Sehgal NL, Moloney RM, Stafford RS. National trends in treatment of type 2 diabetes mellitus, 1994-2007. Arch Intern Med 2008;168:2088–2094 [DOI] [PMC free article] [PubMed] [Google Scholar]
- 10.Grant RW, McCarthy EP, Singer DE, Meigs JB. Frequent outpatient contact and decreasing medication affordability in patients with diabetes from 1997 to 2004. Diabetes Care 2006;29:1386–1388 [DOI] [PMC free article] [PubMed] [Google Scholar]
- 11.Piette JD, Heisler M, Wagner TH. Problems paying out-of-pocket medication costs among older adults with diabetes. Diabetes Care 2004;27:384–391 [DOI] [PubMed] [Google Scholar]
- 12.Law MR, Cheng L, Dhalla IA, Heard D, Morgan SG. The effect of cost on adherence to prescription medications in Canada. CMAJ 2012;184:297–302 [DOI] [PMC free article] [PubMed] [Google Scholar]
- 13.Heisler M, Choi H, Rosen AB, et al. Hospitalizations and deaths among adults with cardiovascular disease who underuse medications because of cost: a longitudinal analysis. Med Care 2010;48:87–94 [DOI] [PMC free article] [PubMed] [Google Scholar]
- 14.Agardh E, Allebeck P, Hallqvist J, Moradi T, Sidorchuk A. Type 2 diabetes incidence and socio-economic position: a systematic review and meta-analysis. Int J Epidemiol 2011;40:804–818 [DOI] [PubMed] [Google Scholar]
- 15.Bierman AS (Ed.). Project for an Ontario Women’s Health Evidence-Based Report: Volumes 1 and 2: Toronto [Internet], 2010. Available from http://www.powerstudy.ca/the-power-report/the-power-report-volume-2/diabetes Accessed 30 September 2010
- 16.Brown AF, Ettner SL, Piette J, et al. Socioeconomic position and health among persons with diabetes mellitus: a conceptual framework and review of the literature. Epidemiol Rev 2004;26:63–77 [DOI] [PubMed] [Google Scholar]
- 17.Saydah S, Lochner K. Socioeconomic status and risk of diabetes-related mortality in the U.S. Public Health Rep 2010;125:377–388 [DOI] [PMC free article] [PubMed] [Google Scholar]
- 18.Kwan J, Razzaq A, Leiter LA, Lillie D, Hux JE. Low socioeconomic status and absence of supplemental health insurance as barriers to diabetes care access and utilization. Can J Diab 2008;32:174–181 [Google Scholar]
- 19.McWilliams JM, Meara E, Zaslavsky AM, Ayanian JZ. Health of previously uninsured adults after acquiring Medicare coverage. JAMA 2007;298:2886–2894 [DOI] [PubMed] [Google Scholar]
- 20.McWilliams JM, Meara E, Zaslavsky AM, Ayanian JZ. Differences in control of cardiovascular disease and diabetes by race, ethnicity, and education: U.S. trends from 1999 to 2006 and effects of Medicare coverage. Ann Intern Med 2009;150:505–515 [DOI] [PubMed] [Google Scholar]
- 21.Madden JM, Graves AJ, Ross-Degnan D, Briesacher BA, Soumerai SB. Cost-related medication nonadherence after implementation of Medicare Part D, 2006-2007. JAMA 2009;302:1755–1756 [DOI] [PMC free article] [PubMed] [Google Scholar]
- 22.Briesacher BA, Zhao Y, Madden JM, et al. Medicare part D and changes in prescription drug use and cost burden: national estimates for the Medicare population, 2000 to 2007. Med Care 2011;49:834–841 [DOI] [PMC free article] [PubMed] [Google Scholar]
- 23.Yin W, Basu A, Zhang JX, Rabbani A, Meltzer DO, Alexander GC. The effect of the Medicare Part D prescription benefit on drug utilization and expenditures. Ann Intern Med 2008;148:169–177 [DOI] [PubMed] [Google Scholar]
- 24.McWilliams JM, Zaslavsky AM, Huskamp HA. Implementation of Medicare Part D and nondrug medical spending for elderly adults with limited prior drug coverage. JAMA 2011;306:402–409 [DOI] [PubMed] [Google Scholar]
- 25.Shrank WH, Choudhry NK. Time to fill the doughnuts—health care reform and Medicare Part D. N Engl J Med 2011;364:598–601 [DOI] [PubMed] [Google Scholar]
- 26.Davis MM, Walter JK. Equality-in-quality in the era of the affordable care act. JAMA 2011;306:872–873 [DOI] [PubMed] [Google Scholar]
- 27.Wilkins R, Berthelot JM, Ng E. Trends in mortality by neighbourhood income in urban Canada from 1971 to 1996 Ottawa, Ontario, Statistics Canada, 2002 [DOI] [PMC free article] [PubMed] [Google Scholar]
- 28.James PD, Wilkins R, Detsky AS, Tugwell P, Manuel DG. Avoidable mortality by neighbourhood income in Canada: 25 years after the establishment of universal health insurance. J Epidemiol Community Health 2007;61:287–296 [DOI] [PMC free article] [PubMed] [Google Scholar]
- 29.Alter DA, Chong A, Austin PC, et al. SESAMI Study Group Socioeconomic status and mortality after acute myocardial infarction. Ann Intern Med 2006;144:82–93 [DOI] [PubMed] [Google Scholar]
- 30.Hux JE, Ivis F, Flintoft V, Bica A. Diabetes in Ontario: determination of prevalence and incidence using a validated administrative data algorithm. Diabetes Care 2002;25:512–516 [DOI] [PubMed] [Google Scholar]
- 31.Tamblyn R, Laprise R, Hanley JA, et al. Adverse events associated with prescription drug cost-sharing among poor and elderly persons. JAMA 2001;285:421–429 [DOI] [PubMed] [Google Scholar]
- 32.Bierman AS, Bell CM. Penny-wise, pound-foolish: the costs of cost-related medication restriction. Med Care 2004;42:623–625 [DOI] [PubMed] [Google Scholar]
- 33.Choudhry NK, Avorn J, Glynn RJ, et al. Post-Myocardial Infarction Free Rx Event and Economic Evaluation (MI FREEE) Trial Full coverage for preventive medications after myocardial infarction. N Engl J Med 2011;365:2088–2097 [DOI] [PubMed] [Google Scholar]
- 34.Webster F, Saposnik G, Kapral MK, Fang J, O’Callaghan C, Hachinski V. Organized outpatient care: stroke prevention clinic referrals are associated with reduced mortality after transient ischemic attack and ischemic stroke. Stroke 2011;42:3176–3182 [DOI] [PubMed] [Google Scholar]
- 35.Lantz PM, House JS, Lepkowski JM, Williams DR, Mero RP, Chen J. Socioeconomic factors, health behaviors, and mortality: results from a nationally representative prospective study of US adults. JAMA 1998;279:1703–1708 [DOI] [PubMed] [Google Scholar]
- 36.Adler N, Singh-Manoux A, Schwartz J, Stewart J, Matthews K, Marmot MG. Social status and health: a comparison of British civil servants in Whitehall-II with European- and African-Americans in CARDIA. Soc Sci Med 2008;66:1034–1045 [DOI] [PubMed] [Google Scholar]
- 37.Health Literacy in Canada. Initial results from the International Adult Literacy and Skills Survey 2007 [Internet]. Available from http://www.ccl-cca.ca/pdfs/HealthLiteracy/HealthLiteracyinCanada.pdf Accessed 7 September 2011
- 38.Kaida L, Boyd M. Poverty variations among the elderly: the roles of income security policies and family co-residence. Can J Aging 2011;30:83–100 [DOI] [PubMed] [Google Scholar]
- 39.Krieger N. Overcoming the absence of socioeconomic data in medical records: validation and application of a census-based methodology. Am J Public Health 1992;82:703–710 [DOI] [PMC free article] [PubMed] [Google Scholar]
- 40.Glazier RH, Bajcar J, Kennie NR, Willson K. A systematic review of interventions to improve diabetes care in socially disadvantaged populations. Diabetes Care 2006;29:1675–1688 [DOI] [PubMed] [Google Scholar]