Abstract
Thermoplastics under voltages are used in diverse applications ranging from insulating cables to organic capacitors. Electromechanical instabilities have been proposed as a mechanism that causes electrical breakdown of thermoplastics. However, existing experiments cannot provide direct observations of the instability process, and existing theories for the instabilities generally assume thermoplastics are mechanically unconstrained. Here, we report in situ observations of electromechanical instabilities in various thermoplastics. A theory is formulated for electromechanical instabilities of thermoplastics under different mechanical constraints. We find that the instabilities generally occur in thermoplastics when temperature is above their glass transition temperatures and electric field reaches a critical value. The critical electric field for the instabilities scales with square root of yield stress of the thermoplastic and depends on its Young's modulus and hardening property.
Thermoplastics have been used as dielectrics in diverse areas ranging from insulating cables,1, 2, 3, 4, 5 polymer capacitors6, 7, 8, 9 to polymer actuators10 and energy harvesters.11 Many applications1, 12, 13 require thermoplastics to sustain high voltages as well as high working temperatures. Mechanical instabilities of thermoplastics induced by electric fields (or so-called electromechanical instabilities) have been hypothesized as a failure mechanism for thermoplastics under voltages, especially at high temperatures.1, 2, 9, 12, 14 Despite intensive studies, the validation of this hypothesis is still extremely challenging due to experimental and theoretical difficulties: (1) Existing experimental proofs of electromechanical instabilities of thermoplastics are only indirect, in that in situ observations of the instability process are not available. (2) Existing theoretical models for electromechanical instabilities of thermoplastics generally assume the polymers to be mechanically unconstrained. However, thermoplastics are usually constrained by electrodes in practical applications, such as in insulating cables1, 2, 3, 4, 5 and polymer capacitors.6, 7, 8, 9 As a result, the importance or even existence of electromechanical instabilities in thermoplastics has been undergoing debate over decades.12, 13 Here, we present in situ observations of the instability process in various thermoplastics and a theoretical model that accounts for electromechanical instabilities in both unconstrained and constrained thermoplastics. The critical electric fields for the instabilities predicted by the model are further compared with experimental results.
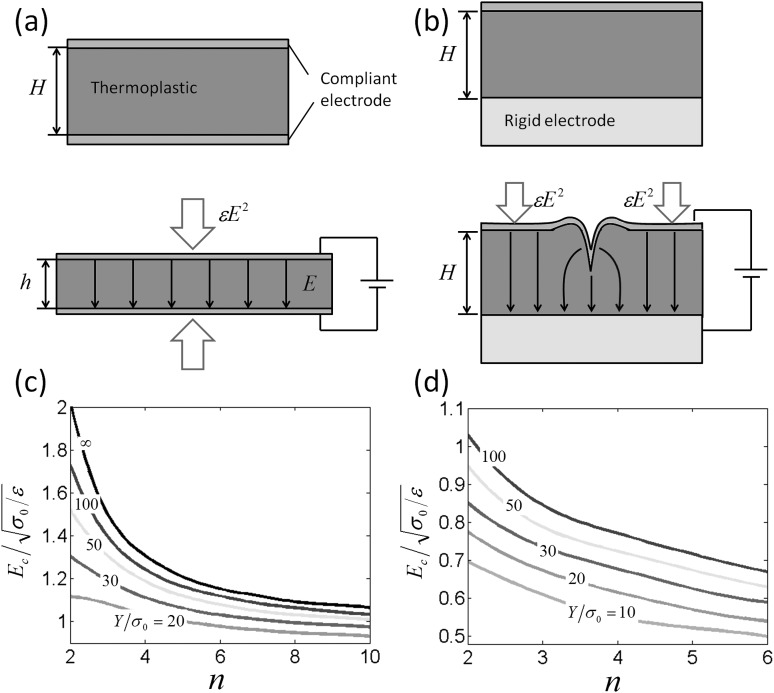
We first discuss various modes of electromechanical instabilities in thermoplastics. A layer of a thermoplastic under a DC voltage is shown in Fig. 1. If both surfaces of the thermoplastic layer are coated with thin compliant electrodes, the layer is mechanically unconstrained [Fig. 1a]. As another scenario, the layer can be mechanically constrained by bonding one of its surfaces to a thick rigid electrode [Fig. 1b]. As the voltage is applied between the electrodes, an electric field develops in the thermoplastic layer. The electric field leads to an effective compressive stress on the thermoplastic layer.15, 16, 17 For the unconstrained layer [Fig. 1a], the effective stress will compress the layer to be thinner, so that the same voltage can induce a higher electric field. When the electric field reaches a critical value, the layer will thin down dramatically, inducing the pull-in instability [Fig. 1a].1, 18 On the other hand, the layer constrained by one electrode will not thin down under the effective stress due to incompressibility of the thermoplastic [Fig. 1b]. Instead, under a critical electric field the flat surface of the layer will become unstable, forming creases in the layer. Once the creases appear, the effective stress will deform them into craters in the layer, leading to the creasing-cratering instability [Fig. 1b].19, 20, 21 (It should be noted that the creasing-cratering instability has been recently observed in elastomers under voltages,19, 20, 21 and the current paper gives the study of this instability in thermoplastics.) If both surfaces of the thermoplastic layer are mechanically constrained by thick rigid electrodes, the pull-in and creasing-cratering instabilities can be suppressed.22
Figure 1.
(a) The pull-in instability occurs in an unconstrained thermoplastic film sandwiched between two compliant electrodes. (b) The creasing-cratering instability occurs in a thermoplastic film constrained by a thick rigid electrode on one of its surface. The calculated critical electric fields for the (c) pull-in instability and (d) creasing-cratering instability as functions of and n.
Now we develop a theoretical model for both types of instabilities. Given the thermoplastics follow the ideal-dielectric law,1, 2, 9, 12, 14, 23 the total true stress in the thermoplastics can be expressed as , where is the Maxwell stress induced by electric field and is the mechanical stress. The Maxwell stress can be expressed as15, 16, 17
| (1) |
where E is the electric field with magnitude E, ε is the permittivity of the thermoplastic, and I is the unit tensor. The Maxwell stress is (i.e., tensile) along the electric field, and (i.e., compressive) perpendicular to the electric field. Considering incompressibility, we can impose a hydrostatic tensile stress of to the thermoplastic.14 As a result, we obtain an effective Maxwell stress of along the electric field and 0 perpendicular to the electric field.14, 24
The Maxwell stress in the thermoplastic drives its deformation which is resisted by the mechanical stress. (It should be noted that the resistant force25 from surface tension of the thermoplastic is negligible in the current study.) Previous studies on electromechanical instabilities have used linear-elastic1, 2, 12 or power-law models9, 14 for mechanical properties of thermoplastics. However, these models usually cannot give accurate fits to the experimental stress-strain data.1, 2, 9, 12, 14 To better characterize mechanical behaviors of thermoplastics at various temperatures, we model them as the Ramberg-Osgood solids, obeying the deformation theory. Under uniaxial deformation, the mechanical true stress and the natural strain e follow the relation
| (2) |
where Y is the Young's modulus, is the yield stress, n is the hardening exponent, and α is a shift parameter which is commonly taken as 0.002 for tension and −0.002 for compression. For thermoplastics, Y generally ranges from ∼104 Pa to ∼109 Pa, from ∼103 Pa to ∼108 Pa, and n from 2 to 6. Based on Eqs. 1, 2, we can express the critical electric field for the electromechanical instabilities by dimensional consideration as
| (3) |
where Z is a non-dimensional factor that depends on , n, and the type of instabilities.
Now we calculate for various types of instabilities. Under electric fields, the unconstrained layer thins down uniformly [i.e., Fig. 1a]. Therefore, for the pull-in instability, we only need to consider uniaxial deformation of the layer under effective Maxwell stress and mechanical stress along the electric field. The traction-free boundary prescribes the total stress along the electric field to be zero [Fig. 1a], so that we have , where , Φ is the voltage, and h is the current thickness of the layer. Furthermore, the natural strain of the layer along the electric field can be expressed as , where H is the thickness of the layer at the undeformed state. By substituting and e into Eq. 2, we obtain a non-linear algebraic equation with Φ and h as variables. The curve of Φ vs. h is non-monotonic, and its peaks indicates the pull-in instability [Fig. S1].14, 18, 26 We plot for the pull-in instability in thermoplastics with various and n in Fig. 1c. It can be seen that monotonically increases with Y and decreases with n, because higher Y and lower n makes the thermoplastic mechanically stiffer. For extreme cases of and , the critical electric fields for the pull-in instability can be analytically calculated as
| (4a) |
| (4b) |
Equations 4a, 4b recover the results of the power-law9, 14 and linear-elastic models, respectively. It is noted that in Eq. 4a due to compressive deformation.
Next we calculate the critical electric field for the creasing-cratering instability. The thermoplastic layer constrained by one rigid electrode does not deform prior to the creasing-cratering instability [i.e., Fig. 1c]. To calculate , we compare the potential energies of the layer at flat and creased states.19, 20, 21 The potential energy at the flat state is , where V is the volume of the layer. We prescribe a downward displacement L to a line on the surface of the layer to form a crease. Since mechanical unloading is not significant during the creasing process, we treat the thermoplastic as a reversible elastic material characterized by Eq. 2, following similar approaches used in metals27 and gels.28 The layer is further taken to deform under plain-strain conditions. The potential energy at the creased state is calculated by solving and using finite-element software, abaqus 6.10.1. (For details of the calculation please refer to Ref. 20.) When the electric field is low, the flat state has lower potential energy and thus is energetically favorable. As the electric field reaches a critical value , the potential energy difference becomes zero and the creasing-cratering instability occurs [Fig. S2].26 We plot for the creasing-cratering instability in thermoplastics with various and n in Fig. 1d. It can be seen that also monotonically increases with Y and decreases with n [Fig. 1d], as in the pull-in instability. In addition, with the same set of material parameters (i.e., ε, , Y, and n), the critical field for the creasing-cratering instability is lower than that for the pull-in instability.
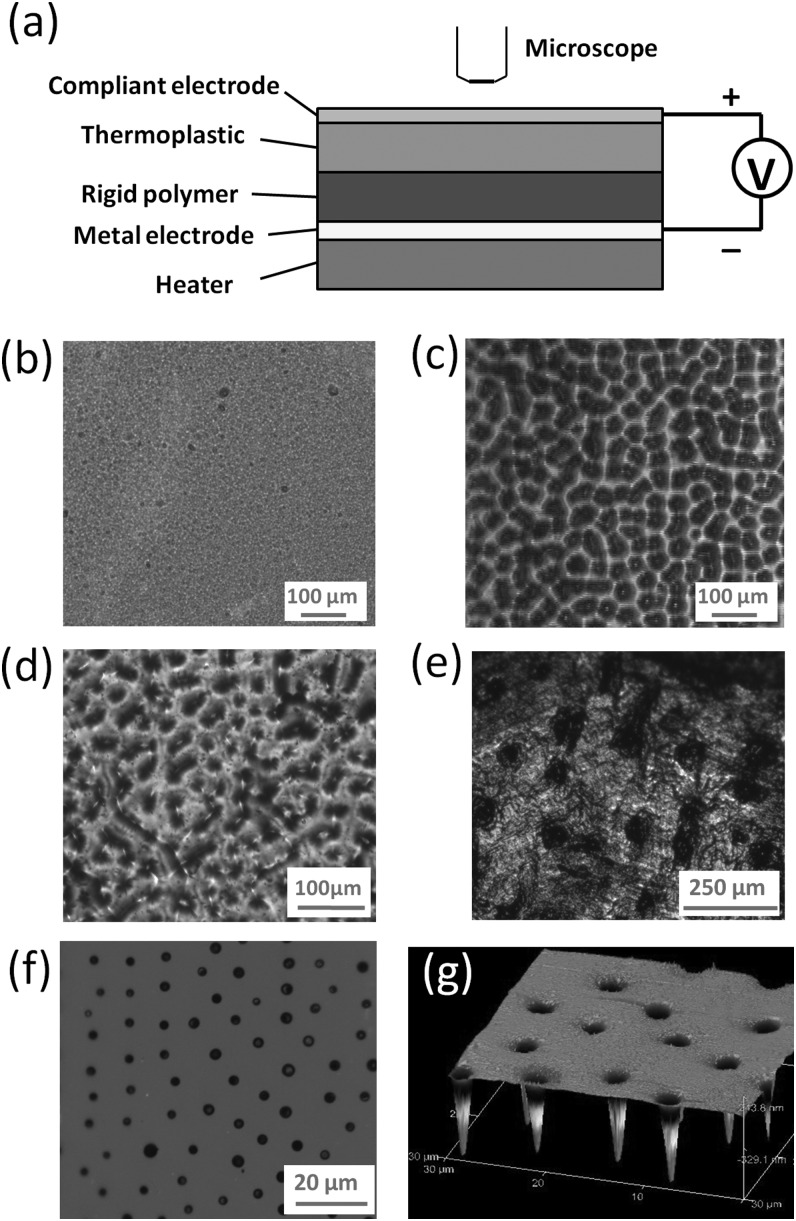
Now we present in situ observations of electromechanical instabilities of thermoplastics under voltages. We choose a variety of thermoplastics which are commonly used as dielectric polymers. The experimental setup is illustrated in Fig. 2a. To suppress the electrical breakdown, we attached a layer of a rigid polymer, Kapton (DuPont, USA) on the bottom of the thermoplastic. The deformation of rigid Kapton is negligible when the thermoplastic undergoes instabilities. A layer of metal was attached to the bottom surface of the Kapton as the rigid electrode. On the top surface of the thermoplastic, a thin layer (e.g., <1 μm) of liquid metal EGaIn (75% Ga, 25% In)29 was smeared on the surface of the thermoplastic as the compliant electrode. The whole system was mounted on a flexible heater (Watlow, USA) with controlled output temperature by a feedback circuit (Total Temperature Instrumentation, USA). Once the temperature in the thermoplastic is stable, a controllable ramping voltage (Mastsusada, Japan) was applied between the two electrodes. The deformation of the thermoplastic surface was observed from a microscope. Once a pattern of instability appeared on the polymer, the voltage was recorded to calculate the critical electric field.
Figure 2.
In situ observation of the electromechanical instability in thermoplastics. (a) Experimental setup for the in situ observation. (b) Microscopic image of the flat surface of the PTBA at 100 °C. The patterns of the creasing-cratering instability on the surfaces of (c) the PTBA at 100 °C, (d) polystyrene at 130 °C, (e) parafilm at 70 °C, (f) polymethyl methacrylate at 150 °C. (g) The surface topology of polymethyl methacrylate after the creasing-cratering instability.
We find that the instabilities generally appear in thermoplastics when the temperature is above their glass transition temperatures [Table I].10, 26, 30 Below glass transition temperatures, electrical breakdown usually occurs in the polymers without electromechanical instabilities, owing to the high mechanical rigidity of the polymers.12 As the temperature increases above the glass transition temperatures, the mechanical rigidity of the polymers significantly reduces and thus the polymers are more susceptible to electromechanical instabilities. Video S126 gives the instability process of poly(tert-butylacrylate) (PTBA) at 100 °C under a ramping voltage of 0.1 kV s−1. When the voltage is low, the surface of PTBA maintains flat [Fig. 2b]. As the applied voltage reaches a critical value (i.e., ∼5.8 kV), a pattern of creases appear and quickly deform into craters [Video S126 and Fig. 2c]. (It should be noted that the initiation of the instability is affected by defects on polymer surfaces25 and we regard the electric field that first causes a pattern of creases to form on the polymer surface as the critical electric field.) Similar process of the creasing-cratering instabilities have also been observed in polystyrene at 130 °C [Fig. 2d], parafilm at 70 °C [Fig. 2e], and polymethyl methacrylate at 150 °C [Fig. 2f]. Once the voltage is withdrawn, the surfaces with craters do not recover the flat state due to plastic deformation, which enables us to characterize the topology of the craters formed in polymethyl methacrylate with AFM after the removal of the liquid metal29 [Fig. 2g].
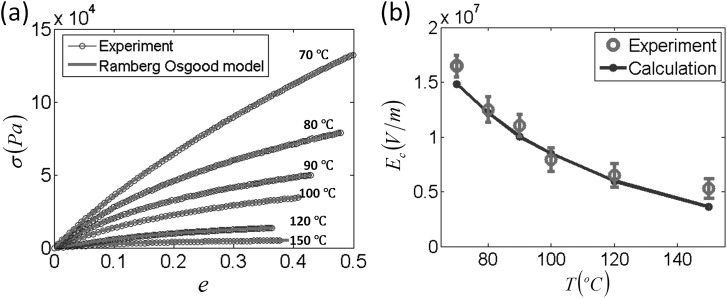
Now we compare the measured critical electric fields of PTBA10 under various temperatures with theoretical predictions. The stress-strain relations of PTBA at different temperatures are measured with uniaxial-tension tests with a strain rate of s−1, and fitted to Eq. 2 to obtain mechanical parameters [Table II].26 Fig. 3a shows that the Ramberg-Osgood model can accurately represent the mechanical behaviors of PTBA. With the measured , Y, and n, and 10 with , the theoretical model can predict the critical fields for the creasing-cratering instability in PTBA at various temperatures. Fig. 3b shows that the theoretical predictions of the critical fields match very well with the experimental results.
Figure 3.
(a) The true stress vs. natural strain curves from uniaxial tension tests of PTBA are fitted to the Ramberg Osgood model with material parameters given in Table I. (b) Comparison of theoretical and experimental results on critical electric fields for the creasing-cratering instability of PTBA under various temperatures. The values of experimental data in (b) represent mean and standard deviation of critical electric fields measured at each temperature (n = 4).
In summary, we develop a theoretical model for the pull-in and creasing-cratering instabilities in mechanically unconstrained and constrained thermoplastics, and demonstrate in situ observations of creasing-cratering instabilities in various thermoplastics. The instabilities generally occur in thermoplastics when the temperature is above their glass transition temperatures and the electric field reaches a critical value. The critical electric field for the instabilities scales with square root of the yield stress of a thermoplastic, increases with its Young's modulus, and decreases with is hardening exponent.
Acknowledgments
The work was supported by NSF's Research Triangle MRSEC (DMR-1121107). X.H.Z. acknowledged the support from NSF (CMMI-1200515). Q.M.W. acknowledged the support of a fellowship from Duke Center for Bimolecular and Tissue Engineering (NIH-2032422). X.F.N and Q.B.P. acknowledged the financial support from Department of Education (H133G100072).
References
- Stark K. H. and Garton C. G., Nature 176, 1225 (1955). 10.1038/1761225a0 [DOI] [Google Scholar]
- Blok J. and LeGrand D. G., J. Appl. Phys. 40, 288 (1969). 10.1063/1.1657045 [DOI] [Google Scholar]
- Finis G. and Claudi A., IEEE Trans. Dielectr. Electr. Insul. 14, 487 (2007). 10.1109/TDEI.2007.344630 [DOI] [Google Scholar]
- Haq S. U. and Raju G. G., IEEE Trans. Dielectr. Electr. Insul. 13, 917 (2006). 10.1109/TDEI.2006.1667753 [DOI] [Google Scholar]
- Hikita M., Tajima S., Kanno I., Ishino I., Sawa G., and Ieda M., Jpn. J. Appl. Phys., Part 1 24, 988 (1985). 10.1143/JJAP.24.988 [DOI] [Google Scholar]
- Chu B. J., Zhou X., Ren K. L., Neese B., Lin M. R., Wang Q., Bauer F., and Zhang Q. M., Science 313, 334 (2006). 10.1126/science.1127798 [DOI] [PubMed] [Google Scholar]
- Neese B., Chu B., Lu S.-G., Wang Y., Furman E., and Zhang Q. M., Science 321, 821 (2008). 10.1126/science.1159655 [DOI] [PubMed] [Google Scholar]
- Zhang Q. M., Bharti V., and Zhao X., Science 280, 2101 (1998). 10.1126/science.280.5372.2101 [DOI] [PubMed] [Google Scholar]
- Zhou X., Zhao X. H., Suo Z. G., Zou C., Runt J., Liu S., Zhang S. H., and Zhang Q. M., Appl. Phys. Lett. 94, 162901 (2009). 10.1063/1.3123001 [DOI] [Google Scholar]
- Yu Z., Yuan W., Brochu P., Chen B., Liu Z., and Pei Q., Appl. Phys. Lett. 95, 192904 (2009). 10.1063/1.3263729 [DOI] [Google Scholar]
- Sanghavi R. R., Asthana S. N., and Singh H., J. Polym. Mater. 17, 221 (2000). [Google Scholar]
- Dissado L. A. and Fothergill J. C., Electrical Degradation and Breakdown in Polymers (Peter Peregrinus Ltd, London, 1992), Vol. 11. [Google Scholar]
- O'Dwyer J. J., The Theory of Electrical Conduction and Breakdown in Solid Dielectrics (Clarendon, 1973). [Google Scholar]
- Zhao X. and Suo Z., Appl. Phys. Lett. 95, 031904 (2009). 10.1063/1.3186078 [DOI] [Google Scholar]
- Dorfmann A. and Ogden R. W., Acta Mech. 174, 167 (2005). 10.1007/s00707-004-0202-2 [DOI] [Google Scholar]
- McMeeking R. M. and Landis C. M., ASME Trans. J. Appl. Mech. 72, 581 (2005). 10.1115/1.1940661 [DOI] [Google Scholar]
- Suo Z. G., Zhao X. H., and Greene W. H., J. Mech. Phys. Solids 56, 467 (2008). 10.1016/j.jmps.2007.05.021 [DOI] [Google Scholar]
- Zhao X. H. and Suo Z. G., Appl. Phys. Lett. 91, 061921 (2007). 10.1063/1.2768641 [DOI] [Google Scholar]
- Wang Q., Tahir M., Zhang L., and Zhao X., Soft Matter 7, 6583 (2011). 10.1039/c1sm05645j [DOI] [Google Scholar]
- Wang Q. M., Zhang L., and Zhao X. H., Phys. Rev. Lett. 106, 118301 (2011). 10.1103/PhysRevLett.106.118301 [DOI] [PubMed] [Google Scholar]
- Wang Q., Tahir M., Zang J., and Zhao X., Adv. Mater. 24, 1947 (2012). 10.1002/adma.201200272 [DOI] [PubMed] [Google Scholar]
- Zhang L., Wang Q., and Zhao X., Appl. Phys. Lett. 99, 171906 (2011). 10.1063/1.3655910 [DOI] [Google Scholar]
- Zhao X. H., Hong W., and Suo Z. G., Phys. Rev. B 76, 134113 (2007). 10.1103/PhysRevB.76.134113 [DOI] [Google Scholar]
- Pelrine R., Kornbluh R., Pei Q. B., and Joseph J., Science 287, 836 (2000). 10.1126/science.287.5454.836 [DOI] [PubMed] [Google Scholar]
- Chen D., Cai S., Suo Z., and Hayward R. C., Phys. Rev. Lett. 109, 038001 (2012). 10.1103/PhysRevLett.109.038001 [DOI] [PubMed] [Google Scholar]
- See supplementary material at http://dx.doi.org/10.1063/1.4757867 for calculation of critical electric fields for electromechanical instabilities, glass transition temperatures, and fitting parameters for Ramberg-Osgood model.
- Hutchinson J. W. and Neale K. W., in Proceedings of the IUTAM Symposium on Finite Elasticity, edited by Carlson D. E. and Shield R. T. (Martinus Nijhoff, Netherlands, 1981), p. 238. [Google Scholar]
- Zhao X., J. Mech. Phys. Solids 60, 319 (2012). 10.1016/j.jmps.2011.10.005 [DOI] [Google Scholar]
- Koo H.-J., So J.-H., Dickey M. D., and Velev O. D., Adv. Mater. 23, 3559 (2011). 10.1002/adma.201101257 [DOI] [PubMed] [Google Scholar]
- Miller M. L. and Rauhut C. E., J. Polym. Sci. 38, 63 (1959). 10.1002/pol.1959.1203813307 [DOI] [Google Scholar]


