Abstract
Purpose: To develop and test an automated algorithm to classify the different tissues present in dedicated breast CT images.
Methods: The original CT images are first corrected to overcome cupping artifacts, and then a multiscale bilateral filter is used to reduce noise while keeping edge information on the images. As skin and glandular tissues have similar CT values on breast CT images, morphologic processing is used to identify the skin mask based on its position information. A modified fuzzy C-means (FCM) classification method is then used to classify breast tissue as fat and glandular tissue. By combining the results of the skin mask with the FCM, the breast tissue is classified as skin, fat, and glandular tissue. To evaluate the authors’ classification method, the authors use Dice overlap ratios to compare the results of the automated classification to those obtained by manual segmentation on eight patient images.
Results: The correction method was able to correct the cupping artifacts and improve the quality of the breast CT images. For glandular tissue, the overlap ratios between the authors’ automatic classification and manual segmentation were 91.6% ± 2.0%.
Conclusions: A cupping artifact correction method and an automatic classification method were applied and evaluated for high-resolution dedicated breast CT images. Breast tissue classification can provide quantitative measurements regarding breast composition, density, and tissue distribution.
Keywords: breast CT, cupping artifact correction, multiscale filter, fuzzy C-means, image classification, breast cancer, mammography, segmentation
INTRODUCTION
Dedicated breast CT (BCT) is a new x-ray based tomographic imaging method for breast cancer detection and diagnosis.1, 2 Compared to other breast imaging methods, e.g., mammography or ultrasound, BCT provides high-quality volumetric data that can be important in identifying disease, assessing cancer risk, and monitoring changes in breast glandular tissue distribution over time. Compared with whole-body CT, BCT involves not only changing the acquisition geometry in order to limit the primary x-ray beam to the breast but also optimizing the acquisition parameters in order to meet the special requirements of breast imaging. For example, to increase contrast, the x-ray spectra used in BCT (49–80 kVp) have lower energy than those used in whole-body CT (80–140 kVp).1 To the best of our knowledge, three types of BCT systems that can image patients have been developed; one system was designed by Boone et al.,3 one other prototype system developed by a commercial company (Koning Corporation, West Henrietta, NY), as previously described,4, 5 and a third system developed by Tornai et al.6, 7
Breast tissue classification can provide quantitative measurements regarding breast composition, density, and tissue distribution change with age. It could also aid in breast cancer detection and identification of women at high-risk. In addition, quantitative tissue classification is valuable as input to finite-element analysis algorithms to simulate breast compression for comparison to mammography.8, 9 Classified breast data can also be of use in dose estimation and computer-aided diagnosis. Although various approaches have been investigated to classify breast tissue13, 14, 15, 16 and to identify microcalcifications and tumors,17, 18, 19, 20 accurate breast tissue classification remains a challenge. Several groups have investigated histogram-based classification methods in order to separate breast tissue into three types of tissues, i.e., skin, fat, and glandular tissue. Nelson et al. used a two-compartment Gaussian fitting of the histogram followed by a region-growing algorithm for breast tissue classification.10 Chen et al. proposed an automatic volumetric segmentation scheme by partitioning a histogram into intervals followed by interval thresholding.11 Applied to volumetric breast analysis, this technique decomposes a breast volume into five subvolumes corresponding to five intensity subintervals, i.e., lower (air), low (fat), middle (normal tissue or parenchyma), high (glandular duct), and higher (calcification), in the order of the x-ray attenuation value. Packard et al. described a histogram based two-means clustering algorithm in conjunction with a seven-point median filter in order to reduce quantum noise.12
In this study, we investigated a fuzzy C-means classification approach using a cupping artifact correction and a multiscale bilateral filter. To correct inhomogeneity, we adapted a bias correction method previously developed for MR images.21 To reduce image noise, we used multiscale bilateral filters. The robustness of the proposed algorithms was demonstrated in phantoms and in patient data.
MATERIALS AND METHODS
Our image processing and classification method consists of four major steps: (1) a cupping artifact correction method is proposed to reduce the cupping artifacts on breast CT images; (2) a multiscale bilateral filter is developed to remove noise but retain edge information; (3) a modified fuzzy C-means classification method is applied to classify the breast into different types of tissues; and (4) a morphologic method is used to obtain the skin of the breast. Figure 1 shows a flow chart summarizing the proposed method. Details on the methods used for these steps are provided here. Image acquisition and validation methods are also described in this section.
Figure 1.

Flowchart of the classification algorithm.
Cupping artifact correction for breast CT images
There are two major reasons for the presence of cupping artifacts in dedicated breast CT images. Chief among them is the inclusion of scattered x rays in the CT projections. As in the projections the scatter-to-primary ratio is highest toward the center of the breast, the voxel values in the center of the reconstructed breast tend to be lower, thus resulting in cupping.22 Furthermore, hardening of the x-ray beam by the imaged breast also contributes to the cupping artifacts.23
The cupping artifacts, i.e., intensity bias, can cause serious misclassifications when intensity-based segmentation algorithms are used to classify tissue on images.24 Essentially, the misclassification is due to an overlap of the intensity range of different tissues introduced by the cupping artifacts, making the voxels in different tissues not separable based solely on their intensities.25 Two types of cupping artifact correction methods, i.e., prospective and retrospective methods, can tackle this problem. Prospective methods aim to avoid intensity inhomogeneity during the image acquisition process. These methods are capable of correcting intensity inhomogeneity induced by the imaging device. Retrospective image processing methods do not require special acquisition protocols and can be applied to remove both machine and patient-induced inhomogeneity.21 Early retrospective methods include those based on filtering,26, 27, 28 on histogram,29 and on segmentation,30, 31 For breast CT, a background nonuniformity correction method was introduced to model the cupping artifacts and to thus correct the artifact.32
Our cupping artifact correction method was inspired by a MR bias correction method.21 The correction method can be briefly described as follows. Let X be an image with L pixels and N1 grey levels, and let M be the associated image corresponding to the magnitude of the local gradient with N2 grey levels. The entropy associated to the normalized intensity-gradient joint histogram is therefore21
| (1) |
where δ is the delta function. The correction method initially models the cupping artifacts with a small number of basis functions and then increases their number as the quality of the image increases until no noticeable differences are found between the two levels of resolution.
The amplitude ω of these basis functions defines the cupping artifacts. They are calculated by minimizing the intensity-gradient joint entropy of the log-transformed, corrected image using an optimization method. The corrected image mean value was restricted to remain the same as the original so as to preserve the original contrast of the image:21
| (2) |
The cupping artifacts were modeled as a linear combination of equidistant low frequency cubic B-spline basis functions B(ω).35 In practice, this is achieved by interpolating a matrix of coefficients to the image dimensions.
In our breast CT data, the cupping artifacts are positive and slow varying, and additive noise is the main noise.33 The cupping artifacts are similar to the MR bias field that was described as a multiplicative, positive, slow varying field in the presence of additive noise. In order to evaluate if this bias correction method is suitable for CT images, three phantoms were used to mimic fat, glandular tissue, and their combination, as described in Sec. 3A. Because such an assumption for cupping artifact correction has the drawback that additive random noise is modulated, we designed a bilateral filter to process the corrected breast CT data. This method automatically corrects the cupping artifacts using a nonparametric coarse-to-fine approach which allows the cupping artifacts to be modeled with different frequency ranges and without user supervision.34 An entropy-related cost function based on the combination of intensity and gradient image features was defined for a more robust homogeneity measurement. Such entropy was measured using not only image intensities but also image local gradients as homogeneous images exhibit not only well-ordered intensities but also well-clustered very low gradient values in homogeneous regions.
The method starts with a coefficient matrix of size 3 × 3 × 3 with all of its values set to one (null cupping artifacts). The strategy updates these values while the entropy of the corrected image is decreased. The initial and minimum step is used to modify each coefficient in this coefficient matrix. Through optimizing each coefficient, the entropy of the corrected image is minimized. When the entropy value becomes stable, the number of coefficients of the matrix is increased using B-spline interpolation and the process is repeated. In our study, the number of basis function is increased along levels, and it was set to 3, 5, 7, 9, and 11, respectively. N1 = 128 and N2 = 100. The number of iterations varies in our study. It mainly depended on the size of the breast and the tolerance of the energy function. The initial step was set to 0.01 and the minimum step to 0.001. The algorithm ends when no significant difference is found between the two levels of resolution. Overall, each patient took 15–20 min to obtain the cupping artifacts using MATLAB 2010a on a Dell T7500 (Dual cores 2.00GHz/8G RAM).
Multiscale filtering
Multiscale filter is the second preprocessing step for BCT images before automatic breast tissue classification. Noise in BCT images can induce classification regions to become disconnected. Bilateral filtering is a nonlinear filtering technique introduced by Tomasi.36 This filter is a weighted average of the local neighborhood samples, where the weights are computed based on temporal (or spatial in case of images) and radiometric distance between the center sample and the neighboring samples.37 It smoothes images while preserving edges, by means of a nonlinear combination of nearby image values. Bilateral filtering can remove noise at intraregions while preserving the inter-region edge.38
For input discrete image I the goal of the multiscale bilateral decomposition is to first build a series of filtered images I i that preserve the strongest edges in I while smoothing small changes in intensity. We suppose that the original image is the 0th scale (i = 0), i.e., set I0 = I, and then iteratively apply the bilateral filter to compute
| (3) |
where n is a pixel coordinate, Wσ(x) = exp ( − x2/σ2), σs,i and σr,i are the widths of the spatial and range Gaussians, respectively, and k is an offset relative to n that runs across the support of the spatial Gaussian. The repeated convolution by increases the spatial smoothing at each scale i. Suppose that at the finest scale, we set the spatial kernel σs,i = 2i−1σs (i > 0). Here we set σs to 2. The range Gaussian is an edge-stopping function. If an edge is strong enough to survive after several iterations of the bilateral decomposition, it will be kept and preserved. To ensure this property we set σr,i = σr/2i−1. Reducing the width of the range Gaussian by a factor of 2 at every scale reduces the chance that an edge that barely survives one iteration will be smoothed away in later iterations. In our filter processing, the intensity of breast CT images was transferred to unsigned integer 8 bit (0-255), and we set the initial width σr to 12.
Breast tissue classification
We use a fuzzy C-means (FCM) classification method to classify the breast into three types of tissue: skin, fat, and glandular tissue. Classification of BCT images can be challenging because BCT images are affected by multiple factors such as noise and intensity inhomogeneity. At the same time, as skin and glandular tissues have similar CT values in BCT images,10 thresholding-based methods are not sufficient to obtain adequate classification. The FCM algorithm is an iterative method that produces an optimal partition for an image by minimizing the weighted intergroup sum of the squared error objective function.39 This procedure converges to a local minimum or a saddle point of the FCM objective function. Each voxel is assigned a high membership to a class whose center is close to the intensity of the voxel, and a low membership is given when the voxel intensity is far from the class centroid.39 In general, the final classification is reached by assigning each voxel solely to the class with the highest membership value for the voxel.40 On breast CT images, skin and glandular tissues have similar CT values.10 We used FCM to classify the corrected and noise filtered BCT images into two classes, one being fat tissue and the other being glandular and skin tissue.
Morphologic operations for the skin
To separate glandular from skin tissue, we use position information. It has been reported that the skin thickness in breast is 1.45 ± 0.30 mm.41, 42 We can calculate the skin voxels based on the voxel size of the breast CT images. In our studies, as the breast CT voxel size is 0.27 × 0.27 × 0.27 mm3, we constrain the skin thickness within seven voxels. We use a threshold to obtain the “outer” mask for the whole breast. We used the percentage of the maximal intensity to determine the threshold. For example, we used 85% of the intensity of the second peak in the intensity histogram (the first peak is the background). A 9 × 9 × 9 box is then used to perform erosion operations in order to obtain the “inner” mask for the tissue inside the skin. The skin mask is obtained by subtracting the inner mask from the outer mask. By combining the skin mask and the two-class results from FCM, skin can be obtained.
Breast CT image acquisition from phantoms and human patients
To evaluate the proposed methods, we used a breast CT prototype system (Koning Corporation, West Henrietta, NY) to acquire both phantom and patient images. In this system, a complete BCT scan entails the acquisition of 300 projections over a full 360° revolution of the x-ray tube and detector in 10 s. The Koning system has a fixed tube voltage of 49 kVp, which, as we described previously, results in an x-ray spectrum with a first half value layer of 1.39 mm Al.43 The appropriate tube current for each imaged breast is automatically selected by the system based on two scout projection images, with the maximum allowed tube current set at 100 mA, thus resulting in a mean glandular dose to an average breast of approximately 8.5 mGy.43 The detector pixel size is 388 μm, thus resulting in acquired CT images with a reconstructed voxel size of 0.27 × 0.27 × 0.27 mm3. The FDK algorithm was used to reconstruct the images,44 and no scatter correction method was applied.
In order to evaluate the cupping artifact correction method, we designed three phantoms using plastic bottles. These bottles were filled with water, a mixture of oil and water (ratio: 1:4), and oil, respectively. The oil was used to simulate fat, while the water simulates glandular tissue. These surrogates for breast tissue have been used previously for other investigations in breast imaging.43, 45, 46 The acquisition of these phantom images was performed in the standard way as described above.
This human study was approved by the Institutional Review Board (IRB) of Emory University. For the testing of the image processing methods with patient images, eight patient breast cases were acquired. For the classification evaluation, 10 image slices were selected for the CT volume of each patient. A total of 80 image slices were used for the manual segmentation and the classification evaluation.
Classification evaluation
In order to evaluate the automated classification method, manual segmentation was performed by a radiologist who is one of the authors (S.W.) and who has more than 10 yr of experience in CT imaging. Analyze 10.0 (AnalyzeDirect Inc, Overland Park, KS) was used for manual segmentation that was conducted without knowledge of the computer segmentation results. The manual segmentation consisted of seven steps performed in Analyze 10.0: (1) Use a five-point 3D median filter to smooth the 3D images. (2) Select 10 2D images from the 3D volume data for segmentation. (3) Set a threshold for each of the 10 selected images to obtain the breast mask. (4) Generate an inner skin mask by increasing the previous threshold in order to obtain a clear visualization of the skin and by manually selecting points along the inner boundary of the skin. (5) Segment the skin by combining the previous breast mask and the skin inner mask. (6) Segment the glandular tissue using multiple operator-selected thresholds, each applied to small areas of the image. Because of the presence of the cupping artifacts, a threshold to separate adipose from glandular voxels may only work for small regions. The final segmented glandular tissue is a combination of these individual regions. (7) Segment fat by subtracting skin and glandular tissue from the breast mask. This manual process often required more than 1 h per image.
The Dice overlap ratios were used as the performance assessment metric for the breast classification algorithm. The Dice overlap ratio was computed as follows:
| (4) |
where S represents the voxels of one type of tissue automatically classified by the algorithm and G represents the voxels of the corresponding gold standard obtained from manual segmentation.
RESULTS
Cupping artifact correction
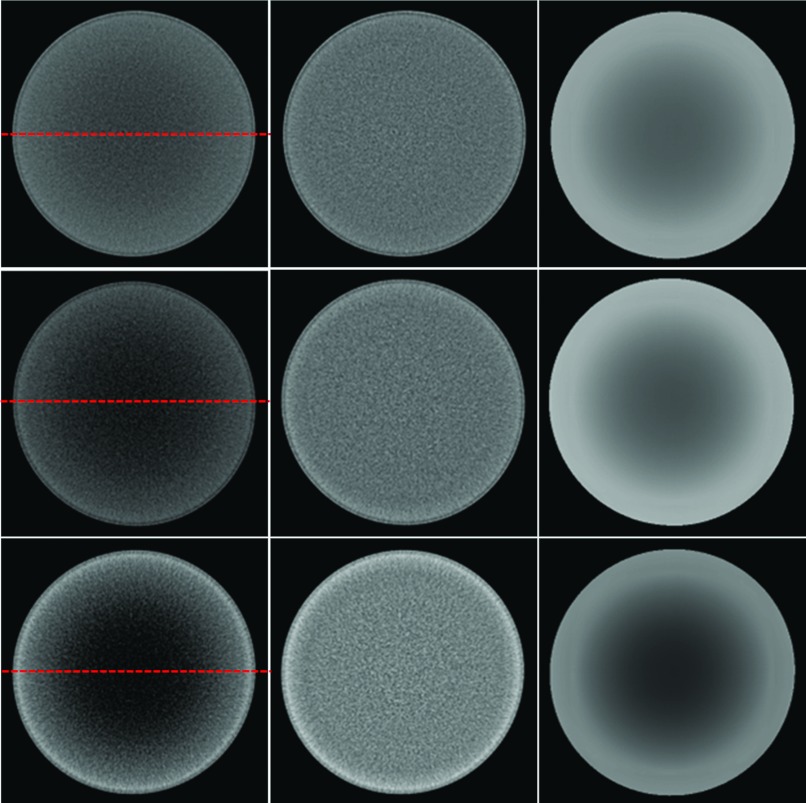
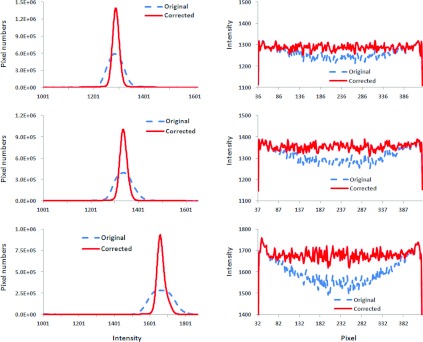
Figure 2 shows the images from the three phantoms filled with water, mixture of water and oil, and oil, respectively, showing the substantial cupping present precorrection. All three corrected images demonstrate a more uniform signal within the phantom. Figure 3 shows the intensity comparison with and without cupping artifact correction of the images in Fig. 2, where a narrowing of the histogram can be seen, indicating the improvement in signal uniformity. The effectiveness of the correction can also be seen in the line profiles in Fig. 3, where the distinct cupping originally present is removed.
Figure 2.
Cupping artifact correction for phantom images. Left panel: Original CT images from the phantom filled with oil (top), mixture of oil and water at a ratio of 1:4 (middle), and water (bottom). Horizontal lines on the images are used to show the profiles in Fig. 3. Center panel: Corrected CT images. Right panel: Computed cupping artifacts.
Figure 3.
Histograms and intensity profiles before and after cupping artifact correction. Left: Intensity histograms of original and corrected CT images for three scans as shown in Fig. 2. Right: Intensity profiles before and after correction. Signals were extracted from the lines in the images as shown in Fig. 2.
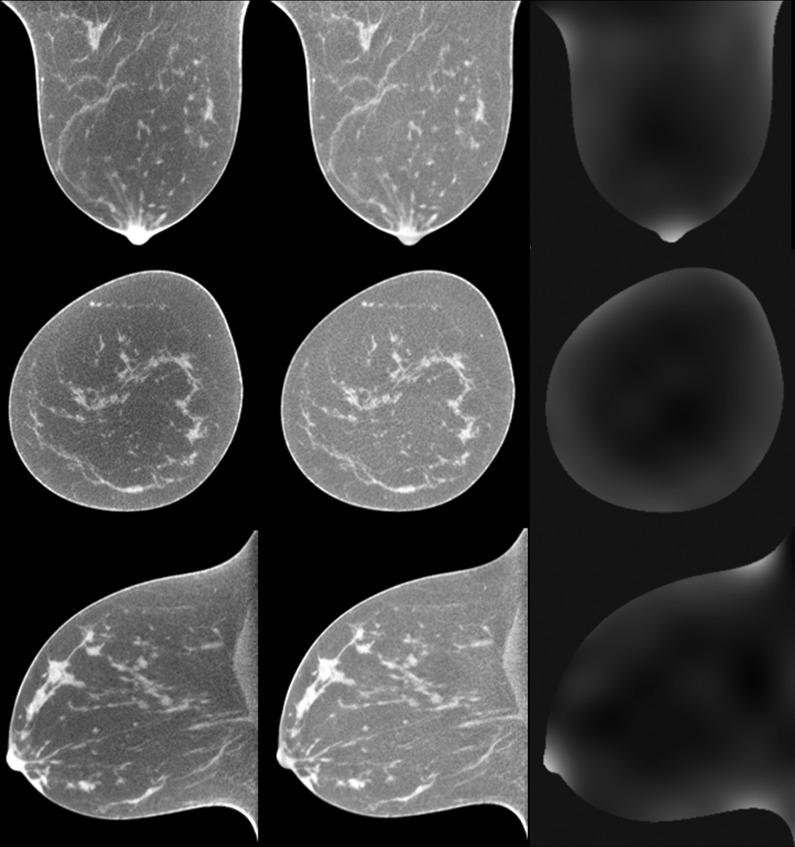
Figure 4 shows the breast images of patient number 5 before and after cupping artifact correction. It is noted that the cupping artifacts of a human breast are not linear and it can be more complicated than that in a breast phantom. This is because the phantom was filled with one material. However, a human breast can include 3–4 types of tissue with different attenuation coefficients, such as skin, fat, and glandular tissue, and sometimes calcification. The cupping artifacts of a human breast depend on the structure and distribution of each type of tissue in the breast.
Figure 4.
Comparison of breast CT images before (left panel) and after (center panel) cupping artifact correction (patient #5). Breast CT images are from the same patient and are shown in three orthogonal directions. Right panel: Corresponding cupping artifacts in each direction.
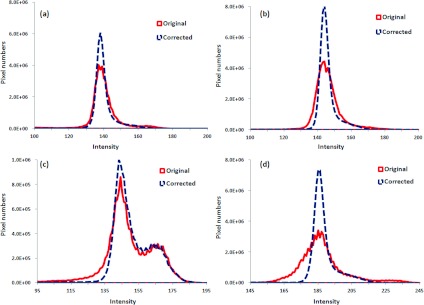
Figure 5 shows the comparison of histograms before and after cupping artifact correction for four patients. The improvement in signal uniformity for the breast CT images is indicated by the narrower peaks in the histograms of the corrected images.
Figure 5.
Comparison of histograms before and after cupping artifact correction for four patients [patient #3(a), #4 (b), #8 (c), and #7(d)].
Multiscale filtering
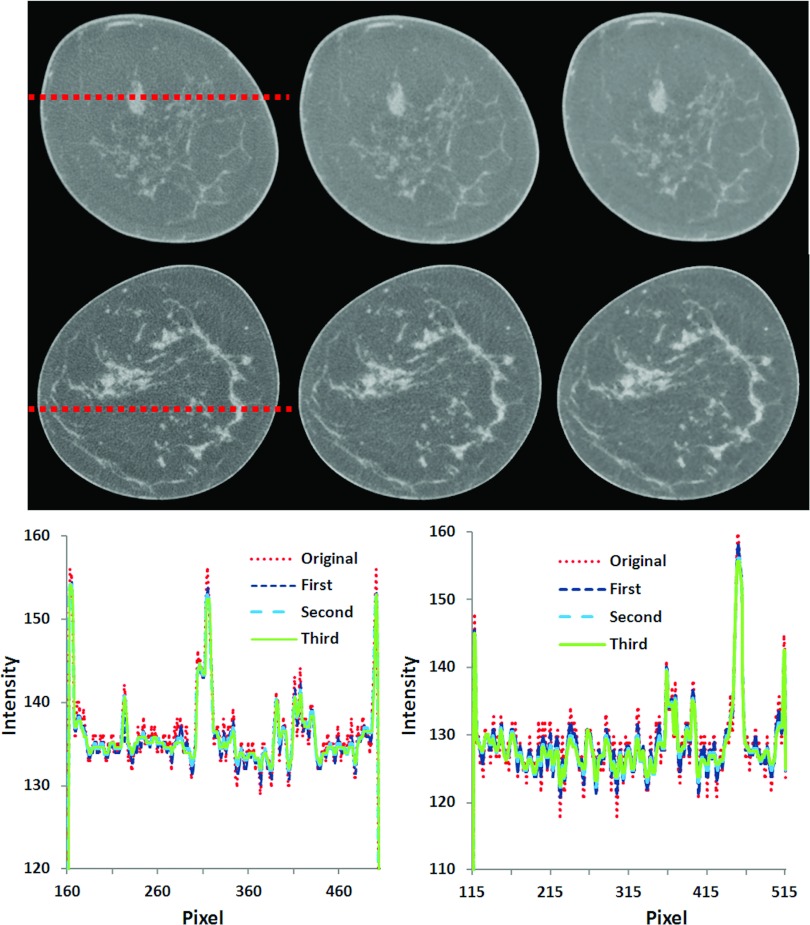
Figure 6 shows qualitative visual and quantified comparison for two breast CT images from two patients (number 2 and 3) after multiscale filtering. From the line profiles, it can be seen that the bilateral filtering method can effectively suppress noise but keep important edge information of different types of tissues.
Figure 6.
Multiscale bilateral filtering for breast CT images (patients #3 and #2). Images from left to right: Original breast CT images, filtered images after the first scale, and filtered images after the third scale. Bottom: Signal profiles before and after filtering for the images on the top (left) and at the middle row (right).
Breast tissue classification
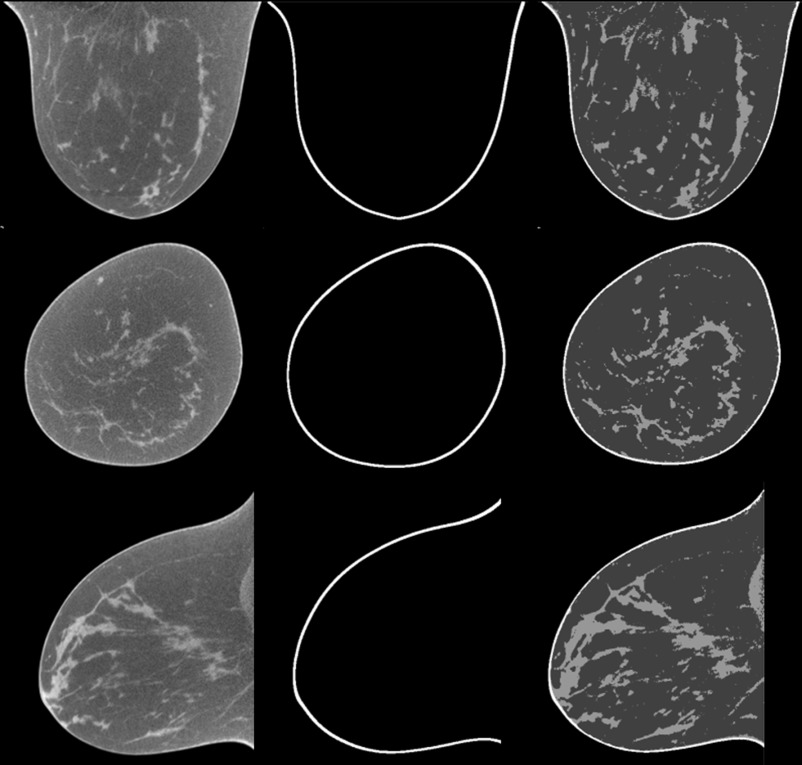
Figure 7 shows the classification results of one typical patient (number 6, volumetric glandular density 6.4%). Visual assessment shows that the classification method is able to classify the breast into glandular, fatty, and skin tissue.
Figure 7.
Classification results of breast CT images from human patient #6. The original breast CT images (left) were classified into three tissue types: the skin (middle) and glandular and fatty tissue (right) where the glandular tissue shows higher intensity than fatty tissue.
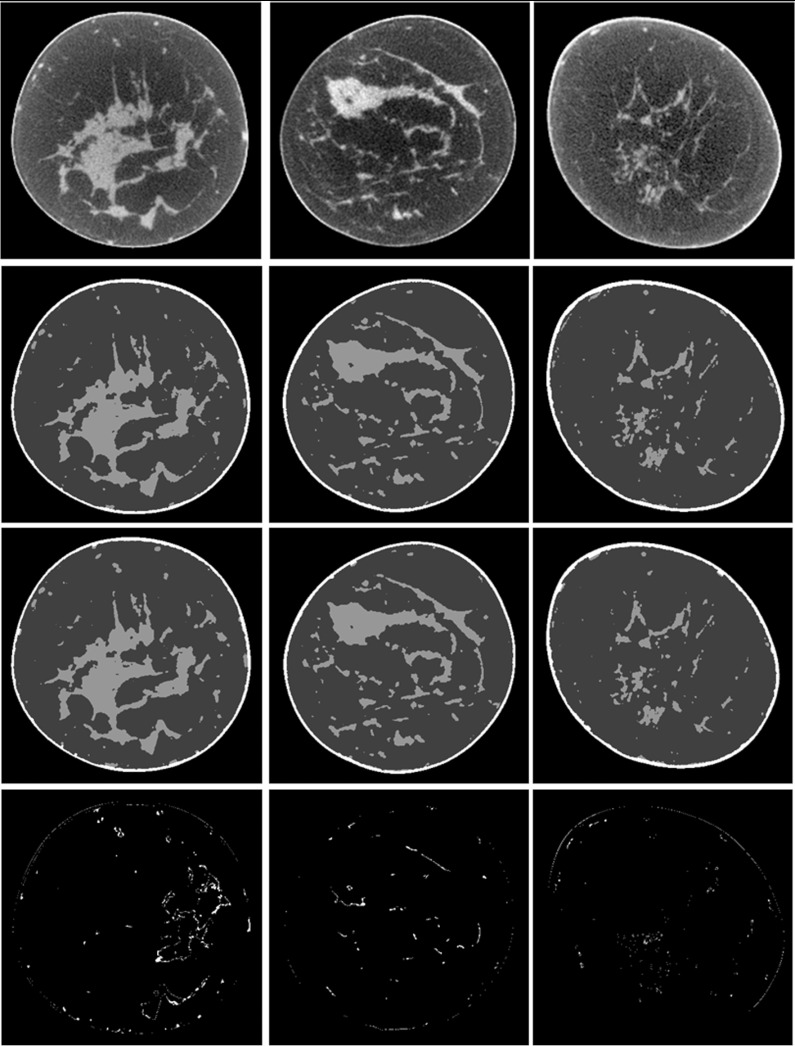
Figure 8 shows the classification results from three patients with different percentages of glandular tissue (numbers 2, 3, and 4). The difference images show that the automatic classification is close to the results of manual segmentation, which indicate a good performance of the automatic classification method.
Figure 8.
Classification results of breast CT images. From top to bottom: Original breast CT images, manual segmentation, automatic classification, and difference images between manual segmentation and automatic classification. From left to right: three different patients with different percentages of glandular tissue (patient #2, #3, and #4).
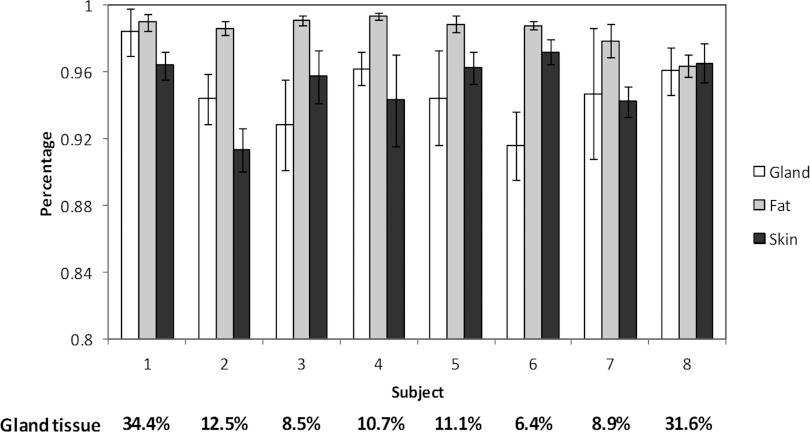
Figure 9 illustrates the Dice overlap ratios of the automated and manual segmentation of glandular, fat, and skin tissues of the eight patients. The overlap ratios were 97.9% ± 3.9%, 91.4% ± 1.3%, and 91.6% ± 2.0% for fat, skin, and glandular tissues, respectively. The results from the eight patients demonstrate that the cupping artifact correction and automatic classification methods are able to accurately classify the glandular, fatty, and skin tissue from high-resolution, breast CT images.
Figure 9.
Quantitative evaluation of the breast tissue classification for eight human patients. The Y axis is the overlap ratio between manual and automatic classification for the skin, glandular, and fatty tissue in the breast. The bars show the mean and standard deviations of the results from ten slices for each patient. The percentage of the glandular tissue is listed at the bottom for each patient.
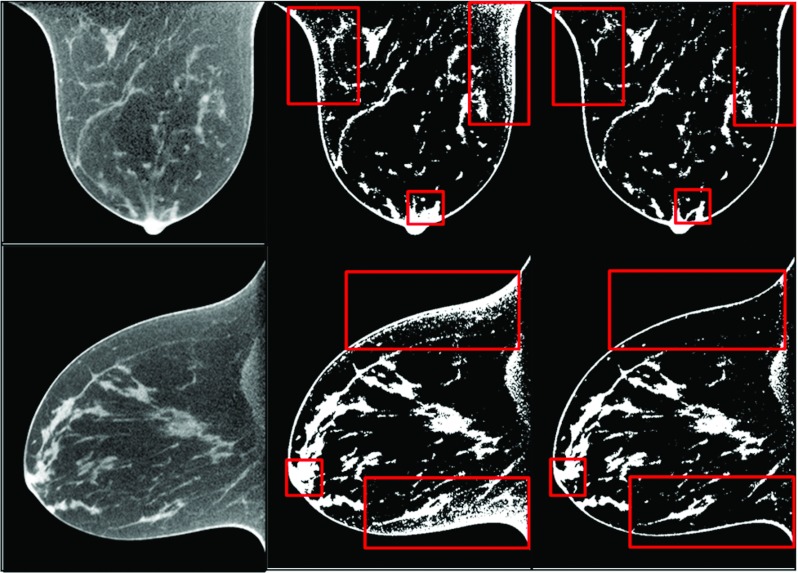
In order to evaluate the effect of cupping artifact correction processing on classification accuracy, we classified both the original and corrected images. Figure 10 shows the visual assessment of classification results between original, corrected, and filtered CT images. At the regions inside the boxes, the classified binary images of the corrected images show accurate classification while the results of the original images have artifacts. This shows that the preprocessing method is required to achieve an adequate classification.
Figure 10.
Original BCT images (left panel) and the classification results without correction (central panel) and with correction and filtering (right panel). The boxed regions show that the corrected images demonstrate accurate tissue classification while the uncorrected images were not able to produce good classification due to noise and cupping artifacts.
In order to evaluate robustness of our method, we added Gaussian noise to the breast CT images and then performed classification on images at different noise levels. The standard deviation of the Gaussian noise is 4% and 8% of the maximum intensity of the CT image. When the noise level is 8%, the Dice overlap ratios of the fat, skin, and glandular tissues for the 80 image slices of the eight patients are 97.4% ± 0.0%, 89.4% ± 0.1%, and 87.7% ± 0.5%, respectively. These results demonstrate the robustness of the algorithm for noisy images, which is important when low radiation dose is used for breast CT imaging.
After classification, breast tissue composition analysis was performed to estimate the percentage of glandular tissue within the breast for each of the eight patients. These percentages, along with the breast imaging-reporting and data system (BI-RADS) density classification of the clinical mammograms of the eight patients, are listed in Table 1. For the eight subjects, the percentage of glandular tissue ranges from 8.5% to 31.6%. These glandular fraction values are consistent with those recently reported by Yaffe et al.47
Table 1.
Volumetric density and BI-RADS density classification of the mammograms of the eight patients.
| Patient | 1 | 2 | 3 | 4 | 5 | 6 | 7 | 8 |
|---|---|---|---|---|---|---|---|---|
| Volume density | 34.4 | 12.5 | 8.5 | 10.7 | 11.1 | 6.4 | 8.9 | 31.6 |
| (%) | ||||||||
| BI-RADS | 3 | 2 | 2 | 2 | 3 | 2 | 2 | 3 |
DISCUSSION
An automatic breast CT classification approach based on FCM and cupping artifact correction and multiscale bilateral filtering was investigated. The comparison of the automated tissue classification results with those obtained manually shows that our proposed method yields accurate classification of the skin, fat, and glandular tissue. Accurate classification provides quantitative measurements of breast tissue composition, density, and distribution.
In the proposed breast tissue classification method, we adapted a bias correction method to correct the cupping artifacts and used multiscale bilateral filtering to reduce image noise. Since the skin and glandular tissues have similar HU values on breast CT images, morphologic processing was used to identify the skin based on its position information. In a previously reported, histogram-based method,10 seed points need to be placed manually. Noise and cupping artifacts can affect the histogram and thereby can affect its classification accuracy. In another previously reported method,12 a 2D parabolic correction was applied to flatten the fatty tissue on each slice. This method hence lacked 3D information for the cupping artifact correction. In our method, we used a 3D cupping artifact correction method in order to remove the cupping artifacts and thus accurately classify the three types of breast tissues. Although our cupping artifact correction and classification methods were applied to 3D volume data, bilateral filtering was performed slice by slice due to the computational time required by 3D bilateral filters. In future work, we will investigate the use of a fast 3D bilateral filtering algorithm.
A limitation of this study may be the relatively small size of the patient-based testing. Given that obtaining the gold standard (manual segmentation) of breast CT is very time consuming, we were only able to compare our automated method to a total of 80 slices acquired from eight different patients. Ideally the manual segmentation would be performed by several radiologists, on higher number of slices spanning more patients. However, it should be noted that the variations in the Dice ratios were relatively narrow, both intrapatient and interpatient, showing a consistency in the accuracy of the automated classification that may signify a small gain in knowledge if additional cases were tested. In addition, all breast CT images were acquired with the same system, so how the algorithm behaves with variations in acquisition geometry and/or parameters, e.g., voxel size, tube voltage, etc., was not investigated.
In addition to investigating the use of fast 3D bilateral filtering, other future studies that will take advantage of the proposed algorithm include characterizing the homogeneous tissue mixture approximation in breast imaging dosimetry and studying the relationship between volumetric and areal glandular tissue density and BI-RADS density classification.
CONCLUSION
We developed an automated classification approach for high-resolution images from dedicated breast CT. By correcting the cupping artifacts, reducing the image noise, and performing the classification using FCM clustering and morphological operations, this algorithm is able to classify breast tissue into three primary constituents: skin, fat, and glandular tissue. The accuracy of the classification approach was demonstrated through a pilot study of eight patients. The classification method can provide a quantification tool for breast CT imaging applications.
ACKNOWLEDGMENTS
This research was supported in part by National Institutes of Health (NIH) Grants Nos. R01CA156775 (PI: B. Fei), R01CA163746 (PI: I. Sechopoulos), Georgia Cancer Coalition Distinguished Clinicians and Scientists Award (PI: B. Fei), Emory Molecular and Translational Imaging Center (NIH P50CA128301), SPORE in Head and Neck Cancer (NIH P50CA128613), and Atlanta Clinical and Translational Science Institute (ACTSI) that is supported by the PHS Grant No. UL1 RR025008 from the Clinical and Translational Science Award program. The content is solely the responsibility of the authors and does not necessarily represent the official views of the National Cancer Institute or the National Institutes of Health.
References
- Boone J. M., Nelson T. R., Lindfors K. K., and Seibert J. A., “Dedicated breast CT: Radiation dose and image quality evaluation,” Radiology 221(3), 657–667 (2001). 10.1148/radiol.2213010334 [DOI] [PubMed] [Google Scholar]
- Lindfors K. K., Boone J. M., Nelson T. R., Yang K., Kwan A. L., and Miller D. F., “Dedicated breast CT: Initial clinical experience,” Radiology 246, 725–733 (2008). 10.1148/radiol.2463070410 [DOI] [PMC free article] [PubMed] [Google Scholar]
- Boone J. M., Shah N., and Nelson T. R., “A comprehensive analysis of DgN(CT) coefficients for pendant-geometry cone-beam breast computed tomography,” Med. Phys. 31, 226–235 (2004). 10.1118/1.1636571 [DOI] [PubMed] [Google Scholar]
- Chen B. and Ning R., “Cone-beam volume CT breast imaging: Feasibility study,” Med. Phys. 29, 755–770 (2002). 10.1118/1.1461843 [DOI] [PubMed] [Google Scholar]
- Benitez R. B., Ning R., Conover D., and Liu S., “NPS characterization and evaluation of a cone beam CT breast imaging system,” J. X-Ray Sci. Technol. 17, 17–40 (2009). 10.3233/XST-2009-0213 [DOI] [PubMed] [Google Scholar]
- Crotty D. J., Brady S. L., Jackson D. V. C., Toncheva G. I., Anderson C. E., Yoshizumi T. T., and Tornai M. P., “Investigating the dose distribution in the uncompressed breast with a dedicated CT mammotomography system,” Proc. SPIE 7622, 762229–762212 (2010). 10.1117/12.845433 [DOI] [Google Scholar]
- McKinley R. L., Tornai M. P., Samei E., and Bradshaw M. L., “Initial study of quasi-monochromatic x-ray beam performance for x-ray computed mammotomography,” IEEE Trans. Nucl. Sci. 52, 1243–1250 (2005). 10.1109/TNS.2005.857629 [DOI] [Google Scholar]
- Kellner A. L., Nelson T. R., Cervino L. I., and Boone J. M., “Simulation of mechanical compression of breast tissue,” IEEE Trans. Biomed. Eng. 54, 1885–1891 (2007). 10.1109/TBME.2007.893493 [DOI] [PubMed] [Google Scholar]
- Zyganitidis C., Bliznakova K., and Pallikarakis N., “A novel simulation algorithm for soft tissue compression,” Med. Biol. Eng. Comput. 45, 661–669 (2007). 10.1007/s11517-007-0205-y [DOI] [PubMed] [Google Scholar]
- Nelson T. R., Cervino L. I., Boone J. M., and Lindfors K. K., “Classification of breast computed tomography data,” Med. Phys. 35, 1078–1086 (2008). 10.1118/1.2839439 [DOI] [PMC free article] [PubMed] [Google Scholar]
- Chen Z., “Histogram partition and interval thresholding for volumetric breast tissue segmentation,” Comput. Med. Imaging Graph. 32, 1–10 (2008). 10.1016/j.compmedimag.2007.07.007 [DOI] [PubMed] [Google Scholar]
- Packard N. and Boone J. M., “Glandular segmentation of cone beam breast CT volume images,” Proc. SPIE 6510, 651038-1–651038-8 (2007). 10.1117/12.713911 [DOI] [Google Scholar]
- Anderson N. H., Hamilton P. W., Bartels P. H., Thompson D., Montironi R., and Sloan J. M., “Computerized scene segmentation for the discrimination of architectural features in ductal proliferative lesions of the breast,” J. Pathol. 181, 374–380 (1997). [DOI] [PubMed] [Google Scholar]
- Samani A., Bishop J., and Plewes D. B., “A constrained modulus reconstruction technique for breast cancer assessment,” IEEE Trans. Med. Imaging 20, 877–885 (2001). 10.1109/42.952726 [DOI] [PubMed] [Google Scholar]
- Chang Y. H., Wang X. H., Hardesty L. A., Chang T. S., Poller W. R., Good W. F., and Gur D., “Computerized assessment of tissue composition on digitized mammograms,” Acad. Radiol. 9, 899–905 (2002). 10.1016/S1076-6332(03)80459-2 [DOI] [PubMed] [Google Scholar]
- Stines J. and Tristant H., “The normal breast and its variations in mammography,” Eur. J. Radiol. 54, 26–36 (2005). 10.1016/j.ejrad.2004.11.017 [DOI] [PubMed] [Google Scholar]
- Wu Y., Doi K., Giger M. L., and Nishikawa R. M., “Computerized detection of clustered microcalcifications in digital mammograms: Applications of artificial neural networks,” Med. Phys. 19, 555–560 (1992). 10.1118/1.596845 [DOI] [PubMed] [Google Scholar]
- Cheng H. D., Cai X., Chen X., Hu L., and Lou X., “Computer-aided detection and classification of microcalcifications in mammograms: A survey,” Pattern Recogn. 36, 2967–2991 (2003). 10.1016/S0031-3203(03)00192-4 [DOI] [Google Scholar]
- Ge J., Sahiner B., Hadjiiski L. M., Chan H. P., Wei J., Helvie M. A., and Zhou C., “Computer aided detection of clusters of microcalcifications on full field digital mammograms,” Med. Phys. 33, 2975–2988 (2006). 10.1118/1.2211710 [DOI] [PubMed] [Google Scholar]
- Reiser I., Nishikawa R. M., Giger M. L., Boone J. M., Lindfors K. K., and Yang K., “Automated detection of mass lesions in dedicated breast CT: A preliminary study,” Med. Phys. 39, 866–873 (2012). 10.1118/1.3678991 [DOI] [PMC free article] [PubMed] [Google Scholar]
- Manjon J. V., Lull J. J., Carbonell-Caballero J., Garcia-Marti G., Marti-Bonmati L., and Robles M., “A nonparametric MRI inhomogeneity correction method,” Med. Image Anal. 11, 336–345 (2007). 10.1016/j.media.2007.03.001 [DOI] [PubMed] [Google Scholar]
- Kwan A. L., Boone J. M., and Shah N., “Evaluation of x-ray scatter properties in a dedicated cone-beam breast CT scanner,” Med. Phys. 32, 2967–2975 (2005). 10.1118/1.1954908 [DOI] [PubMed] [Google Scholar]
- Shikhaliev P. M., “Beam hardening artefacts in computed tomography with photon counting, charge integrating and energy weighting detectors: A simulation study,” Phys. Med. Biol. 50, 5813–5827 (2005). 10.1088/0031-9155/50/24/004 [DOI] [PubMed] [Google Scholar]
- Li C., Huang R., Ding Z., Gatenby C., Metaxas D., and Gore J., “A variational level set approach to segmentation and bias correction of images with intensity inhomogeneity,” Med. Image Comput. Comput. Assist. Interv. 11, 1083–1091 (2008). 10.1007/978-3-540-85990-1_130 [DOI] [PMC free article] [PubMed] [Google Scholar]
- Yang X. F. and Fei B. W., “A wavelet multiscale denoising algorithm for magnetic resonance (MR) images,” Meas. Sci. Technol. 22, 025803–025814 (2011). 10.1088/0957-0233/22/2/025803 [DOI] [PMC free article] [PubMed] [Google Scholar]
- Lewis E. B. and Fox N. C., “Correction of differential intensity inhomogeneity in longitudinal MR images,” Neuroimage 23, 75–83 (2004). 10.1016/j.neuroimage.2004.04.030 [DOI] [PubMed] [Google Scholar]
- Dawant B. M., Zijdenbos A. P., and Margolin R. A., “Correction of intensity variations in MR images for computer-aided tissue classification,” IEEE Trans. Med. Imaging 12, 770–781 (1993). 10.1109/42.251128 [DOI] [PubMed] [Google Scholar]
- Meyer C. R., Bland P. H., and Pipe J., “Retrospective correction of intensity inhomogeneities in MRI,” IEEE Trans. Med. Imaging 14, 36–41 (1995). 10.1109/42.370400 [DOI] [PubMed] [Google Scholar]
- Sled J. G., Zijdenbos A. P., and Evans A. C., “A nonparametric method for automatic correction of intensity nonuniformity in MRI data,” IEEE Trans. Med. Imaging 17, 87–97 (1998). 10.1109/42.668698 [DOI] [PubMed] [Google Scholar]
- Styner M., Brechbuhler C., Szekely G., and Gerig G., “Parametric estimate of intensity inhomogeneities applied to MRI,” IEEE Trans. Med. Imaging 19, 153–165 (2000). 10.1109/42.845174 [DOI] [PubMed] [Google Scholar]
- Ahmed M. N., Yamany S. M., Mohamed N., Farag A. A., and Moriarty T., “A modified fuzzy C-means algorithm for bias field estimation and segmentation of MRI data,” IEEE Trans. Med. Imaging 21, 193–199 (2002). 10.1109/42.996338 [DOI] [PubMed] [Google Scholar]
- Altunbas M. C., Shaw C. C., Chen L., Lai C., Liu X., Han T., and Wang T., “A post-reconstruction method to correct cupping artifacts in cone beam breast computed tomography,” Med. Phys. 34, 3109–3118 (2007). 10.1118/1.2748106 [DOI] [PMC free article] [PubMed] [Google Scholar]
- Yang K., Huang S. Y., Packard N. J., and Boone J. M., “Noise variance analysis using a flat panel x-ray detector: A method for additive noise assessment with application to breast CT applications,” Med. Phys. 37, 3527–3537 (2010). 10.1118/1.3447720 [DOI] [PMC free article] [PubMed] [Google Scholar]
- Yang X. F., Sechopoulos I., and Fei B. W., “Automatic tissue classification for high-resolution breast CT images based on bilateral filtering,” Proc. SPIE 7962, 79623H (2011). 10.1117/12.877881 [DOI] [PMC free article] [PubMed] [Google Scholar]
- Choi Y. and Lee S., “Injectivity conditions of 2D and 3D uniform cubic B-spline functions,” Graphical Models 62, 411–427 (2000). 10.1006/gmod.2000.0531 [DOI] [Google Scholar]
- Tomasi C. and Manduchi R., “Bilateral filtering for gray and color images,” in Proceedings of the Sixth International Conference on Computer Vision (Bombay, India, 1998), pp. 839–846. 10.1109/ICCV.1998.710815 [DOI]
- Yang X. and Fei B., “A skull segmentation method for brain MR images based on multiscale bilateral filtering scheme,” Proc. SPIE 7623, 76233K1–76233K8 (2010). 10.1117/12.844677 [DOI] [Google Scholar]
- Fattal R., Agrawala M., and Rusinkiewicz S., “Multiscale shape and detail enhancement from multi-light image collections,” ACM Trans. Graphics 26, 1–9 (2007). 10.1145/1276377.1276441 [DOI] [Google Scholar]
- Yang X. F. and Fei B. W., “A multiscale and multiblock fuzzy C-means classification method for brain MR images,” Med. Phys. 38, 2879–2891 (2011). 10.1118/1.3584199 [DOI] [PMC free article] [PubMed] [Google Scholar]
- Wang H. S. and Fei B. W., “A modified fuzzy C-means classification method using a multiscale diffusion filtering scheme,” Med. Image Anal. 13, 193–202 (2009). 10.1016/j.media.2008.06.014 [DOI] [PMC free article] [PubMed] [Google Scholar]
- Willson S. A., Adam E. J., and Tucker A. K., “Patterns of breast skin thickness in normal mammograms,” Clin. Radiol. 33, 691–693 (2001). 10.1016/S0009-9260(82)80407-8 [DOI] [PubMed] [Google Scholar]
- Huang S. Y., Boone J. M., Yang K., Kwan A. L., and Packard N. J., “The effect of skin thickness determined using breast CT on mammographic dosimetry,” Med. Phys. 35, 1199–1206 (2008). 10.1118/1.2841938 [DOI] [PMC free article] [PubMed] [Google Scholar]
- Sechopoulos I., Feng J. S., and Dorsi C. J., “Dosimetric characterization of a dedicated breast computed tomography clinical prototype,” Med. Phys. 37, 4110–4121 (2010). 10.1118/1.3457331 [DOI] [PMC free article] [PubMed] [Google Scholar]
- Feldkamp L. A., Davis L. C., and Kress J. W., “Practical cone-beam algorithm,” J. Opt. Soc. Am. A 1, 612–619 (1984). 10.1364/JOSAA.1.000612 [DOI] [Google Scholar]
- Tayama Y., Takahashi N., Oka T., Takahashi A., Aratake M., Saitou T., and Inoue T., “Clinical evaluation of the effect of attenuation correction technique on F-18-fluoride PET images,” Ann. Nucl. Med. 21, 93–99 (2007). 10.1007/BF03033986 [DOI] [PubMed] [Google Scholar]
- Liu K., Liu X., Zeng Q., Zhang Y., Tu L., Liu T., Kong X., Wang Y., Cao F., Lambrechts S. A., Aalders M. C., and Zhang H., “Covalently assembled NIR nanoplatform for simultaneous fluorescence imaging and photodynamic therapy of cancer cells,” ACS Nano 6, 4054–4062 (2012). 10.1021/nn300436b [DOI] [PubMed] [Google Scholar]
- Yaffe M. J., Boone J. M., Packard N., Alonzo-Prouix O., Huang S. Y., Peressotti C. L., Al-Mayah A., and Brock K., “The myth of the 50-50 breast,” Med. Phys. 36, 5437–5443 (2009). 10.1118/1.3250863 [DOI] [PMC free article] [PubMed] [Google Scholar]


