Abstract
Purpose: Combined MR/PET is a relatively new, hybrid imaging modality. A human MR/PET prototype system consisting of a Siemens 3T Trio MR and brain PET insert was installed and tested at our institution. Its present design does not offer measured attenuation correction (AC) using traditional transmission imaging. This study is the development of quantification tools including MR-based AC for quantification in combined MR/PET for brain imaging.
Methods: The developed quantification tools include image registration, segmentation, classification, and MR-based AC. These components were integrated into a single scheme for processing MR/PET data. The segmentation method is multiscale and based on the Radon transform of brain MR images. It was developed to segment the skull on T1-weighted MR images. A modified fuzzy C-means classification scheme was developed to classify brain tissue into gray matter, white matter, and cerebrospinal fluid. Classified tissue is assigned an attenuation coefficient so that AC factors can be generated. PET emission data are then reconstructed using a three-dimensional ordered sets expectation maximization method with the MR-based AC map. Ten subjects had separate MR and PET scans. The PET with [11C]PIB was acquired using a high-resolution research tomography (HRRT) PET. MR-based AC was compared with transmission (TX)-based AC on the HRRT. Seventeen volumes of interest were drawn manually on each subject image to compare the PET activities between the MR-based and TX-based AC methods.
Results: For skull segmentation, the overlap ratio between our segmented results and the ground truth is 85.2 ± 2.6%. Attenuation correction results from the ten subjects show that the difference between the MR and TX-based methods was <6.5%.
Conclusions: MR-based AC compared favorably with conventional transmission-based AC. Quantitative tools including registration, segmentation, classification, and MR-based AC have been developed for use in combined MR/PET.
Keywords: combined MR/PET, image registration, segmentation, classification, attenuation correction, neuroimaging
INTRODUCTION
Combined MR/PET is an emerging imaging modality that can provide metabolic, functional, and anatomic information and it has the potential to be a powerful tool to study the mechanisms of a variety of diseases.1 PET has high sensitivity yet relatively low resolution and few anatomic details. In contrast, MRI can provide excellent anatomical structures with high resolution and high soft tissue contrast. MR can be used to delineate tumor boundaries and to provide an anatomic reference for PET, thus MR can be used to improve the quantitation in PET. Present design of hybrid MR/PET does not offer measured attenuation correction (AC) using a transmission scan. Thus novel techniques for AC in MR/PET are needed.
In combined PET/CT, a successful example of hybrid imaging systems for clinical applications, CT images are routinely used for attenuation correction. CT-based AC is implemented using a piecewise linear scaling algorithm that translates CT attenuation values into linear attenuation coefficients at 511 keV.2 In standalone PET, a transmission source (either 68Ge or 137Cs) is used for AC. In combined MR/PET, neither CT nor transmission images are available for attenuation correction. As MR signals are not one-to-one related to the electron density information, a direct mapping of attenuation values from MR images is challenging.
Several MR-based attenuation correction methods have been proposed.3, 4, 5, 6, 7, 8, 9, 10, 11, 12, 13, 14, 15, 16, 17 (i) In segmentation-based AC methods,6, 18, 19 MR images are aligned to the preliminary, reconstructed PET data and then segmented into different tissue types with predefined attenuation coefficients. A MR-derived attenuation map is defined and is then forward projected to generate attenuation correction factors (ACFs) to be used for correcting the emission (EM) data. In Martinez-Moller and co-workers' study,11 a segmentation-based AC method was used for body MR images and was validated by CT-based attenuation correction. In another study, the outer contour of the body and the lungs were segmented on T1-weighted MR images for attenuation correction of whole-body PET/MR data.13 A three-region, MR-based whole-body AC approach has also been applied to animal studies for automated PET reconstruction.14 (ii) In a template-based AC method by Kops and Herzog,20 a common attenuation template was created from transmission scans of ten normal volunteers and was then spatially normalized to a standard brain shape. After warping the brain template to an individual's MR image, the same warping matrix was applied to the attenuation template to obtain the AC map for the individual. Similarly, an atlas from CT was warped to individual MR images and then used for attenuation correction.12 (iii) In a pseudo-CT based AC method,21 Hofman et al. used a combination of local pattern recognition and atlas registration for AC that captures global variation of anatomy. The approach predicts pseudo-CT images from a given MR image. These pseudo-CT images were then used for attenuation correction. Beyer et al.3 reported an approach in which MR-based attenuation data were derived from CT data following MR–CT image registration and subsequent histogram matching. After determining the matching pairs of MR and CT image intensities, a corresponding look-up table was generated to map the MR intensities to pseudo-CT values. (iv) In MR sequence-based AC methods, ultrashort echo time (UTE) sequence has been used to improve bone detection on MR images for AC applications.4, 9 When a conventional T1-weighted MR sequence is used, bone tissue has low signal intensity on MR images and hence it is difficult to detect the bone. With the UTE sequences, bone signals are enhanced and used for MR-based AC.
In this study, we focused on segmentation-based AC and emphasized the development of quantification tools including registration, segmentation, and classification for brain MR/PET imaging. One particular contribution includes the quantitative comparison of the MR-based AC and TX-based AC from a high-resolution research tomography (HRRT). To the best of our knowledge, the comparison of PET images between HRRT and combined MR/PET has not been reported. We also integrate image registration, segmentation, classification, and attenuation correction into one software application package. Section 2 describes the details for each step.
MATERIALS AND METHODS
Image acquisitions from 3 T MR and HRRT PET
PET image acquisition from HRRT
Ten human subjects were scanned using a HRRT brain PET system (Siemens Healthcare, Knoxville, TN) and using 11C-labeled Pittsburgh Compound-B ([11C]-PIB). The HRRT uses a collimated single-photon point source of 137Cs to produce high-quality transmission data. Each of the subjects underwent a 6-min transmission scan before the emission scan. A 20-min emission scan was started immediately after the injection of 555 Mq [11C]-PIB. The reconstructed images had a matrix size of 256 × 256 × 207 voxels with a voxel size of 1.2 × 1.2 × 1.2 mm3.
Image acquisition from 3 T MR scanner
The same ten human subjects were scanned on a 3-T clinical MR scanner (Magnetom Trio, A Tim System, Siemens Medical Solutions USA, Inc., Malvern, PA 19355). The T1-weighted rapid gradient echo sequence (MPRAGE) (TR = 2600 ms and TE = 3.0 ms) was used for image acquisition. Sagittal images were acquired with a 1-mm slice thickness and no gaps between slices. The MR volume has 256 × 256 × 176 voxels covering the whole brain and yielding a 1.0 mm isotropic resolution.
Image acquisition from combined MR/PET
Combined MR/PET images were acquired from the Siemens combined MR/PET prototype system. The MR unit is a Siemens 3.0 T Trio, which is a whole-body scanner (60 cm bore) with Sonata gradient set (gradient amplitude of 40 mT/m, maximum slew rate of 200 T/m/s, minimum gradient rise time of 200 μs). The system is actively shielded and is equipped with multiple RF channels and the total imaging matrix (TIM) suite. An eight-channel brain coil was used for the MR image acquisition. The PET system is a dedicated brain tomograph and operates as an insert to the MR bore. The insert comprises 192 lutetium oxyorthosilicate (LSO) detector blocks with 12 × 12 crystal arrays coupled to avalanche photodiodes (ADPs) and arranged in six rings. The crystal dimensions are 2.5 × 2.5 × 20-mm3 and the bore diameter is 35.5 cm with an axial field of view (FOV) of 19.1 cm. The PET insert is unique to this system and represents a substantial increase in PET electronic complexity, including the magnetically insensitive avalanche photodiodes necessary for MR compatibility. The PET scanner has 2.5-mm isotropic resolution throughout the field of view. The PET ring is sized such that an eight-element phased array brain coil can fit inside the PET ring. An elevator-track system allows the PET ring to be installed or removed, so that the Trio can function as a whole-body MR system.
Two human subjects were scanned with both the combined MR/PET and the HRRT PET systems. This was done so that imaging on the MR/PET could be compared with imaging on the HRRT. Each subject was injected with 384.8 Mq [18F]-fluorodeoxyglocuse (FDG), underwent the HRRT scan (6-min transmission scan plus a 20-min emission scan), and then a MR/PET scan. During simultaneous MR/PET imaging, both T1- and T2-weighted MR images were acquired for each subject; at the same time, a 40-min dynamic emission acquisition was performed using the PET insert.
Overview of the MR/PET data processing
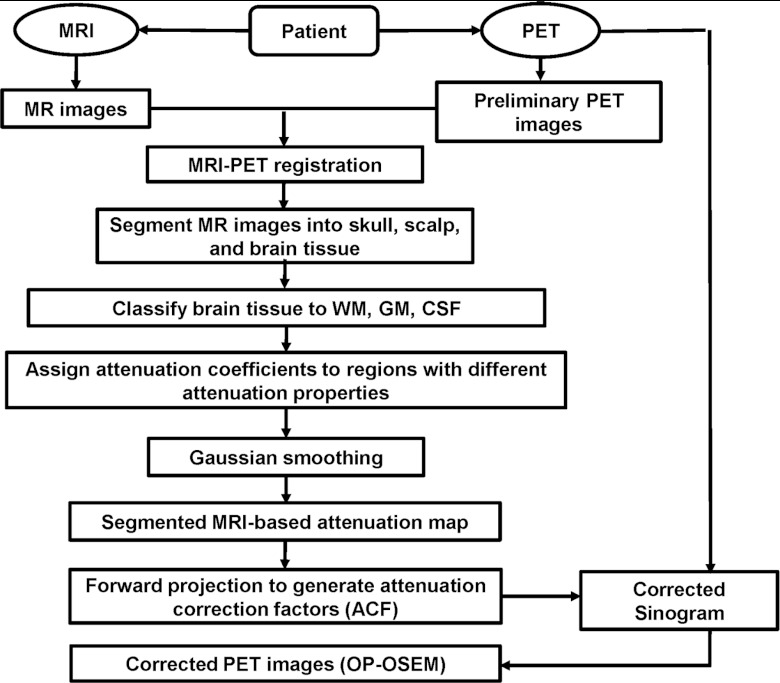
As shown in Fig. 1, our AC method includes several key steps. (1) We first register the MR images with the preliminary reconstruction of PET data using the mutual information-based registration methods developed in our lab.22, 23, 24, 25, 26, 27, 28 (2) The skull tissue is segmented on the MR images using our segmentation method as described below. (3) Brain tissue seen on MR images are classified into gray matter (GM), white matter (WM), and cerebrospinal fluid (CSF). (4) The voxels of different tissue types are assigned theoretical tissue-dependent attenuation coefficients. (5) The MR-derived attenuation map is then forward projected to generate ACFs that are used for correcting the PET emission sinogram data. (6) At the last step, the attenuation corrected PET sinogram is reconstructed to obtain the corrected PET images.
Figure 1.
Schematic diagram of the MR/PET data processing flow.
Segmentation of the skull on MR images
In order to identify bone so that appropriate attenuation coefficients may be assigned, we first perform segmentation of the skull. The segmentation algorithm includes the following steps: (1) The MR image is transformed to the radon domain and the sinogram data are obtained. (2) The MR sinogram data are processed using a bilateral filter to remove noise and to retain the edge information. (3) A multiscale scheme is used to process the MR sinogram data in order to detect the edge of the skull. (4) At different scales, the sinogram data are filtered by a gradient filter to detect the edge of the skull. (5) Once the reciprocal binary sinogram of the skull is obtained, the data are transformed to the image domain to obtain the skull image. These steps are described in detail in the following.
Radon transform
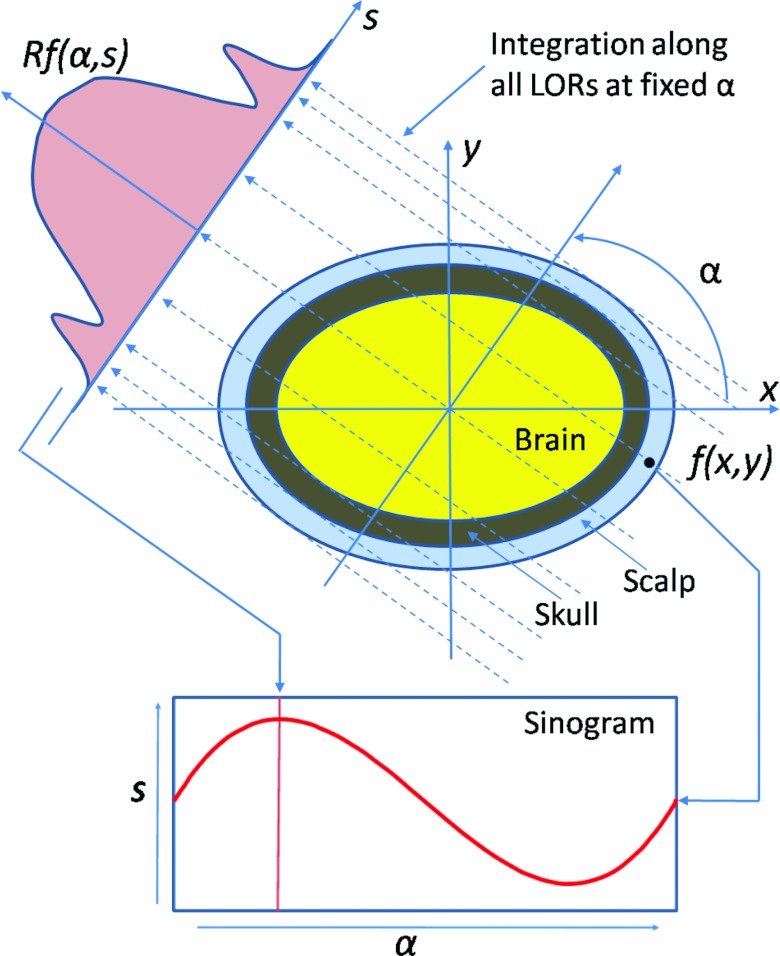
As described in Fig. 2, the Radon transform is defined as a complete set of line integrals Rf(α, s),
| (1) |
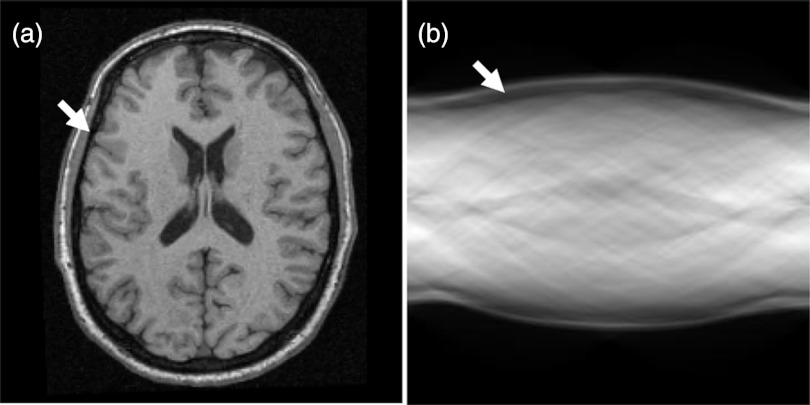
where s is the perpendicular distance of a line from the origin, and α is the angle formed by the distance vector. Because the “skull” has low signals on T1-weighted MR images, the projection image, i.e., “sinogram” has two, local minima on the Rf(α, s) curve (Fig. 2). After the Radon transformation, the MR image is transformed from the image domain to the Radon domain. Figure 3 shows a T1-weighted MR image and its corresponding sinogram.
Figure 2.
Radon transformation of brain MR images.
Figure 3.
T1-weighted MR image (a) and its corresponding sinogram (b). The skull (arrows) has a low signal intensity on both the MR image and the sinogram.
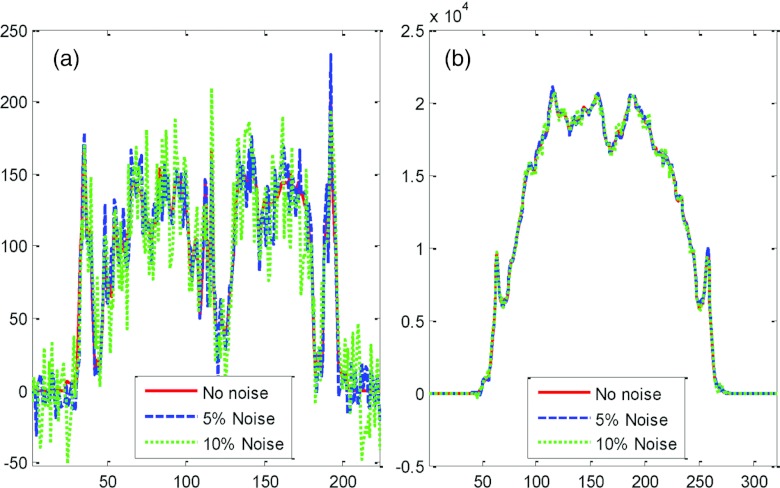
In Fig. 4, we demonstrate noise reduction results from performing a Radon transform. We compare three profiles on the original MR image without adding any noise, and the ones with 5% and 10% noise added to the image. The image with 10% noise was contaminated severely (Fig. 4); however, the noise level was reduced significantly when the Radon transform was applied. This is shown by the profiles of the sinograms (Fig. 4).
Figure 4.
Lines of profile from MR images (a) and from the corresponding sinograms (b). The original MR image (noted as no noise) was added with 5% and 10% noise levels.
Bilateral filtering
Bilateral filtering, a nonlinear filtering technique,29 is a weighted average of local neighborhood samples, where the weights are computed based on the temporal (or spatial in the case of images) and radiometric distances between a center sample and its neighboring samples. Bilateral filtering can be described as follows:
| (2) |
with the normalization
| (3) |
where I(x) and h(x) denote the input and output images, respectively. s(ξ − X) measures the geometric closeness between the neighborhood center X and a nearby point ξ; and r(I(ξ) − I(X)) measures the photometric similarity between the pixel at the neighborhood center X and that of a nearby point ξ. Various kernels can be used in bilateral filtering. An important case of bilateral filtering is shift-invariant Gaussian filtering.
Multiscale bilateral decomposition
The multiscale bilateral decomposition technique smoothes the images as the scale increases.30 For an input image I, the goal of the multiscale bilateral decomposition is to first build a series of filtered images Ii that preserve the strongest edges in the image I while smoothing small changes in intensity. At the finest scale (i = 0), we set I0 = I. Images at different scales can be computed by iteratively applying the bilateral filter as shown below
| (4) |
with
| (5) |
where p is a pixel coordinate; sσ(d) = exp (−d2/σ2); and and are the widths of the spatial and range Gaussians at the scale i, respectively; and q is an offset relative to p that runs across the support of the spatial Gaussian, i.e., Ω. The repeated convolution by increases the spatial smoothing at each scale i. In the finest scale, the spatial kernel is set as . In other scales, , where i > 1. The range Gaussian is an edge-stopping function. The parameter is defined as . By increasing the width of the range Gaussian by a factor of 2 at every scale, a noisy edge from a previous iteration can be smoothed in the later iterations.
Gradient filtering and multiscale reconstruction
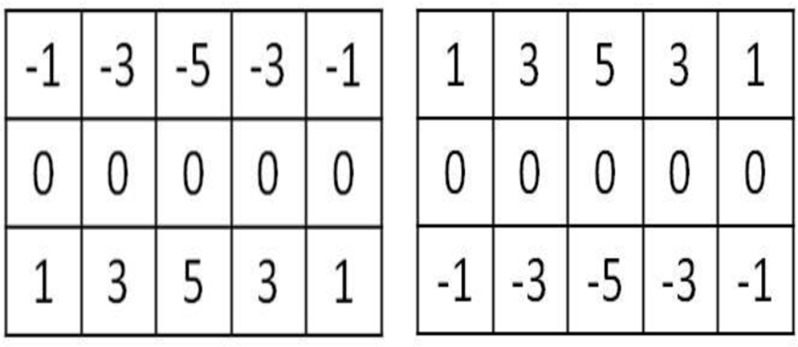
Images at difference scales are filtered along the vertical direction using two sets of filters. Figure 5 shows the kernels of the filters, which are mirrored along the vertical direction. After applying the two filters to the image, we use the upper half of the first filtered image and the lower half of the second filtered image. In the coarsest scale, the images are much smoothed and only show main edges. At the two coarsest scales, we use a region growing method to obtain a mask. Results from coarse scales provide a mask for the next fine scale and supervise the segmentation in the next fine scale. After obtaining the reciprocal binary sinogram that includes only the skull, we perform reconstruction to obtain the skull image. To eliminate artifacts introduced by reconstruction, we use a predetermined threshold to obtain the skull image.
Figure 5.
Kernels of the two filters. Each is mirrored along the vertical direction.
Classification of tissue types on MR images
Brain tissue is classified into three types: GM, WM, CSF. We first use a diffusion filter to process MR images and to construct a multiscale image series. Classification is applied along the scales from the coarse to the fine levels. The objective function of the conventional, fuzzy C-means (FCM) method is modified to allow multiscale classification processing in which the result from a coarse scale supervises the classification in the next finer scale.
Anisotropic diffusion filtering
Due to partial volume effect, MR images often have blurred object edges. Linear low-pass filtering gives poor results as it can blur the edges and remove the details. Anisotropic diffusion filtering can overcome this drawback by introducing a partial edge detection step into the filtering process to encourage intra-region smoothing and inter-region edge preservation. Anisotropic diffusion filtering, introduced by Perona and Malik,31 is a partial differential diffusion equation model described as
| (6) |
where I(X, t) stands for the intensity at the position X and the scale level t; ∇ and div are the spatial gradient and the divergence operator. c(IX, t) is the diffusion coefficient and is chosen locally as a function of the magnitude of the image intensity gradient;
| (7) |
The constant ω is referred to as the diffusion constant and determines the filtering behavior. In this diffusion model, maximal flow presents where the gradient strength is equal to the diffusion constant (∇I ≈ ω); the flow rapidly decreases to zero when the gradient is close to zero or much greater than ω, which implies that the diffusion process maintains a homogeneous region where ∇I ≪ ω and preserves edges where ∇I ≫ ω. To reduce noise in the image, ω is chosen as the gradient magnitude produced by noise and is generally fixed manually or estimated using the noise estimator described in Ref. 32.
Multiscale fuzzy C-means (MsFCM) algorithm
A multiscale approach can improve the speed of a classification algorithm and can avoid being trapped into local solutions. In our classification scheme, the multiscale description of images is generated by the anisotropic diffusion filter that iteratively smoothes the images as the scale t increases. General information is extracted and maintained in large-scale images, and low-scale images have more local tissue information. t is the scale level, and the original image is at level 0. When the scale increases, the images become more blurred and contain less detailed information. Unlike many multiresolution techniques in which the images are down-sampled along the resolution, we keep the image resolution along the scales. We perform classification from the coarsest to the finest scale, i.e., the original image. The classification result at a coarser level, t + 1, is used to initialize the classification at a higher scale level t. During the classification processing at the level t + 1, the pixels with the highest membership above a threshold are identified and assigned to the corresponding class. These pixels are labeled as training data for the next level t.
The objective function of the MsFCM at the level t is
| (8) |
where uik stands for the degree of membership of the pixel i belonging to the class k, and c is the total numbers of classes. N is the total number of voxels for classification. The parameter ɛ is a weighting exponent on each fuzzy membership and is set as 2. I(i) represents the intensity of the MR image at the pixel i, and vk is the mean intensity of the class k. For d-dimensional data, vk is the d-dimension center of the class. ‖*‖ is the norm expressing the similarity between measured data and the center. NR stands for the neighboring pixels of the pixel i. The objective function is the sum of three terms where α and β are scaling factors that define the effect of each factor term. The first term is the objective function used by the conventional FCM method, and which assigns a high membership to the pixel whose intensity is close to the center of the class. The second term allows the membership in neighborhood pixels to regulate the classification towards piecewise-homogeneous labeling. The third term is to incorporate the supervision information from the classification of the previous scale. is the membership obtained from the classification in the previous scale. is determined as
| (9) |
where κ is the threshold to determine the pixels with a known class in the next scale classification and is set as 0.85 in our implementation. The classification is implemented by minimizing the objective function J. The minimization of J occurs when the first derivative of J with respect to uik and vk are zero.
Attenuation coefficients and PET reconstruction
Once the MR images are classified into different tissue types using our MsFCM technique, the attenuation coefficients of different types of tissue are selected according to the report by Zaidi and co-workers,18 e.g., air = 0.0, scalp = 0.1022, skull = 0.143, GM and WM = 0.0993, CSF = 0.0952, and nasal sinuses = 0.0536 (cm−1). Although the gray and white matter can be considered as one type of tissue for the purpose of attenuation correction, our classification and quantification tools differentiate these two types of tissue in order to perform further quantitative analysis such as volumetric measurement of the gray matter. We assign attenuation coefficients to the classified tissue followed by 4 × 4 × 4 Gaussian smoothing. The MR-derived attenuation map is then forward projected to generate AC factors to be used for correcting the PET emission data at appropriate angles of the resulting attenuation map. Finally, the original PET sinogram and attenuation map are combined to generate the correction PET sinogram. In our AC method, we use a three-dimensional, ordinary Poisson ordered subset expectation maximization (OP-OSEM) method.33 The OSEM method uses a subset of 16 and an iteration number of 6.
Evaluation methods
Segmentation evaluation
To evaluate the performance of the segmentation method, the difference between the segmented images and the ground truth was computed.34 We examined the segmentation results from pairs of CT and T1-weighted MR data obtained from the Vanderbilt Retrospective Registration Evaluation Dataset.35 These CT and MR volume images were acquired preoperatively from human subjects. Each of the CT volumes contained at least 40 transverse slices with 512*512 pixels for each slice. The voxel size was 0.4 × 0.4 × 3.0 mm3. The corresponding MR image volume contained 128 coronal slices with 256*256 pixels for each slice. The voxel size was 1.0 × 1.0 × 1.6 mm3. We registered the CT to the corresponding MR images using the registration methods22, 23, 24, 25, 26, 27, 28 that have been evaluated in our laboratory. On the CT images, we used a threshold method to obtain the skull and the results provide the ground truth of the skull for the evaluation of the MR image segmentation.
Classification evaluation
Our classification method has been previously evaluated with synthetic images and the McGill brain MR database.36 We used overlap ratios between the classified results and the ground truth for classification evaluation. For synthesized images, the ground truth was known. For brain MR image data, the true tissue classification maps were obtained by assigning each pixel to the class to which the pixel most probably belongs. We used the Dice similarity measurement (DSM) (Refs. 37, 38, 39) to compute the overlap ratios. The DSM for each tissue type is computed as a relative index of the overlap between the classification result and the ground truth. It is defined as
| (10) |
where Ac and Bc are the numbers of the pixels classified as Class c using our classification method and the ground truth, respectively; (A∩B)c is the number of pixels classified as Class c in both results. This metric attains a value of one if the classified results are in full agreement with the ground truth and is zero when there is no agreement.
Evaluation of MR-based attenuation correction
Our MR-based AC was validated by comparison with the transmission-based AC method. HRRT PET and MR images were acquired from each of the ten human subjects. From the HRRT PET system, transmission images were also acquired from each subject. The PET image volume of each subject was aligned to an anatomically standardized stereotactic template using our registration methods.40, 41, 42 The corrected PET images with MR-based AC were compared to those with TX-based AC. The quality of the corrected PET images was first assessed by visual inspection and then followed by quantitative evaluation of the PET signals in the clinical volumes of interest (VOIs) in the brain.
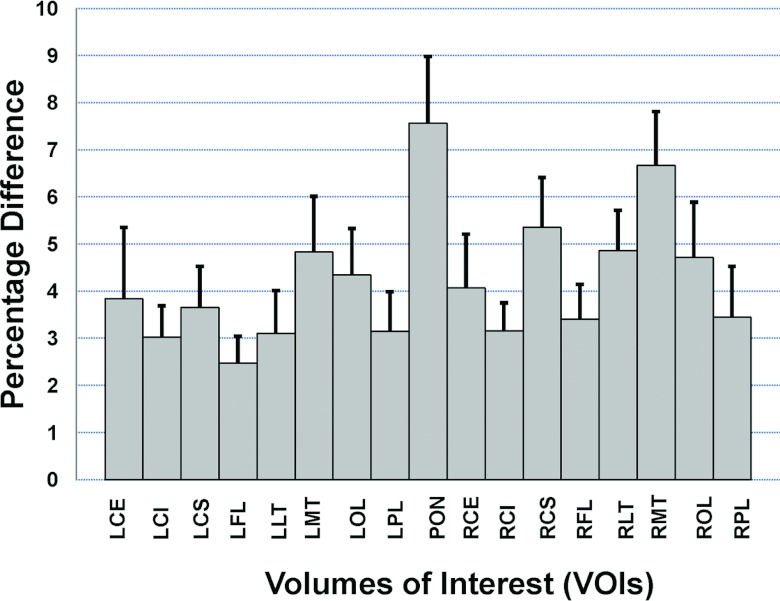
Seventeen VOIs were defined on different slices of the MR template and were superimposed on each subject's images, resulting in a total of 170 VOIs for the 10 subjects. The registered PET images were then used for quantitative analysis using the defined VOIs. The VOIs in the brain include the left cerebellum (LCE), left cingulate (LCI), left calcarine sulcus (LCS), left frontal lobe (LFL), left lateral temporal (LLT), left mesial temporal (LMT), left occipital lobe (LOL), left parietal lobe (LPL), Pons (PON), right cerebellum (RCE), right cingulate (RCI), right calcarine sulcus (RCS), right frontal lobe (RFL), right lateral temporal (RLT), right medial temporal (RMT), right occipital lobe (ROL), and the right parietal lobe (RPL). The left and right medial temporal (LMT and RMT) region included the amygdale, hippocampus, and the entorhinal cortex.
The relative difference of the PET signals at each VOI between MR-based and TX-based AC was calculated using the following equation:
| (11) |
We also used mean squared error (MSE) and peak signal-to-noise ratio (PSNR) to evaluate the image quality before and after AC. MSE is defined as the average squared difference between a reference image and a distorted image. It is computed pixel-by-pixel by adding up the squared differences of all the pixels and dividing by the total pixel count. For images A = {a1 … aM} and B = {b1 … bM}, where M is the number of pixels
| (12) |
The PSNR is defined as the ratio between the reference signal and the distortion signal in an image, given in decibels. The higher the PSNR, the closer the distorted image is to the original. In general, a higher PSNR value should correlate to a higher quality image. For images A = {a1 … aM}, B = {b1 … bM}, and MAX equal to the maximum possible pixel value
| (13) |
RESULTS
Segmentation results
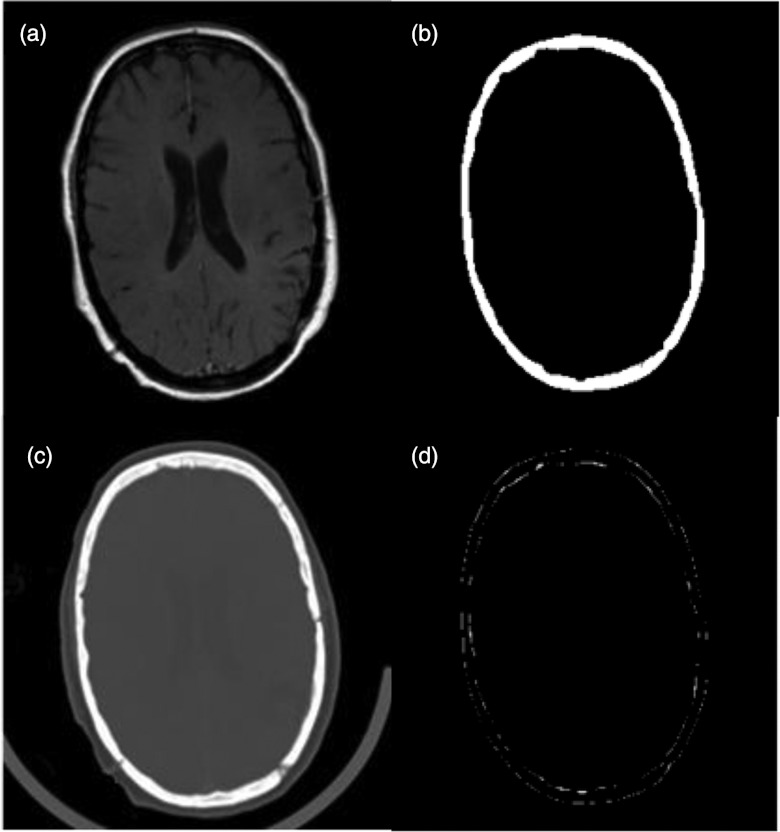
Figure 6 shows an example of skull MR image segmentation and comparison with the result from the CT images. The subtraction image between MR-based and CT-based segmentation shows the minimal difference in the region of the skull. The average overlapping ratios between the segmented skull from the MR and the CT images was 85.2 ± 2.6% for the eight image pairs from the Vanderbilt Database.
Figure 6.
Comparison of skull segmentation from MR (a) and CT (c) of the same human subject. The skull was segmented from MR (b). The difference between MR and CT segmentation is small (d).
Attenuation correction results of subject MR and PET images from HRRT scanner
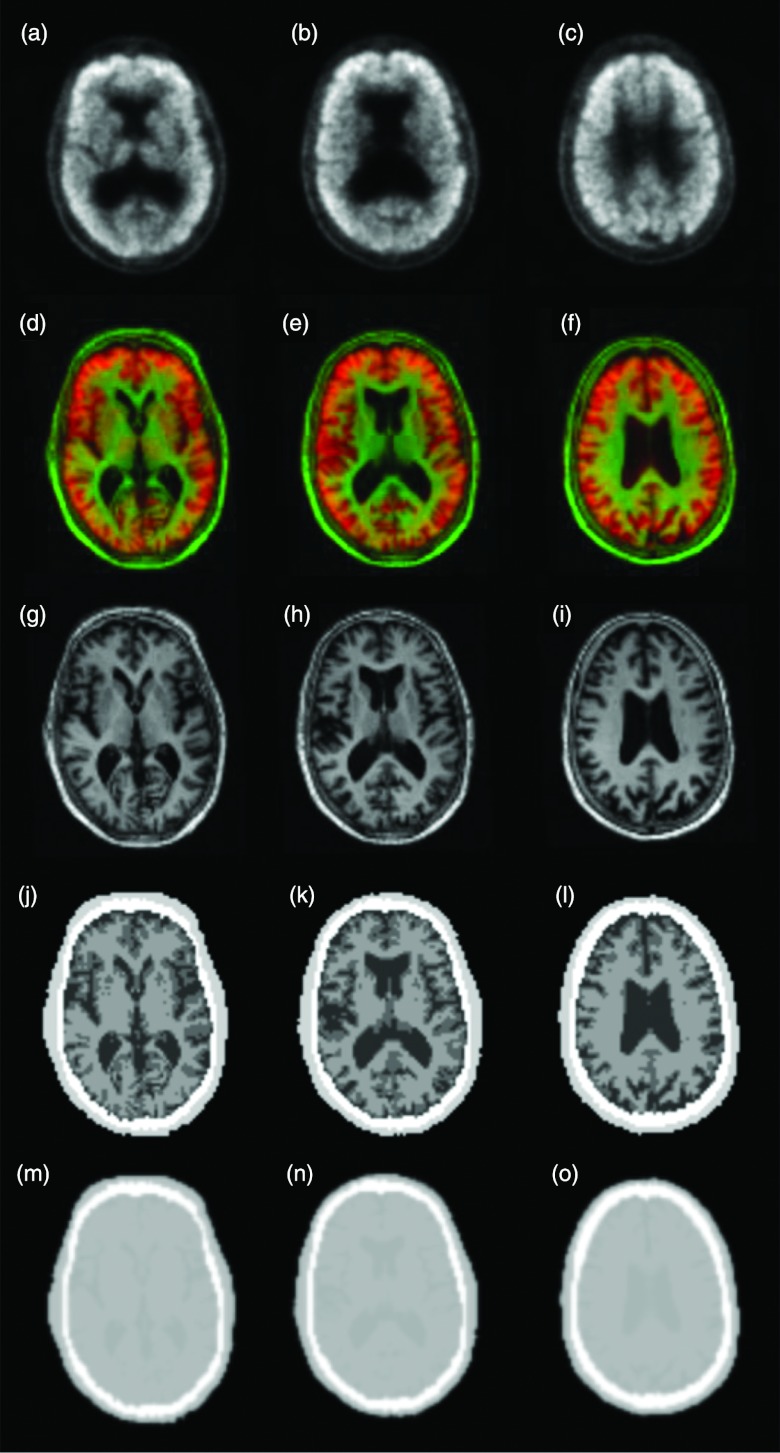
Figure 7 shows the processed PET and MR images in the MR-based AC. After the MR images were registered to the preliminary PET images, the skull was segmented and the brain tissue was classified into GM, WM, and CSF. Before the classification method was applied to the subject data, it was evaluated using synthetic images and the McGill brain MR database. The overlap ratios between the classified results and ground truth were over 90%. After the skull segmentation and tissue classification, different AC coefficients were assigned to different types of tissue in order to generate an AC map.
Figure 7.
Data flow for the generation of attenuation correction maps. The PET images (a)–(c) were first registered and fused (d)–(f) with the corresponding MR images (g)–(i) that were segmented and classified into different tissue types (j)–(l) to generate attenuation correction maps (m)–(o).
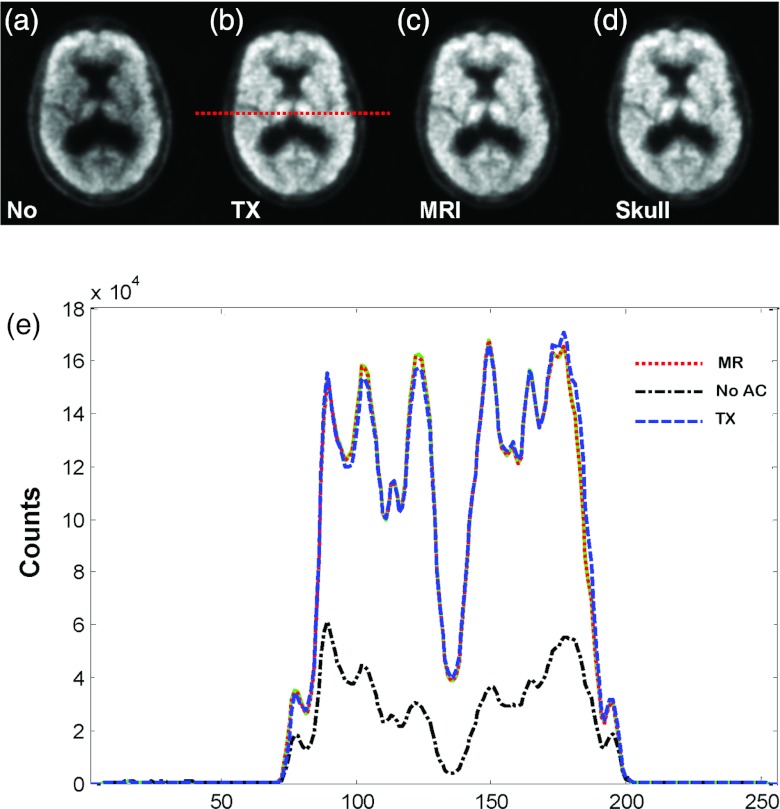
As shown in Fig. 8c, our MR-based AC achieved similar results as compared to the currently used standard approach, i.e., the TX-based correction [Fig. 8b]. There was no visible difference between the skull-based [Fig. 8d] and MR-based corrections [Fig. 8c]. The profiles demonstrate the closeness of the three AC methods. However, without AC, the center of the brain has low signals [Figs. 8a, 8e] that must be corrected before quantitative analysis.
Figure 8.
Comparison of PET images without attenuation correction (a), with transmission (TX)-based (b), and MR-based (c) attenuation correction. Image (d) is obtained using the skull-based correction method. (Bottom) Lines of profiles on PET images.
We calculated and analyzed the relative difference between the MR-based and TX-based correction methods. The average relative differences of the 10 subjects is less than 7.6% (min/max: 3.0%/7.6%) for each of the 17 VOIs (Fig. 9). Among the 170 VOIs that were analyzed for the 10 subjects, only 5.3% (9/170) of them had a relative difference of more than 10% (min/max: 10.2%/16.4%). If we average the relative differences of the 17 VOIs of an individual subject, the mean relative difference is less than 7.5% (min/max: 2.4%/7.4%) for each of the 10 subjects. When averaging the relative difference of the 10 subjects and the 17 VOIs, the average relative difference is 4.2% between the MR-based and TX-based correction methods.
Figure 9.
Comparison between MR-based and transmission (TX)-based attenuation correction methods. Uptake signals at 17 VOIs were quantified for each subject's PET images. The percentage of difference between the two methods was calculated. Means and standard errors were calculated using data of ten subjects.
For the ten subjects, we used the TX-based AC as the reference to evaluate the PSNR of the PET images with MR-based AC. The mean and standard deviation of the PSNR are 44.5 ± 6.9.
Phantom results obtained on the combined MR/PET
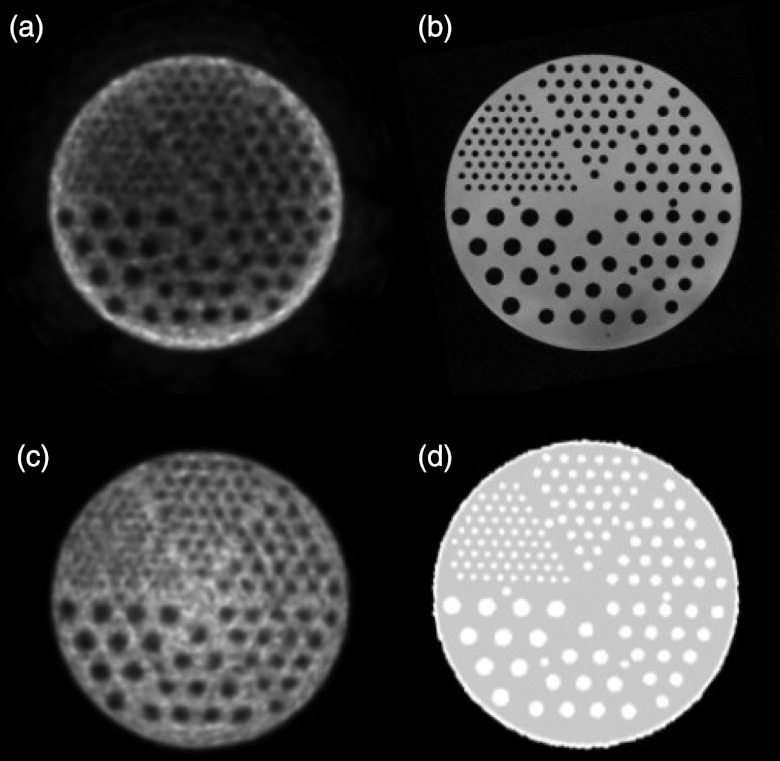
Figure 10 shows sample images of a Flanged Jaszczak ECT phantom; these images were acquired on the combined MR/PET. The phantom was filled with 6.8 l water and then with 84.4 MBq F18-fluorodeoxyglocuse (FDG). Assessment of how well the cold rods within the phantom were reconstructed provides information on the characteristics of imaging on MR/PET. The PET signals should be homogeneous within the phantom; however, the signals at the center of the phantom are lower than those in the peripheral region when there is no attenuation correction. The MR image of the same phantom provides the structural image. The phantom MR image was then segmented into two different materials, i.e., water and plastic. After an attenuation coefficient was assigned to each material (water = 0.096 cm−1 and plastic = 0.183 cm−1), the AC map was generated and then used in the PET reconstruction. The signals on the central region were corrected on the PET image.
Figure 10.
PET (a) and MR (b) images of a phantom acquired using the combined MR/PET scanner. The segmented MR image was used to generate the attenuation correction map (d) in order to obtain the corrected PET image (c).
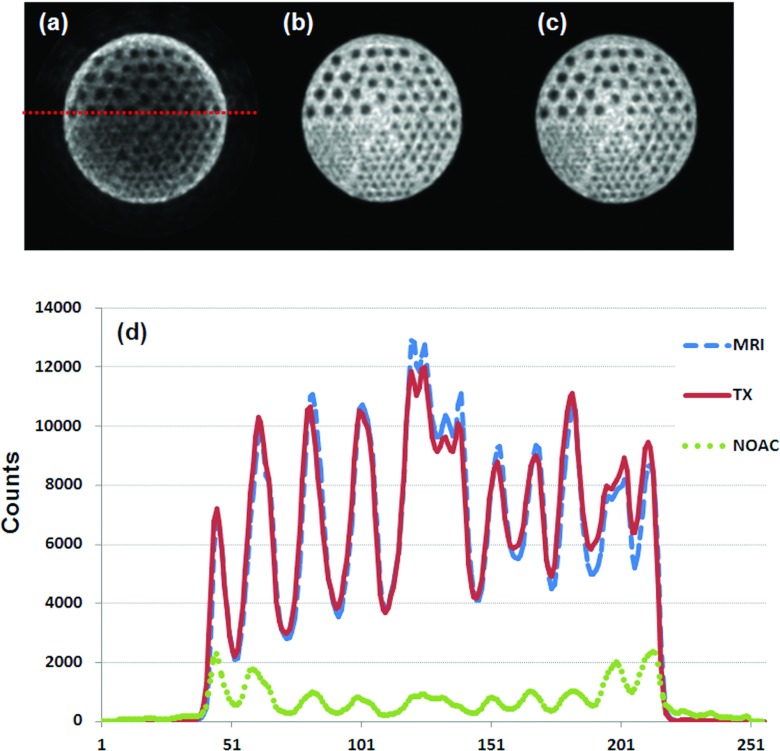
Figure 11 shows comparison of the MR-based and TX-based AC. The difference between the two AC correction approaches is not visible on the corrected PET images. The profiles from the two methods are close [Fig. 11d]. Again, the quality of the PET image is not acceptable for quantification if there is no attenuation correction.
Figure 11.
Comparison of PET images without attenuation correction (a), with transmission (TX)-based correction (b), and with MR-based correction (c). Profiles (d) show little difference between the TX- and MR-based methods.
To assess the image quality after AC, PET images generated using TX-based AC are used as the reference, the PSNR were 53.4 and 3.3 for the images generated using MR-based AC and those without AC, respectively; indicating the improvement of the image quality after MR-based attenuation correction.
Estimation of MR coil attenuation in combined MR/PET
Simultaneous PET/MR acquisition uses a transmit/receive coil that fits concentrically within the PET insert. The coil is transparent in MR but is within the PET FOV and occupies space between the subject and the PET detectors. For accurate reconstructions, the coil attenuation properties need to be estimated and incorporated into the reconstructions. We estimated the coil position within the BrainPET FOV and provided an estimate of the coil AC factors.
Ten Na-22 point sources were taped in various positions on the transmit/receive coil. PET scans of the coil were collected on three scanners, i.e., BrainPET, GE DST, and Siemens HRRT. Transmission scans were also collected, including CT, Ge-68 rod source data on the GE DST, and Cs-137 point source data on the HRRT. The emission data from the DST and HRRT were co-registered with the BrainPET emission data. The transformation matrices created from these registrations where used to transform respective scanner transmission attenuation coefficient maps (μ-maps) to the brain PET space. The CT data were scaled to 511 keV attenuation values using a bilinear function; the values of the Cs-137 μ-maps were increased by 11% to match the 511 keV attenuation values. The μ-map images were compared by smoothing the μ-map images to the DST resolution and creating joint histograms using the DST 511 keV μ-map as the standard.
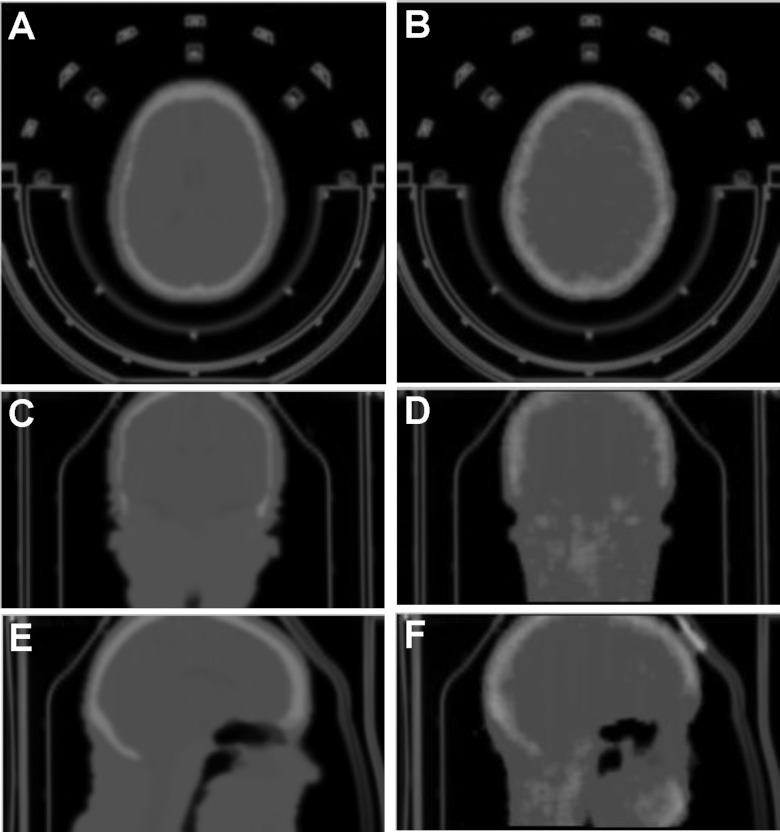
The 511 keV and CT μ-maps showed a strong correlation between their attenuation values with the CT values slightly overestimating the 511 keV values by a factor of 1.14. The CT provides a good estimate of the brain PET coil attenuation properties after minor adjustment to match the 511 keV μ-map. Figure 12 shows example AC maps that took the coil attenuation into consideration. The MR-based AC map shows more details within the brain, e.g., the CSF, than the TX-based map. Overall, the difference between the MR-based and TX-based maps was minimal.
Figure 12.
Comparison of the attenuation correction maps between the MR-based (left) and transmission (TX)-based (right) methods. The AC map takes the coil and bed into consideration.
Patient results from combined MR/PET
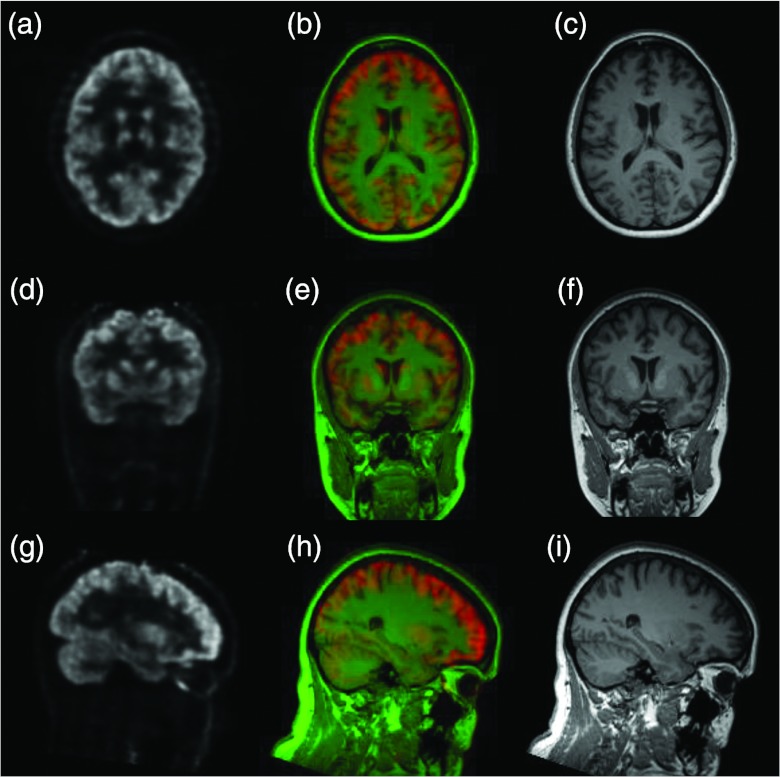
From the combined MR/PET scanner, both PET and MR images were simultaneously acquired from human subjects. The fusion of the PET and MR images combines both functional and anatomic information regarding the brain (Fig. 13). Furthermore, the combined information was captured simultaneously from the brain and thus allows correlation analysis not only in space but also in time. However, attenuation correction is needed for the PET images before quantitative analysis of brain function. As the combined MR/PET system does not provide transmission or CT images for attenuation correction, MR images are used for this AC purpose. To evaluate the MR-based AC method, the same subjects were scanned on the HRRT. It provides transmission images for attenuation correction.
Figure 13.
PET [left: (a)/(d)/(g)] and MR [right: (c)/(f)/(i)] images of a human subject, obtained on the combined MR/PET system. The fused images [middle: (b)/(e)/(h)] show both functional and anatomic information of the brain.
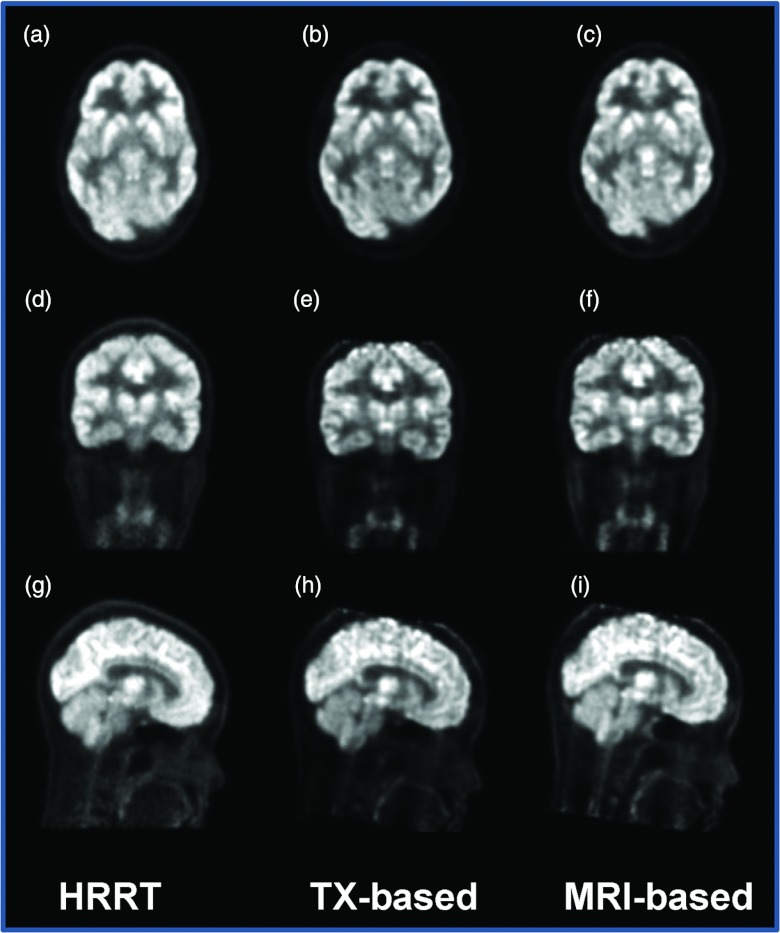
Comparison between the MR-based and TX-based AC methods is shown on the corrected PET images (Fig. 14). The PET image from the combined MR/PET is visually close to that from the HRRT PET. Figure 15 allows comparison among the PET images from the HRRT with TX-based AC, from the MR/PET scanner with TX-based AC, and from MR/PET with MR-based AC.
Figure 14.

Comparison of PET images from MR/PET without attenuation correction (a), with transmission (TX)-based correction (b), and with MR-based correction (c), and the PET image from the HRRT with AC (d) of the same subject.
Figure 15.
Comparison of PET images from HRRT with AC [left: (a)/(d)/(g)], from MR/PET with transmission (TX)-based AC [middle: (b)/(e)/(h)], and from MR/PET with MR-based AC [right: (c)/(f)/(i)].
DISCUSSION
Combined MR/PET is a new imaging modality. Accurate attenuation correction represents an essential component for the reconstruction of quantitative PET images. The present design of combined MR/PET does not offer measured attenuation correction using a transmission scan. We developed quantification tools including MR-based AC for potential use in combined MR/PET for brain imaging.
Our quantification tools include image registration, classification, and attenuation correction. We have integrated all the components into one software package. In this scheme, MR images are first registered with the preliminary reconstruction of PET data, and are then segmented and classified into different tissue types. The voxels of classified tissue types are assigned theoretical tissue-dependent attenuation coefficients to generate AC factors. Corrected PET emission data are then reconstructed to obtain the corrected PET images.
The skull segmentation algorithm is an important step required for the MR-based AC because bone tissue has a significant effect on attenuation. In the segmentation algorithm, the Radon transformation of the MR images into the sinogram domain is a key step for the detection of bone edges and for the reduction of noise. Without Radon transformation, it can be difficult to directly segment the skull on the original MR images. The evaluation of the skull segmentation demonstrates satisfactory results.
The classification method can classify the brain tissue into gray matter, white matter and CSF. The classification method can be used not only for AC but also for the quantification of tissue volumes such as measuring the volume of gray matter. As the difference of the attenuation coefficients between gray matter and white matter is small, they could be considered as one tissue type during AC.
This study focused on the technical development and feasibility evaluation of the MR-based quantification tools. The MR-based AC has been evaluated in phantoms, in two subjects who had combined MR/PET scans, and in ten subjects who had separate brain MR and PET scans. Application of the MR-based AC method to body imaging as opposed to brain imaging should be possible. That said, however, significant additional research and development efforts will likely be required to refine and confirm such as AC of chest and abdomen is more difficult if for no other reason than organ motion is present in both. A large field of view of MR imaging may be required in order to cover the body before the MR image can be used for AC. When some part of the tissue is missing on MR images, software correction may be required in order to compensate for the missing data before the MR images could be used for attenuation correction.43 To demonstrate the clinical utilization of the quantification tools, more studies are needed in order to show particular clinical applications in the future.
CONCLUSION
We developed and evaluated quantitative tools that include image registration, segmentation, classification, and MR-based AC for potential use in combined MR/PET. MR-based AC was compared with transmission-based AC using high-resolution HRRT PET. The MR-based AC compared favorably with conventional transmission-based AC. The quantification tools that have been integrated into one software package have various potential applications for quantitative neuroimaging.
ACKNOWLEDGMENTS
This research was supported in part by National Institutes of Health (NIH) Grant No. R01CA156775 (PI: Fei), The Georgia Cancer Coalition Distinguished Clinicians and Scientists Award (PI: Fei), The Emory Molecular and Translational Imaging Center (NIH P50CA128301), SPORE in Head and Neck Cancer (NIH P50CA128613), and The Atlanta Clinical and Translational Science Institute (ACTSI) that is supported by Public Health Service (PHS) Grant No. UL1 RR025008 from the Clinical and Translational Science Award program. The authors thank Larry Byars, Matthias Schmand, and Christian Michel from Siemens Healthcare for the technical support of the combined MR/PET system. The content is solely the responsibility of the authors and does not necessarily represent the official views of the National Cancer Institute or the National Institutes of Health.
References
- Sauter A. W., Wehrl H. F., Kolb A., Judenhofer M. S., and Pichler B. J., “Combined PET/MRI: One step further in multimodality imaging,” Trends Mol. Med. 16, 508–515 (2010). 10.1016/j.molmed.2010.08.003 [DOI] [PubMed] [Google Scholar]
- Zaidi H., Montandon M. L., and Alavi A., “Advances in attenuation correction techniques in PET,” J. PET Clin. 2, 191–217 (2007). 10.1016/j.cpet.2007.12.002 [DOI] [PubMed] [Google Scholar]
- Beyer T., Weigert M., Quick H. H., Pietrzyk U., Vogt F., Palm C., Antoch G., Muller S. P., and Bockisch A., “MR-based attenuation correction for torso-PET/MR imaging: Pitfalls in mapping MR to CT data,” Eur. J. Nucl. Med. Mol. Imaging 35, 1142–1146 (2008). 10.1007/s00259-008-0734-0 [DOI] [PubMed] [Google Scholar]
- Catana C., van der K. A., Benner T., Michel C. J., Hamm M., Fenchel M., Fischl B., Rosen B., Schmand M., and Sorensen A. G., “Toward implementing an MRI-based PET attenuation-correction method for neurologic studies on the MR-PET brain prototype,” J. Nucl. Med. 51, 1431–1438 (2010). 10.2967/jnumed.109.069112 [DOI] [PMC free article] [PubMed] [Google Scholar]
- Delso G., Martinez-Moller A., Bundschuh R. A., Ladebeck R., Candidus Y., Faul D., and Ziegler S. I., “Evaluation of the attenuation properties of MR equipment for its use in a whole-body PET/MR scanner,” Phys. Med. Biol. 55, 4361–4374 (2010). 10.1088/0031-9155/55/15/011 [DOI] [PubMed] [Google Scholar]
- Fei B., Yang X., and Wang H., “An MRI-based attenuation correction method for combined PET/MRI applications,” Proc. SPIE 7262, 726208 (2009). 10.1117/12.813755 [DOI] [PMC free article] [PubMed] [Google Scholar]
- Hofmann M., Bezrukov I., Mantlik F., Aschoff P., Steinke F., Beyer T., Pichler B. J., and Scholkopf B., “MRI-based attenuation correction for whole-body PET/MRI: Quantitative evaluation of segmentation- and atlas-based methods,” J. Nucl. Med. 52, 1392–1399 (2011). 10.2967/jnumed.110.078949 [DOI] [PubMed] [Google Scholar]
- Hu Z., Ojha N., Renisch S., Schulz V., Torres I., Buhl A., Pal D., Muswick G., Penatzer J., Guo T., Bonert P., Tung C., Kaste J., Morich M., Havens T., Maniawski P., Schafer W., Gunther R. W., Krombach G. A., and Shao L., “MR-based attenuation correction for a whole-body sequential PET/MR system,” in Proceedings of the IEEE Nuclear Science Symposium Conference (Orlando, FL, 2009), pp. 3508–3512. 10.1109/NSSMIC.2009.5401802 [DOI]
- Keereman V., Fierens Y., Broux T., De Deene Y., Lonneux M., and Vandenberghe S., “MRI-based attenuation correction for PET/MRI using ultrashort echo time sequences,” J. Nucl. Med. 51, 812–818 (2010). 10.2967/jnumed.109.065425 [DOI] [PubMed] [Google Scholar]
- Malone I. B., Ansorge R. E., Williams G. B., Nestor P. J., Carpenter T. A., and Fryer T. D., “Attenuation correction methods suitable for brain imaging with a PET/MRI scanner: A comparison of tissue atlas and template attenuation map approaches,” J. Nucl. Med. 52, 1142–1149 (2011). 10.2967/jnumed.110.085076 [DOI] [PubMed] [Google Scholar]
- Martinez-Möller A., Souvatzoglou M., Delso G., Bundschuh R. A., Chefd'hotel C., Ziegler S. I., Navab N., Schwaiger M., and Nekolla S. G., “Tissue classification as a potential approach for attenuation correction in whole-body PET/MRI: Evaluation with PET/CT data,” J. Nucl. Med. 50, 520–526 (2009). 10.2967/jnumed.108.054726 [DOI] [PubMed] [Google Scholar]
- Schreibmann E., Nye J. A., Schuster D. M., Martin D. R., Votaw J., and Fox T., “MR-based attenuation correction for hybrid PET-MR brain imaging systems using deformable image registration,” Med. Phys. 37, 2101–2109 (2010). 10.1118/1.3377774 [DOI] [PubMed] [Google Scholar]
- Schulz V., Torres-Espallardo I., Renisch S., Hu Z., Ojha N., Bornert P., Perkuhn M., Niendorf T., Schafer W. M., Brockmann H., Krohn T., Buhl A., Gunther R. W., Mottaghy F. M., and Krombach G. A., “Automatic, three-segment, MR-based attenuation correction for whole-body PET/MR data,” Eur. J. Nucl. Med. Mol. Imaging 38, 138–152 (2011). 10.1007/s00259-010-1603-1 [DOI] [PubMed] [Google Scholar]
- Steinberg J., Jia G., Sammet S., Zhang J., Hall N., and Knopp M. V., “Three-region MRI-based whole-body attenuation correction for automated PET reconstruction,” Nucl. Med. Biol. 37, 227–235 (2010). 10.1016/j.nucmedbio.2009.11.002 [DOI] [PubMed] [Google Scholar]
- Tellmann L., Quick H. H., Bockisch A., Herzog H., and Beyer T., “The effect of MR surface coils on PET quantification in whole-body PET/MR: Results from a pseudo-PET/MR phantom study,” Med. Phys. 38, 2795–2805 (2011). 10.1118/1.3582699 [DOI] [PubMed] [Google Scholar]
- Wagenknecht G., Kops E. R., Tellmann L., and Herzog H., “Knowledge-based segmentation of attenuation-relevant regions of the head in T1-weighted MR images for attenuation correction in MR/PET systems,” in 2009 IEEE Nuclear Science Symposium Conference Record, Vols. 1–5, edited by Yu B. (IEEE, Orlando, FL, 2009), pp. 3338–3343.
- Zhang B., Pal D., Hu Z. Q., Ojha N., Guo T. R., Muswick G., Tung C. H., and Kaste J., “Attenuation correction for MR table and coils for a sequential PET/MR system,” in Proceedings of the IEEE Nuclear Science Symposium Conference 2009 (IEEE, Orlando, FL, 2009), pp. 3303–3306.
- Zaidi H., Montandon M. L., and Slosman D. O., “Magnetic resonance imaging-guided attenuation and scatter corrections in three-dimensional brain positron emission tomography,” Med. Phys. 30, 937–948 (2003). 10.1118/1.1569270 [DOI] [PubMed] [Google Scholar]
- Fei B., Yang X., Nye J., Jones M., Aarsvold J., Raghunath N., Meltzer C., and Voltaw J., “MRI-based attenuation correction and quantification tools for combined MRI/PET,” J. Nucl. Med. 51, 81 (2010). [Google Scholar]
- Kops E. and Herzog H., “Alternative methods for attenuation correction for PET images in MR-PET scanners,” in Proceedings of the IEEE Nuclear Science Symposium Conference (Honolulu, HI, 2007), pp. 4327–4330. 10.1109/NSSMIC.2007.4437073 [DOI]
- Hofmann M., Steinke F., Scheel V., Charpiat G., Farquhar J., Aschoff P., Brady M., Scholkopf B., and Pichler B. J., “MRI-based attenuation correction for PET/MRI: A novel approach combining pattern recognition and atlas registration,” J. Nucl. Med. 49, 1875–1883 (2008). 10.2967/jnumed.107.049353 [DOI] [PubMed] [Google Scholar]
- Fei B., Wheaton A., Lee Z., Duerk J. L., and Wilson D. L., “Automatic MR volume registration and its evaluation for the pelvis and prostate,” Phys. Med. Biol. 47, 823–838 (2002). 10.1088/0031-9155/47/5/309 [DOI] [PubMed] [Google Scholar]
- Fei B., Lee Z., Boll D., Duerk J., Lewin J., Wilson D., Ellis R., and Peters T., “Image registration and fusion for interventional MRI guided thermal ablation of the prostate cancer,” Lect. Notes Comput. Sci. 2879, 364–372 (2003). 10.1007/b93811 [DOI] [Google Scholar]
- Fei B., Duerk J. L., and Wilson D. L., “Automatic 3D registration for interventional MRI-guided treatment of prostate cancer,” Comput. Aided Surg. 7, 257–267 (2002). 10.3109/10929080209146034 [DOI] [PubMed] [Google Scholar]
- Fei B., Muzic R., Lee Z., Flask C., Morris R., Duerk J. L., and Wilson D., “Registration of micro-PET and high resolution MR images of mice for monitoring photodynamic therapy,” Proc. SPIE 5369, 371–379 (2004). 10.1117/12.535465 [DOI] [Google Scholar]
- Chen X., Gilkeson R., and Fei B., “Automatic intensity-based 3D-to-2D registration of CT volume and dual-energy digital radiography for the detection of cardiac calcification,” Proc. SPIE 6512, 65120A (2007). 10.1117/12.710192 [DOI] [PMC free article] [PubMed] [Google Scholar]
- Fei B., Duerk J. L., Sodee D. B., and Wilson D. L., “Semiautomatic nonrigid registration for the prostate and pelvic MR volumes,” Acad. Radiol. 12, 815–824 (2005). 10.1016/j.acra.2005.03.063 [DOI] [PubMed] [Google Scholar]
- Fei B. W., Lee Z. H., Boll D. T., Duerk J. L., Sodee D. B., Lewin J. S., and Wilson D. L., “Registration and fusion of SPECT, high-resolution MRI, and interventional MRI for thermal ablation of prostate cancer,” IEEE Trans. Nucl. Sci. 51, 177–183 (2004). 10.1109/TNS.2003.823027 [DOI] [Google Scholar]
- Tomasi C. and Manduchi R., “Bilateral filtering for gray and color images,” in Proceedings of the Sixth International Conference on Computer Vision, (Bombay, India, 1998), pp. 839–846. 10.1109/ICCV.1998.710815 [DOI]
- Fattal R., Agrawala M., and Rusinkiewicz S., “Multiscale shape and detail enhancement from multi-light image collections,” ACM Trans. Graphics 26, 51–59 (2007). 10.1145/1276377.1276441 [DOI] [Google Scholar]
- Perona P. and Malik J., “Scale-space and edge detections using anistropic diffusion,” IEEE Trans. Pattern Anal. Mach. Intell. 12, 629–639 (1990). 10.1109/34.56205 [DOI] [Google Scholar]
- Canny J., “A computational approach to edge detection,” IEEE Trans. Pattern Anal. Mach. Intell. 8, 679–698 (1986). 10.1109/TPAMI.1986.4767851 [DOI] [PubMed] [Google Scholar]
- Higashi T., Saga T., Nakamoto Y., Ishimori T., Mamede M. H., Ishizu K., Tadamura E., Matsumoto K., Fujita T., Mukai T., and Konishi J., “Clinical impact of attenuation correction (AC) in the diagnosis of abdominal and pelvic tumors by FDG-PET with ordered subsets expectation maximization (OSEM) reconstruction,” J. Nucl. Med. 42, 298P (2001). [Google Scholar]
- Yang X. and Fei B., “A skull segmentation method for brain MR images based on multiscale bilateral filtering scheme,” Proc. SPIE, 7623, 76233K (2010). 10.1117/12.844677 [DOI] [Google Scholar]
- West J., Fitzpatrick J. M., Wang M. Y., Dawant B. M., C. R.MaurerJr., Kessler R. M., Maciunas R. J., Barillot C., Lemoine D., Collignon A., Maes F., Suetens P., Vandermeulen D., van den Elsen P. A., Napel S., Sumanaweera T. S., Harkness B., Hemler P. F., Hill D. L., Hawkes D. J., Studholme C., Maintz J. B., Viergever M. A., Malandain G., and Woods R. P., “Comparison and evaluation of retrospective intermodality brain image registration techniques,” J. Comput. Assist. Tomogr. 21, 554–566 (1997). 10.1097/00004728-199707000-00007 [DOI] [PubMed] [Google Scholar]
- Kwan R. K. S., Evans A. C., and Pike G. B., “MRI simulation-based evaluation of image-processing and classification methods,” IEEE Trans. Med. Imaging 18, 1085–1097 (1999). 10.1109/42.816072 [DOI] [PubMed] [Google Scholar]
- Wang H. and Fei B., “A modified fuzzy C-means classification method using a multiscale diffusion filtering scheme,” Med. Image Anal. 13, 193–202 (2009). 10.1016/j.media.2008.06.014 [DOI] [PMC free article] [PubMed] [Google Scholar]
- Yang X. F. and Fei B. W., “A multiscale and multiblock fuzzy C-means classification method for brain MR images,” Med. Phys. 38, 2879–2891 (2011). 10.1118/1.3584199 [DOI] [PMC free article] [PubMed] [Google Scholar]
- Cuadra M. B., Cammoun L., Butz T., Cuisenaire O., and Thiran J. P., “Comparison and validation of tissue modelization and statistical classification methods in T1-weighted MR brain images,” IEEE Trans. Med. Imaging 24, 1548–1565 (2005). 10.1109/TMI.2005.857652 [DOI] [PubMed] [Google Scholar]
- Fei B., Wang H., Muzic R. F., Flask C., Wilson D. L., Duerk J. L., Feyes D. K., and Oleinick N. L., “Deformable and rigid registration of MRI and microPET images for photodynamic therapy of cancer in mice,” Med. Phys. 33, 753–760 (2006). 10.1118/1.2163831 [DOI] [PubMed] [Google Scholar]
- Bogie K., Wang X., Fei B., and Sun J., “New technique for real-time interface pressure analysis: Getting more out of large image data sets,” J. Rehabil. Res. Dev. 45, 523–535 (2008). 10.1682/JRRD.2007.03.0046 [DOI] [PMC free article] [PubMed] [Google Scholar]
- Fei B., Lee Z., Duerk J., Wilson D., Gee J., Maintz J., and Vannier M., “Image registration for interventional MRI guided procedures: Interpolation methods, similarity measurements, and applications to the prostate,” Lect. Notes Comput. Sci. 2717, 321–329 (2003). 10.1007/b11804 [DOI] [Google Scholar]
- Delso G., Martinez-Moller A., Bundschuh R. A., Nekolla S. G., and Ziegler S. I., “The effect of limited MR field of view in MR/PET attenuation correction,” Med. Phys. 37, 2804–2812 (2010). 10.1118/1.3431576 [DOI] [PubMed] [Google Scholar]


