Abstract
Peptide fragmentation can lead to an oxazolone or diketopiperazine b2+ ion structure. IRMPD spectroscopy combined with computational modeling and gas-phase H/D exchange was used to study the structure of the b2+ ion from protonated HAAAA. The experimental spectrum of the b2+ ion matches both the experimental spectrum for the protonated cyclic dipeptide HA (a commercial diketopiperazine) and the theoretical spectrum for a diketopiperazine protonated at the imidazole pi nitrogen. A characteristic band at 1875 cm−1, and increased abundance of the peaks at 1619 and 1683 cm−1, indicate a second population corresponding to an oxazolone species. H/D exchange also shows a mixture of two populations consistent with a mixture of b2+ ion diketopiperazine and oxazolone structures.
Structures and mechanisms of formation of fragment ions from protonated molecules in the gas phase are of interest because these studies improve our knowledge of chemistry in the absence of solvent. In addition, determination of whether an isolated gas phase reaction occurs with formation of the kinetically or thermodynamically most stable product can be used to show how different substituents, such as different amino acid side chains, influence the outcome of a competitive reaction pathway. The formation and structure of peptide b2+ ions have been studied for a number of years. Two main structures have been proposed for b2+ ions. The N-terminal amino group can act as a nucleophile and attack the carbonyl carbon of the second amino acid residue, forming the thermodynamically more stable six-membered ring diketopiperazine structure, or the carbonyl oxygen from the first residue can act as the nucleophile and attack at the second carbonyl carbon to form the five-membered ring oxazolone structure.1 A recent statistical analysis of peptide fragmentation spectra revealed that a distinct subset of peptide MS/MS spectra can be classified based on the presence of a dominant b2/yn−2cleavage.2 A better understanding of b2+ ion formation and its presence or absence in peptide fragmentation spectra could improve peptide sequencing algorithms and the current models for peptide fragmentation.
Many studies have suggested that the oxazolone structure is the more likely b2+ isomer.3 These studies have focused on simple aliphatic residues such as alanine or glycine where the side chain is unlikely to be involved in the fragmentation mechanism. The presence of a basic side chain can influence the b2+ ion formation pathway and structure. Computational modeling of b2+ ions containing arginine and lysine showed that cyclic structures formed through side chain reactions were more stable than the oxazolone structures.4 O’Hair and coworkers compared the fragmentation patterns of histidine-containing b2+ ions from protonated HG-OMe, GH-OMe, HGG-OMe, and GHG-OMe with the GH diketopiperazine and found the fragmentation spectra to be very similar, suggesting the formation of a diketopiperazine b2+ ion.5 The HA b2+ ion is thus a strong candidate for spectroscopic and reactivity-based confirmation of the diketopiperazine structure.
A number of techniques can be used to probe ion structures. Multi-stage tandem mass spectrometry is often used to elucidate fragmentation pathways, shedding light on the structure of the parent ion. Tandem mass spectrometry is often combined with quantum chemical calculations and computational modeling to provide insights into possible structures, protonation sites, and conformations. Gas-phase hydrogen/deuterium (H/D) exchange has also been used to probe gas-phase structural features, including those of peptide ion fragments.6
Variable wavelength infrared multiple photon dissociation (IRMPD) spectroscopy combined with theoretical vibrational spectra has also been used as a powerful complementary technique for probing ion structure. IRMPD spectroscopy has been used to investigate fragment ion structure for several systems,7 including the determination of b2+ ion structure from protonated AGG, AAA, and tryptic model peptides.8
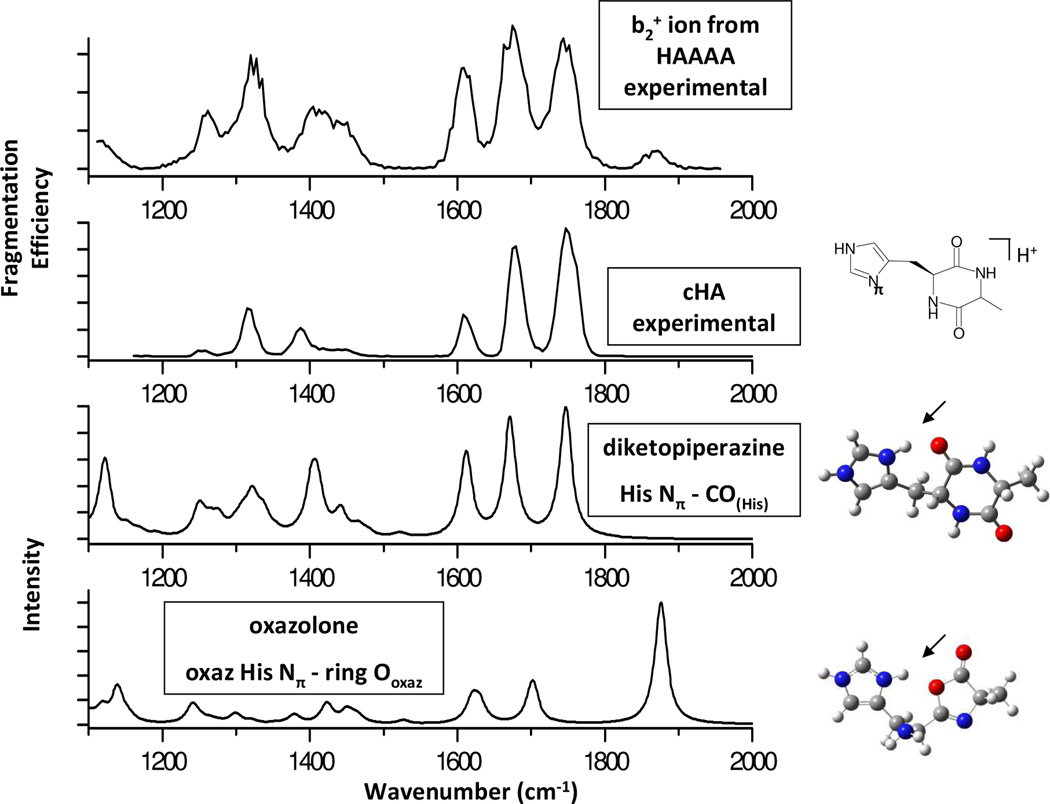
IRMPD spectroscopy results described here were obtained at the CLIO Free Electron Laser Facility in Orsay, France, with an electrospray ionization-Paul ion trap mass spectrometer (Bruker Esquire 3000+, modified as described previously; FTICR data are shown in Fig. S1).9 The protonated HA4 precursor ion was isolated in the ion trap and fragmented to generate the HA b2+ ion species that was then isolated for IRMPD fragmentation. Figure 1 shows the IRMPD spectra for the b2+ ion of HAAAA and the protonated cyclic dipeptide HA (cHA) along with the calculated IR vibrational spectra for the two protonated diketopiperazine and oxazolone structures that best match the experimental spectra. Calculations were performed using Gaussian 03 at the B3LYP/6-311++G** level.10
FIGURE 1.
IRMPD spectra (fragmentation efficiency vs. wavenumber) of a) the b2+ ion produced by CID fragmentation of protonated HA4 and b) protonated cyclic HA dipeptide. Calculated spectra for selected c) diketopiperazine and d) oxazolone structures. Arrows indicate protonation site.
The major fragments produced by IRMPD for both HA b2+ ion and cHA appear at m/z 192 (loss of NH3) and m/z 181 (loss of CO). Fragments also appear at m/z 148 (192-CO2), m/z 164 (181-NH3) and m/z 136 (181-NH3-CO). Geometry optimization and frequency calculations were performed on diketopiperazine, oxazolone, and acylium ion structures. Table S1 (Supplementary Information) summarizes the relative energies for calculated structures with different protonation sites (see SI). The diketopiperazine structure with a proton bridged between the imidazole pi nitrogen (Nπ) and the adjacent His carbonyl oxygen (COHis) corresponds to the lowest energy structure (Fig 1c). Among the oxazolone structures, the lowest energy structures have a proton bridged between the Nπ and the oxazolone ring nitrogen (ring Noxaz), between the Nπ and the His amino group (Namino), or between the Nπ and the oxazolone ring oxygen (ring Ooxaz) (Fig 1d). All oxazolone structures are higher in energy by >85 kJ/mol compared to the most stable diketopiperazine structures (see SI). This large calculated energy difference between the most stable diketopiperazine and the oxazolone structures is consistent with the theoretical results for HisGly obtained by O’Hair and coworkers.5 In addition, the energy difference between the lowest energy diketopiperazine and the oxazolones is much greater for HA (~85 kJ/mol) than for the previously reported AlaGly case (~17 kJ/mol).8a
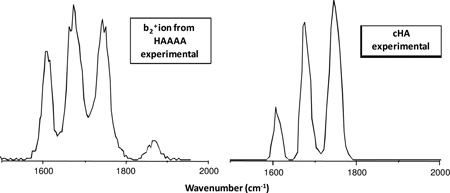
The theoretical diketopiperazine vibrational spectrum for the diketo His Nπ-CO(His) structure (Fig 1c) shows excellent agreement to the spectrum for protonated cHA (a commercial diketopiperazine, Fig 1b). The three major peaks corresponding to carbonyl and ring stretching modes of the diketopiperazine are present in the experimental spectrum: 1748 cm−1 corresponds to the unprotonated Ala carbonyl amide stretching mode (amide I mode); 1683 cm−1 results from simultaneous stretching at the bridging His carbonyl group and the protonated imidazole ring, and 1619 cm−1 corresponds to the ring breathing mode for the imidazole side chain. The HA b2+ spectrum also contains these three bands matching a diketopiperazine structure. An additional band, however, is present at 1875 cm−1, which matches the carbonyl stretching band from the oxazolone theoretical spectrum for a protonated form as shown in Figure 1d. The presence of features from both the diketopiperazine and oxazolone theoretical spectra indicate that the HA b2+ ion is a mixture of the two structures. In contrast to the aliphatic side chain b2+ ions previously reported as oxazolones, it is plausible that the basicity of the His side chain allows diketopiperazine formation by serving as a protonation site, allowing the unprotonated nucleophilic N-terminal amine to attack the second carbonyl. A systematic study of b2+ formation for His analogues is underway to test this hypothesis.
Gas-phase hydrogen/deuterium (H/D) exchange also serves as a technique for probing gas-phase structure. When a less basic deuterating reagent such as CD3OD or D2O is used, Beauchamp and coworkers proposed the ‘relay mechanism’ to explain deuterium incorporation into the analyte, where a bridging deuterated solvent molecule inserts between two relay sites.11 Computational modeling was performed to identify intermediates for the relay mechanism using the diketopiperazine and oxazolone structures. In the diketopiperazine structure, the water bridges from the π nitrogen in the histidine side chain to the neighboring carbonyl oxygen, consistent with exchange of one hydrogen. In the oxazolone, the water bridges between the amino group and the π nitrogen in the histidine side chain, which allows for up to three exchanging hydrogens (Figure S2). These exchange patterns can be used as signatures for the two structures. The AG b2+ ion, e.g., which was confirmed as an oxazolone structure by IRMPD spectroscopy,8a shows three exchanges (data not shown).
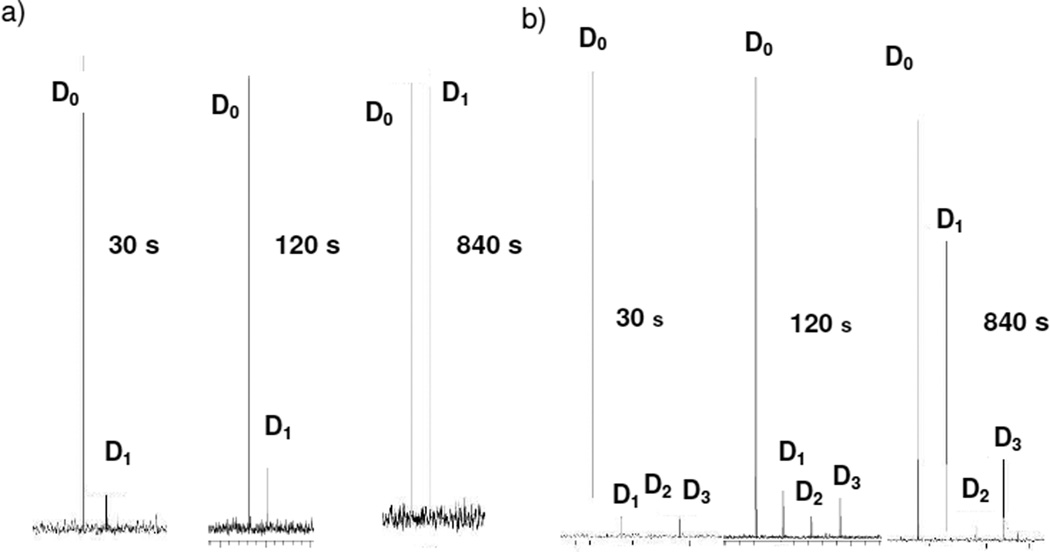
An IonSpec 4.7 T Fourier transform ion cyclotron resonance instrument was used to perform the H/D exchange studies. The cHA ion was produced by ESI and transferred to the ICR cell while the b2+ ion from HA4 was generated by SORI-CID (1–3V, 500 ms) in the cell. Each ion of interest was isolated in the cell and subjected to exchange with CD3OD (~1×10⁻⁷ torr) for 5–840 seconds. Figure 2a shows the H/D exchange for the protonated cHA at increasing exchange times with CD3OD. Even at extended exchange times (bottom), the cHA diketopiperazine structure has only exchanged one hydrogen. H/D exchange results for the b2+ ion from HA4 are shown in Figure 2b. In addition to the population that incorporates only one deuterium, a faster exchanging population is detected that incorporates up to three deuterium atoms (see also Figure S3).
FIGURE 2.
H/D exchange of a) protonated cHA and b) HA b2+ ion with increasing exchange time.
In conclusion, IRMPD spectroscopy shows that the HA b2+ ion is a mixture of diketopiperazine and oxazolone structures. H/D exchange of the b2+ ion from HA4 also shows the presence of a second population with exchange behavior matching the signature of an oxazolone structure, providing further support that the HA b2+ ion is a mixture of both diketopiperazine and oxazolone structures. This is the first spectroscopic evidence for a diketopiperazine b2+ ion structure and for the presence of a mixture of b2+ ion structures. Additional studies are needed to determine which other sequences produce diketopiperazine vs. oxazolone structures or a mixture of b2+ ion structures.
Supplementary Material
Acknowledgment
The authors thank the CLIO team, P. Maitre, J. Lemaire, B. Rieul, V. Steinmetz and C. Boisseau, for assistance and expertise. This research was supported by NIH grant GMR01-51387 to VHW. Financial support by the European Commission EPITOPES project (NEST 15367) is gratefully acknowledged.
Footnotes
Supporting Information Available: Table S1, Figure S1–3 and complete ref 1, 3, 6, 8, 10. This material is available free of charge via the Internet at http://pubs.acs.org
References
- 1.(a) Yalcin T, et al. J. Am. Soc. Mass Spectrom. 1995;6:1165–1174. doi: 10.1016/1044-0305(95)00569-2. [DOI] [PubMed] [Google Scholar]; (b) Nold MJ, et al. Int. J. Mass Spectrom. Ion Proc. 1997;164:137–153. [Google Scholar]; (c) Vaisar T, Urban J. European Mass Spectrom. 1998;4:359–364. [Google Scholar]; (d) Haselmann KF, et al. Rapid Commun. Mass Spectrom. 2000;14:2242–2246. doi: 10.1002/1097-0231(20001215)14:23<2242::AID-RCM158>3.0.CO;2-O. [DOI] [PubMed] [Google Scholar]; (e) Paizs B, et al. Int. J. Mass Spectrom. 2002;219:203–232. [Google Scholar]; (f) Riba-Garcia I, et al. J. Am. Soc. Mass Spectrom. 2008;19:609–613. doi: 10.1016/j.jasms.2008.01.005. [DOI] [PubMed] [Google Scholar]
- 2.Savitski MM, Hith M, Fung YME, Adams CM, Zubarev RA. J. Am. Soc. Mass Spectrom. 2008;19:1755–1763. doi: 10.1016/j.jasms.2008.08.003. [DOI] [PubMed] [Google Scholar]
- 3.(a) Eckart K, et al. J. Am. Soc. Mass Spectrom. 1998;9:1002–1011. [Google Scholar]; (b) Harrison AG, et al. J. Am. Soc. Mass Spectrom. 2000;11:427–436. doi: 10.1016/S1044-0305(00)00104-5. [DOI] [PubMed] [Google Scholar]; (c) Paizs B, Suhai S. Rapid Commun. Mass Spectrom. 2002;16:375–389. doi: 10.1002/rcm.586. [DOI] [PubMed] [Google Scholar]; (d) Paizs B, Suhai S. J. Am. Soc. Mass Spectrom. 2003;14:1454–1469. doi: 10.1016/j.jasms.2003.07.001. [DOI] [PubMed] [Google Scholar]; (e) El Aribi H, et al. J. Am. Chem. Soc. 2003;125:9229–9236. doi: 10.1021/ja0207293. [DOI] [PubMed] [Google Scholar]; (f) El Aribi H, et al. J. Phys. Chem. B. 2004;108:18743–18749. [Google Scholar]; (g) Bythell BJ, et al. J. Am. Soc. Mass Spectrom. 2007;18:1291–1303. doi: 10.1016/j.jasms.2007.03.029. [DOI] [PubMed] [Google Scholar]
- 4.Farrugia JM, O'Hair RAJ, Reid GE. Int. J. Mass Spectrom. 2001;210:71–87. [Google Scholar]
- 5.Farrugia JM, Taverner T, O'Hair RAJ. Int. J. Mass Spectrom. 2001;209:99–112. [Google Scholar]
- 6.(a) Somogyi Á. J. Am. Soc. Mass Spectrom. 2008;19:1771–1775. doi: 10.1016/j.jasms.2008.08.012. [DOI] [PubMed] [Google Scholar]; (b) Sawyer HA, et al. J. Am. Soc. Mass Spectrom. 2005;16:893–905. doi: 10.1016/j.jasms.2005.03.002. [DOI] [PubMed] [Google Scholar]; (c) Polfer NC, Oomens J. Phys. Chem. Chem. Phys. 2007;9:3804–3817. doi: 10.1039/b702993b. [DOI] [PubMed] [Google Scholar]
- 7.(a) Polfer NC, Oomens J, Suhai S, Paizs B. J. Am. Chem. Soc. 2005;127:17154–17155. doi: 10.1021/ja056553x. [DOI] [PubMed] [Google Scholar]; (b) Polfer NC, Oomens J, Suhai S, Paizs B. J. Am. Chem. Soc. 2007;129:5887–5897. doi: 10.1021/ja068014d. [DOI] [PubMed] [Google Scholar]; (c) Frison G, van der Rest G, Turecek F, Besson T, Lemaire J, Maitre P, Chamot-Rooke J. J. Am. Chem. Soc. 2008;130:14916–14917. doi: 10.1021/ja805257v. [DOI] [PubMed] [Google Scholar]
- 8.(a) Yoon SH, et al. J. Am. Chem. Soc. 2008;130:17644–17645. doi: 10.1021/ja8067929. [DOI] [PMC free article] [PubMed] [Google Scholar]; (b) Oomens J, et al. J. Am. Soc. Mass Spectrom. 2009;20:334–339. doi: 10.1016/j.jasms.2008.10.012. [DOI] [PubMed] [Google Scholar]; (c) Bythell BJ, et al. Chem. Phys. Chem. 2009;10:883–885. [Google Scholar]
- 9.Mac Aleese L, et al. Int. J. Mass Spectrom. 2006;249–250:14–20. [Google Scholar]
- 10.Frisch MJ, et al. 2004 [Google Scholar]
- 11.Campbell S, Rodgers MT, Marzluff EM, Beauchamp JL. J. Am. Chem. Soc. 1995;117:12840–12854. [Google Scholar]
Associated Data
This section collects any data citations, data availability statements, or supplementary materials included in this article.


